Sample Category Title
EUR/GBP Daily Outlook
Daily Pivots: (S1) 0.8465; (P) 0.8482; (R1) 0.8494; More...
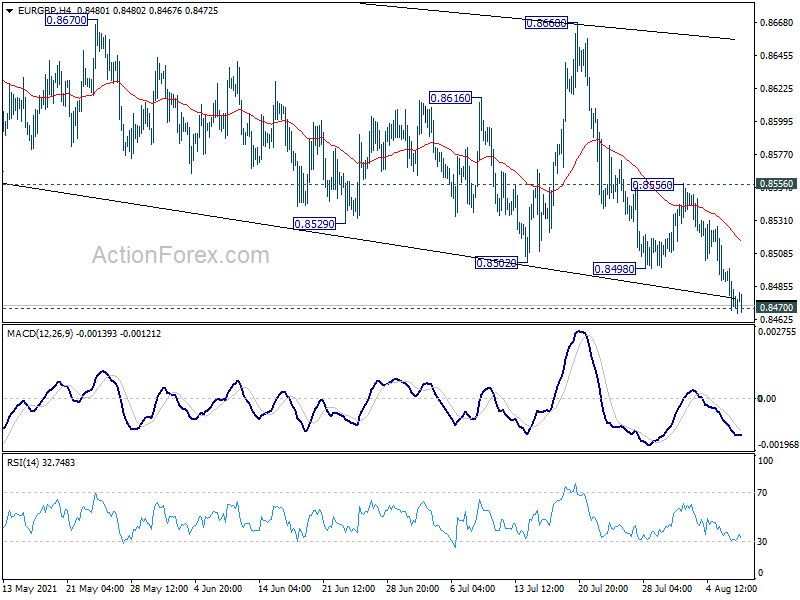
Intraday bias in EUR/GBP remains on the downside with focus on 0.8470 low. Decisive break there will resume larger fall from 0.9499, towards next key support at 0.8276. On the upside, break of 0.8556 will indicate short term bottoming and turn bias back to the upside for strong rebound.
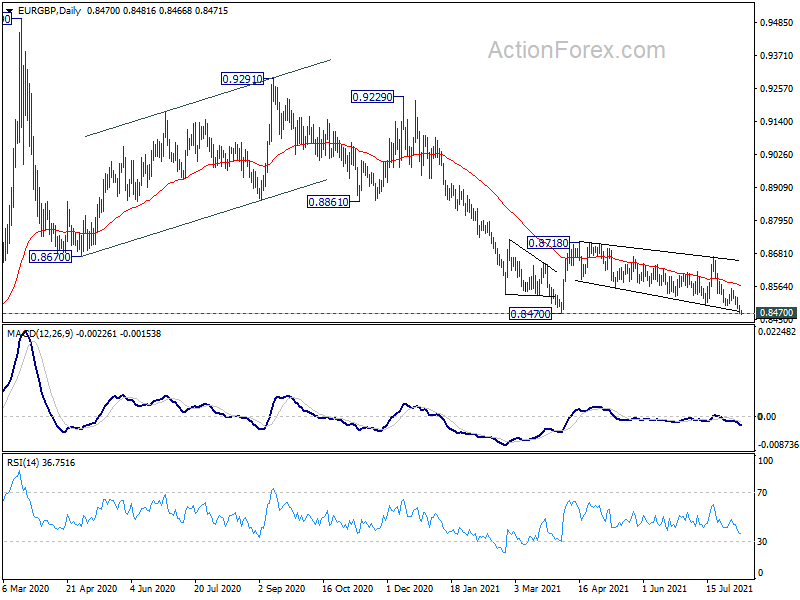
In the bigger picture, price actions from 0.9499 are still seen as developing into a corrective pattern. Deeper fall could be seen as long as 0.8718 resistance holds. Firm break of 0.8470 will target long term support at 0.8276. However, firm break of 0.8718 would argue that a medium term bottom was already formed. Stronger rise would be seen to 0.8861 support turned resistance to confirm completion of the corrective pattern.
XAU/USD Tests 4-Month Low
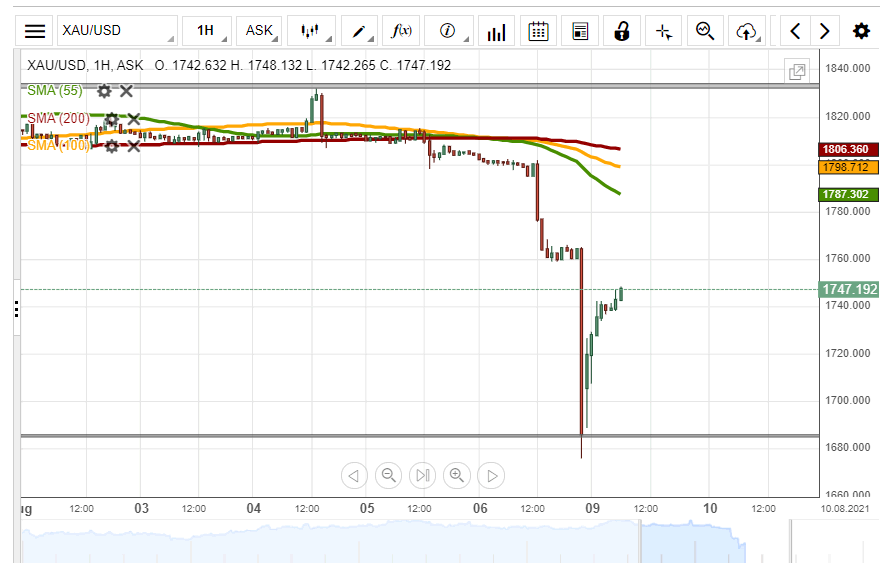
The yellow metal's price has plummeted by 6.55% since Friday's trading session. However, the commodity rebounded from a support line at 1686.1 during the Asian session on Monday.
The exchange rate could continue to edge higher during the following trading session. The potential target for buyers will be near the 55– hour simple moving average at 1792.4.
Though, bullish traders are likely to encounter resistance near the 1760.00 level within Monday's trading session.
EUR/AUD Daily Outlook
Daily Pivots: (S1) 1.5959; (P) 1.5989; (R1) 1.6023; More...
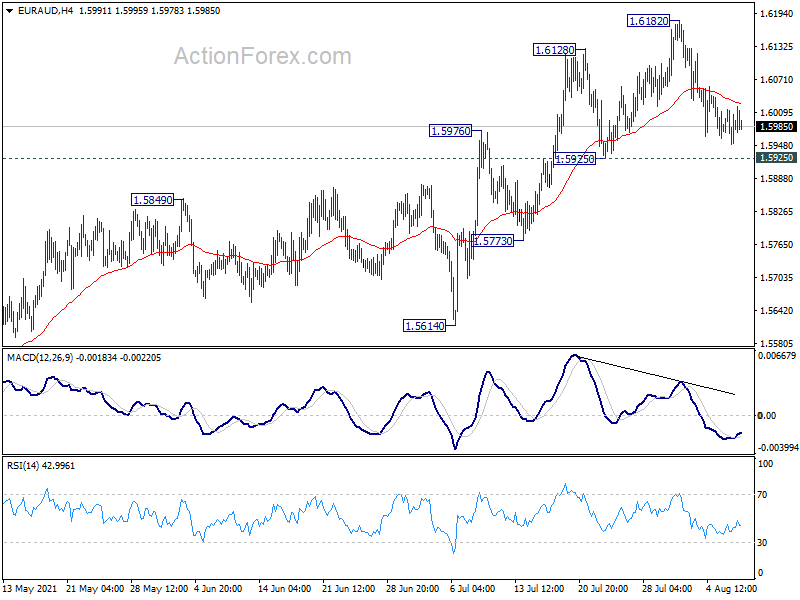
Intraday bias in EUR/AUD remains neutral for more sideway trading first. Further rise is expected as long as 1.5925 support holds. On the upside, break of 1.6182 will resume the rise from 1.5250 to 1.6827 resistance next. However, on the downside, firm break of 1.5925 will bring deeper fall back to 1.5614 structural support instead.
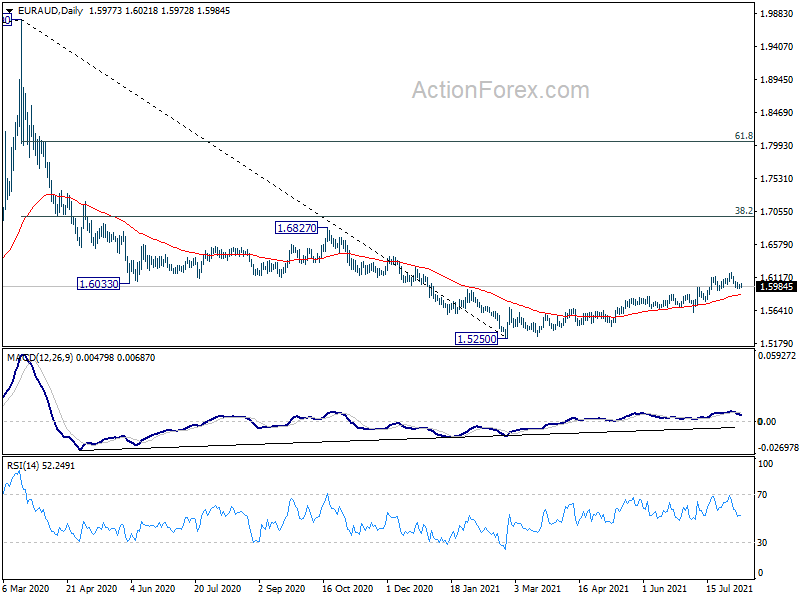
In the bigger picture, a medium term bottom was formed at 1.5250, on bullish convergence condition in daily MACD. Rise from 1.5250 is currently seen as a correction to the down trend from 1.9799 first. Stronger rise would be seen to 38.2% retracement of 1.9799 to 1.5250 at 1.6988 next. We'd tentatively expect strong resistance from there to limit upside, at least on first attempt. Meanwhile, break of 1.5614 support will indicate that the rebound has completed and bring retest of 1.5250 low.
EUR/CHF Daily Outlook
Daily Pivots: (S1) 1.0734; (P) 1.0749; (R1) 1.0779; More....
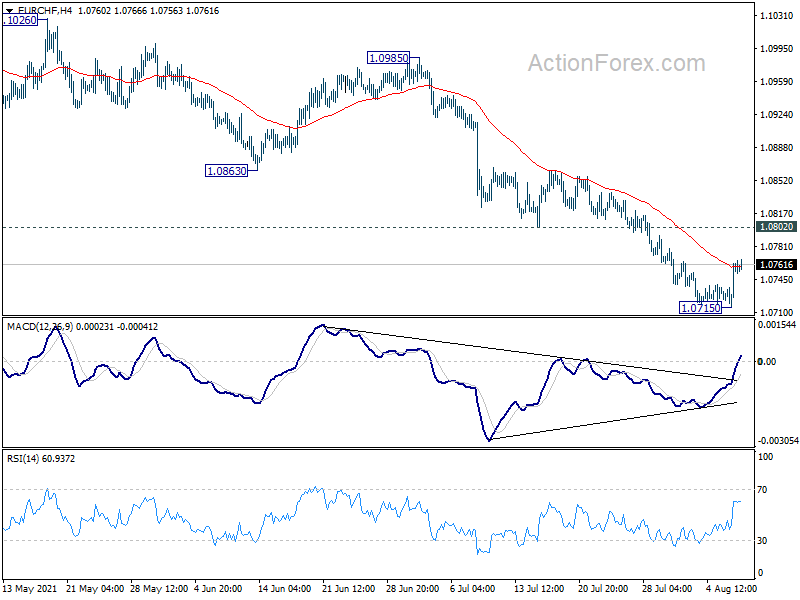
Intraday bias in EUR/CHF remains neutral for the moment and some more consolidations could be seen above 1.0715 temporary low. Outlook will stay bearish as long as 1.0802 support turned resistance holds. On the downside, break of 1.0715 will resume larger fall from 1.1149 to retest 1.0505 low. On the upside, though, break of 1.0802 will indicate short term bottoming and bring stronger rebound first.
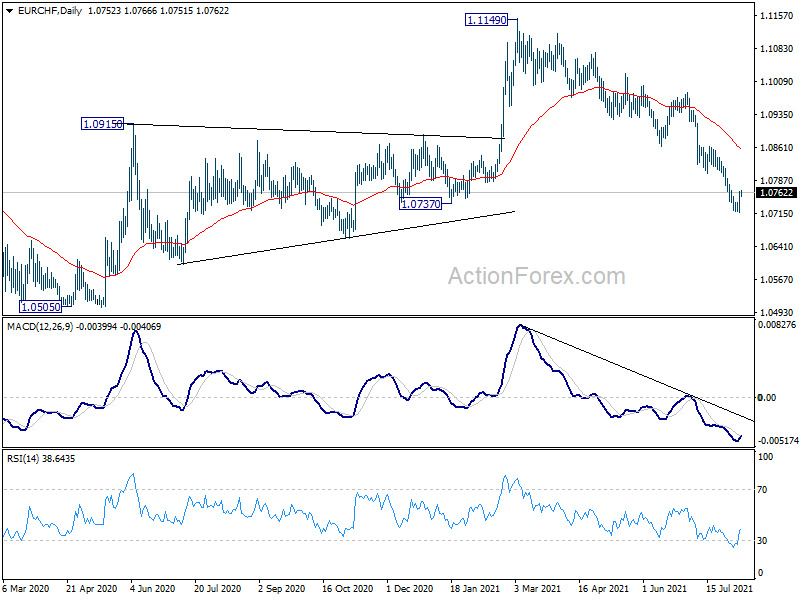
In the bigger picture, rebound from 1.0505 (2020 low) should have completed at 1.1149 already. The three wave corrective structure argues that the downtrend from 1.2004 (2018 high) is not over yet. Medium term outlook will now stay bearish as long as 1.1149 resistance holds. Break of 1.0505 low would be seen at a later stage.
Daily Tecnical Analysis
EUR/USD
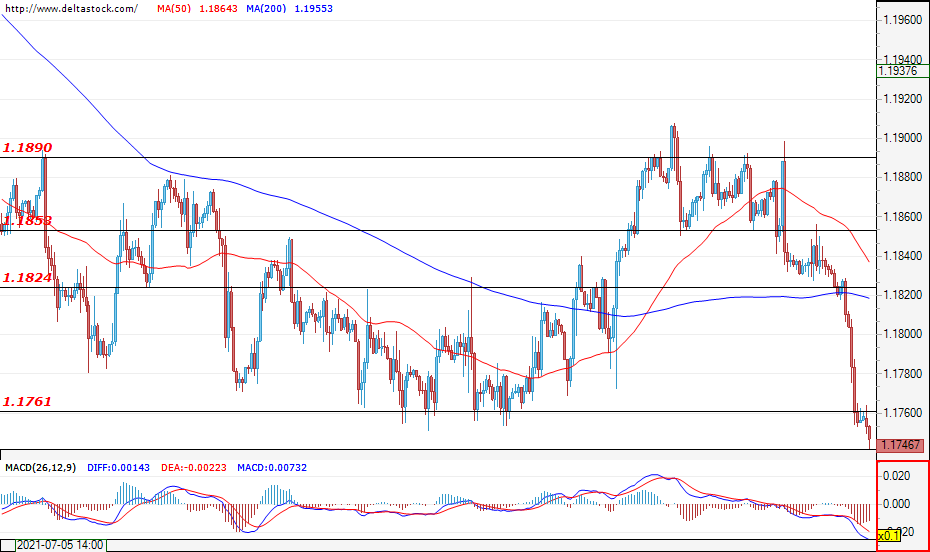
Current level - 1.1746
The nonfarm payrolls data published in the last trading session allowed the bears to enter the market and the U.S. Dollar has strongly appreciated against the euro. At the time of writing, we are witnessing a successful breach of the critical support at 1.1760. This is a clear signal that the pair will most probably continue its downward movement attacking the next level located at 1.1700. In the opposite direction the first important resistance lies at 1.1824. This week, investors' attention will be focused on the data on the ZEW Economic Sentiment (Tuesday; 09:00 GMT) and the Core CPI for the US (Wednesday; 12:30 GMT).
| Resistance | Support | ||
| intraday | intraweek | intraday | intraweek |
| 1.1760 | 1.1850 | 1.1700 | 1.1650 |
| 1.1824 | 1.1890 | 1.1650 | 1.1600 |
USD/JPY
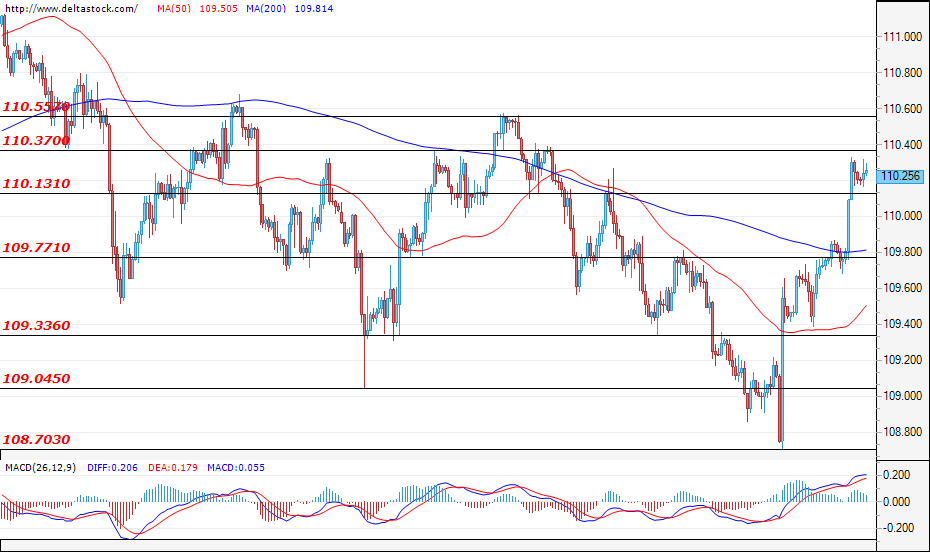
Current level - 110.25
The appreciation of the U.S. dollar against the Japanese yen was limited to just below the resistance level at 110.37. It is possible to witness a consolidation in the range 110.13 - 110.37. Only a breach оf the resistance at 110.37 would give the bulls a chance to enter the market and lead the pair towards the next level at 110.55. However, a breach of the support at 110.13 would be a signal for sell-offs toward the support at 109.77.
| Resistance | Support | ||
| intraday | intraweek | intraday | intraweek |
| 110.13 | 110.37 | 109.77 | 109.04 |
| 110.37 | 110.55 | 109.36 | 108.70 |
GBP/USD
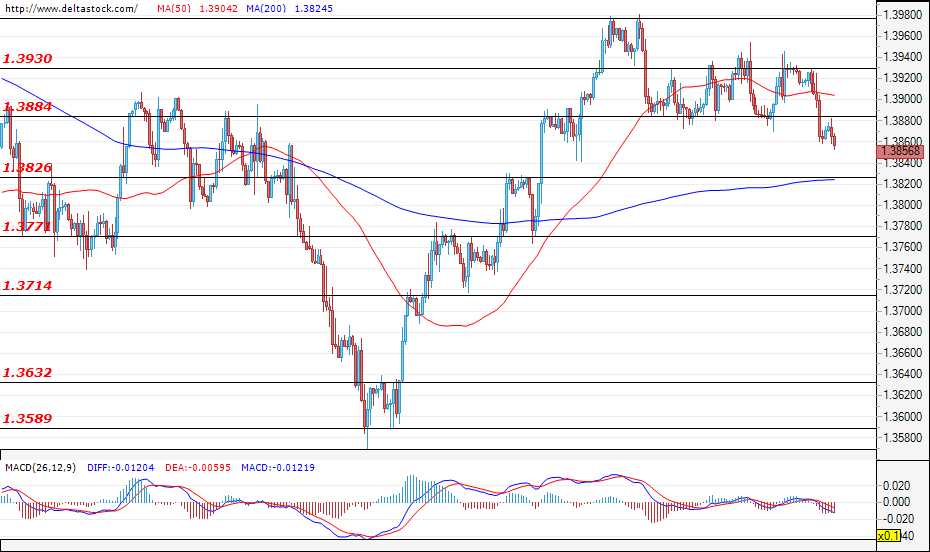
Current level - 1.3856
After the successful breach of the support at 1.3884 the currency pair manages to hold below this level, and the sentiments are similar to those for the EUR/USD. The expectations are for an appreciation of the U.S. Dollar against the other major currencies, leading the pair towards a test of the support at 1.3826, which has a chance to be successful. If this scenario does not become a reality, we may witness a move towards the resistance at 1.3830. The most significant economic events for this week are the announcement of the data on the manufacturing production and the GDP for the UK that will be announced on Thursday at 06:00 GMT.
| Resistance | Support | ||
| intraday | intraweek | intraday | intraweek |
| 1.3930 | 1.4060 | 1.3884 | 1.3771 |
| 1.3977 | 1.4115 | 1.3826 | 1.3714 |
EURUSD Neutral Bias
Technical analysis
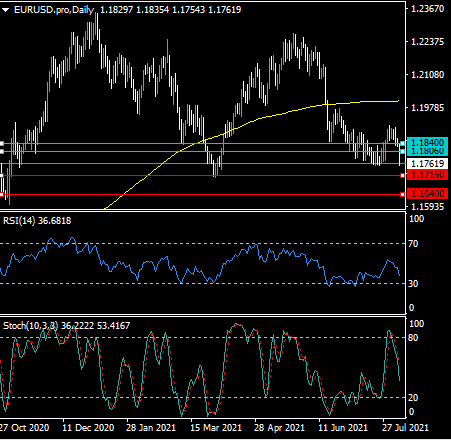
The EURUSD pair is bearish on the daily time frame according to Relative Strength Index and also the Stochastic indicator.
The daily time frame still shows that a rebound is possible while the EURUSD pair trades above the key former swing-low, close to the 1.1715 support level.
What the possible outcomes are
In our most likely scenario, the EURUSD pair will start to find support around the 1.1730 area and then trade back towards the 1.1840 resistance area.
Alternatively, the bearish daily trend continues and the EURUSD pair will break the 1.1700 support level and then fall towards the 1.1640 support level.
Key levels
Support 1.1715 1.1640
Resistance 1.1806 1.1840
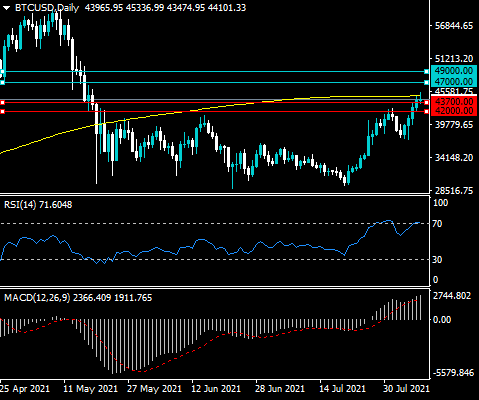
BTCUSD Bullish Bias
Technical analysis
The daily time frame shows that the RSI indicator is overbought, however, the MACD indicator on the mentioned time frame is still issuing a strong buy signal.
The BTCUSD pair has finally tested towards its trend defining 200-day moving average, although bulls have struggled with it so far.
What the possible outcomes are
In our most likely scenario, the BTCUSD pair starts to trade above its 200-day moving average and rallies towards the $47,000 and $49,000 resistance levels.
Alternatively, the BTCUSD pair will stage a sizeable correction down towards the $42,700 level and recover back towards its 200-day moving average.
Key levels
Support $43,700 $42,000
Resistance $47,000 $49,000
XAUUSD Still Bearish
Technical analysis
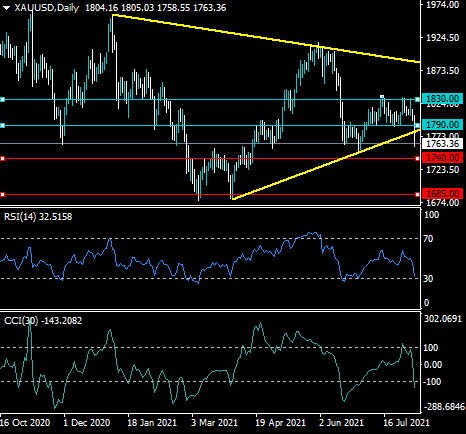
The Relative Strength Index and the Commodity Channel Index indicators show that gold is heavily oversold after tlast Friday’s major price sell-off.
The daily time frame also shows that a major breakout has taken place from a triangle pattern after the price fell below the $1,790 support level..
What the possible outcomes are
In our most likely scenario, XAUUSD pair will bounce from the $1,740 price area back towards the $1,790 level as the yellow-metal is now oversold.
Alternatively, XAUUSD pair will continue to break to the downside and test towards critical technical support, around the $1,685.
Key levels
Support $1,740 $1,685
Resistance $1,790 $1,830
NZDUSD Bearish Bias
Technical analysis
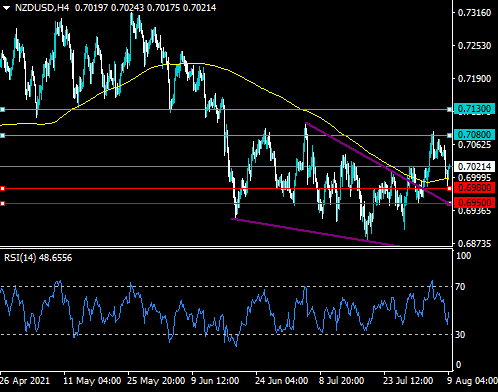
The RSI indicator remains bearish on the four-hour time frame after last week strong reversal from the 0.7080 price area.
The NZDUSD pair looks to be targeting towards a technical restest of the top of falling price channel, which is located close to the 0.6950 area.
What the possible outcomes are
In our most likely scenario, the NZDUSD pair will test towards the top of the falling wedge pattern and then stage a rebound back towards the 0.7130 level.
Alternatively, the NZDUSD could have already found a price floor this morning and will now start to rebound back towards the 0.7130 resistance level.
Key levels
Support 0.6980 0.6950
Resistance 0.7080 0.7130
USDCAD Bearish Bias
Technical analysis
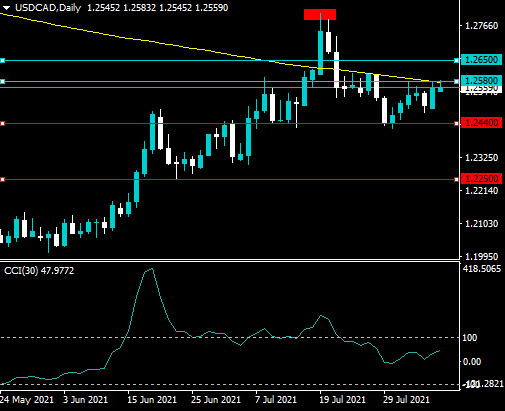
The daily time frame continues to show a large head and shoulders pattern is still valid despite last week’s strong price recovery in the USDCAD pair.
The USDCAD pair remains technically bearish under its trend defining 200-day moving average, which is located close to the 1.2580 resistance level.
What the possible outcomes are
In our most likely scenario, the USDCAD pair will test back towards its 200-day moving average and then start to decline back towards the 1.2250 support level.
Alternatively, the USDCAD pair could start to decline from current levels and remain in a range between the 1.2600 and 1.2440 price levels.
Key levels
Support 1.2440 1.2250
Resistance 1.2580 1.2650