Sample Category Title
Asian Equities Rise on China Easing Expectations
Asian equities are modestly positive despite weaker China trade data.
On Friday, blockbuster US jobs data put the economic recovery back on track with investors and saw the S&P 500 and Dow Jones finish higher while the pandemic-darling Nasdaq eased slightly. The S&P 500 rose 0.17%, with the Nasdaq falling by 0.40%, while the Dow Jones climbed by 0.41%. To put it in context, though, all three major indices remain at or near record highs.
US index futures have eased in Asia, with Nasdaq futures notably down by 0.35%. That has not dampened spirits in Asia, where a Japan and Singapore holiday has thinned out the trading volume. Investors are focusing on China, where the weakness in the weekend trade data has seen commodity prices, notably iron ore, fall today. It has also raised expectations that China will look to ease monetary conditions or enact more stimulus as the week import data raise fears that domestic demand is falling.
That sees China’s Shanghai Composite rising 0.85%, with the CSI 300 climbing by 0.80% and the Hang Seng jumping by 1.15%. The rally in China has lifted regional equities slightly, offsetting the taper nerves from the US and Asia’s ongoing pandemic woes. The Kospi is just 0.10% higher, while Taipei has followed the Nasdaq South, falling by 0.50%. However, Kuala Lumpur is 0.45% higher, with Manila jumping 0.80% and Bangkok rising 0.65%, with Jakarta 0.20% higher. Australian markets are also cautious with lockdowns extending to regional New South Wales today. The ASX 200 and All Ordinaries are just 0.10% higher.
China regulatory risk has not gone away and is likely to limit the cautious gains today, which will also cap gains in regional markets. Pandemic nervousness will also temper spirits, particularly in China, where a rapid spread of the delta variant would be a game-changer for the region’s recovery outlook. Today’s fall in iron ore and other base metal prices may also only be temporary.
European markets will likely open unchanged to slightly lower, with falling China Imports rattling some nerves in Germany in particular. That will be, to some extent, offset by the fall in the Euro on Friday, making Eurozone export pricing more attractive. With a thin calendar in Europe and the US, markets will likely spend the session chasing their tails on news headlines.
Silver stabilized after initial dive, but more downside still expected
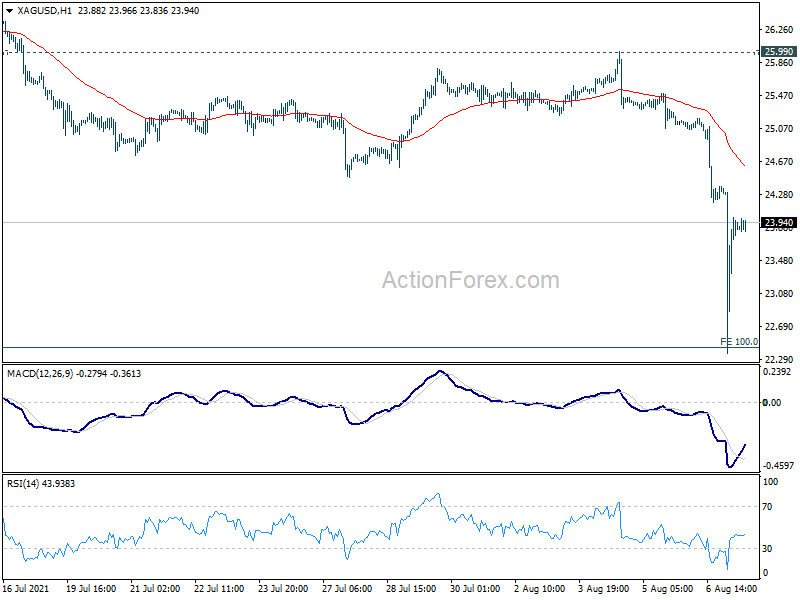
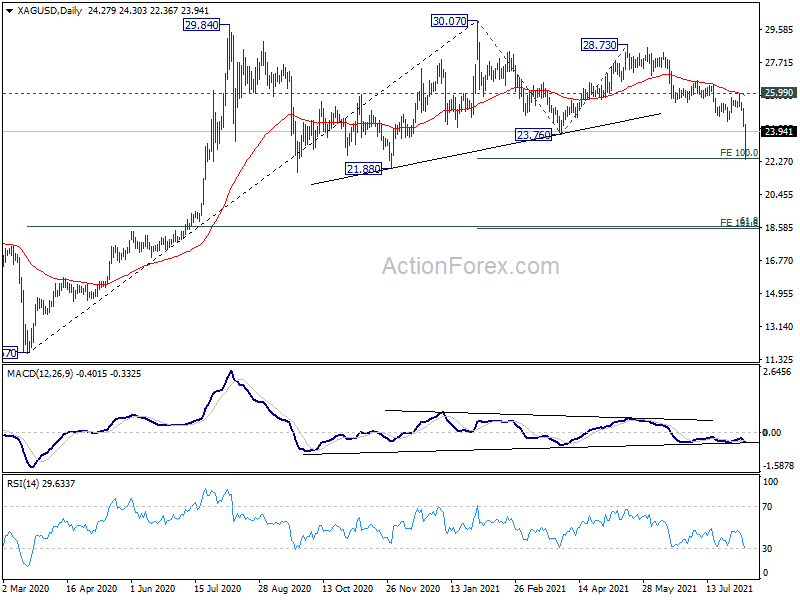
Silver tumbled along with Gold in ultra thin Asian open, and hit as low as 22.36. While it quickly rebounded, near term outlook will stay bearish as long as 25.99 resistance holds. Prior rejection by 55 day EMA also affirmed near term bearishness. Fall from 30.07 is seen as corrective whole up trend from 11.67 low.
There are various interpretations on the price actions. One way to see them is that a head and shoulder top was formed (ls: 29.84; head: 30.07; rs: 28.73). But in any case, firm break of 100% projection of 30.07 to 23.76 from 28.73 at 22.42 will pave the way to 161.8% projection at 18.52. That is close to 61.8% retracement of 11.67 to 30.07 at 18.69. That's probably the level where Silver would complete the correction.
China Nerves Sink Oil Again
Oil remains under pressure.
Despite impressive US employment data on Friday, oil prices fell as the US Dollar rallied strongly. What are disturbing oil markets the most, though, is the delta-variant Covid-19 strain which has vast swathes of the planet in its grip. That is increasing fears that the global recovery will stutter and become very uneven, thus reducing oil consumption even as OPEC+ continues to increase production.
The declining pace of China Imports released over the weekend, which featured a massive fall in crude imports, has darkened the mood further in Asia today. Markets are also nervously watching the track of delta-variant Covid-19 on the mainland, where lockdowns and travel restrictions already in place have oil traders on edge.
Trading liquidity is being hampered in Asia, with both Japan and Singapore on holiday. Brent crude fell by 1.30% to $70.30 a barrel on Friday, falling another 1.30% to $70.35 in Asia today. WTI fell by 1.60% to $68.00 a barrel on Friday before falling another 1.55% to $66.95 in Asia today.
Both contracts look vulnerable to more bad news on the virus front, focusing on Mainland China. Markets will be sensitive to headlines suggesting that China’s economic recovering is peaking as well after the weekend trade data.
Both Brent and WTI have fallen through their 100-DMAs this morning at $69.85 and $67.25, respectively. These form intra-day resistance followed by $70.00 for Brent and $68.00 for WTI. The capitulation sell-off lows from the 20th of July are immediate support. That is $67.50 for Brent and $65.10 for WTI. Failure targets $64.50 and $62.00 a barrel, respectively.
Unlike the massive sell-off of the 19th and 20th of July, oils fall this time is not driven by a mass culling of speculative longs, but rather, fears that the economic recovery is faltering or could falter badly. That is an underlying structural premise of oil’s rally this year, and as such, both contracts remain vulnerable to more bad news on that front and could well move into new medium-term ranges well below $70.00 a barrel.
Gold’s Asian Holiday Trainwreck
This morning, a liquidity black hole, exacerbated by a Japan and Singapore holiday, saw gold plummet $87.00 to around $1680.00 an ounce in a stop-loss and algorithmic selling negative feedback loop. The trigger appears to be a fall through critical support at $1750.00 an ounce after US futures margin servers were turned on at 7 am Tokyo time. There is also likely to be a vast discrepancy in what gold's actual low was today, as the lack of a centralised trading venue mean a low in one venue could be utterly different to that in another. Think the GBP/USD low post-Brexit vote, or EUR/CHF post-SNB. Sales desks around the world will no doubt enjoy sorting that out today.
Bargain hunters have quickly appeared post the sell-off, and gold and silver have both recovered much of their losses as liquidity proved equally elusive on the way back up. Gold is now just 1.45% lower at 1738.00 an ounce, and silver is 1.95% lower at $23.8775 an ounce. Among the tears, some lucky few have picked up some intra-day bargains today. As the saying goes, one man's muck is another man's treasure.
Notably, gold has failed to recapture the critical $1750.00 an ounce region, which now forms initial resistance. That is a negative technical development, and as the dust settles, gold looks to be a sell on rallies. Support is between $1675.00 and $1680.00 an ounce, a series of notable daily lows from both this morning and back in March and April.
With Fed tapering now much likely to start in Q4 after the Friday Non-Farm Payroll data, strengthening the US Dollar and lifting US bond yields higher, gold faces some severe structural headwinds. As noted last week, and I will bake in the rays of my genius/luck for just a moment, gold had been trading very poorly in the face of greenback strength, even before the Tyson-like knock-out punch of Friday.
With that in mind, gold is unlikely to rally above the $1800.00 region anytime soon but does look overdone under $1700.00 for now. In gold's defence, the relative strength index (RSI) is entering oversold territory, which usually provides some shorter-term support over a few days. I expect gold to trade in a choppy $1700.00 to $1800.00 an ounce ranges this week.
Failure of the critical $1675.00 to $1680.00 an ounce long-term support zone will be a game-changer. A weekly close under this area will signal more losses targeting the $1500.00 an ounce region.
USD Index Gains Momentum After Jobs And Infrastructure Progress
The US dollar accelerated its bullish momentum after strong economic numbers and progress on infrastructure spending. The dollar index rose $92.85, which was higher than last week’s low of $92.50. Data published on Friday showed that the economy added more than 900k jobs in July while the unemployment rate declined to 5.3% in July. Meanwhile, the Senate inched towards a $1 trillion infrastructure deal that will see the country build more roads and bridges, fund Amtrack, and invest in clean energy. Still, the impact of the bill to the economy will be muted since it will be implemented over a 10-year period.
US stock futures declined by more than 95 points even after Warren Buffett’s Berkshire Hathaway published strong results. The company’s total profits jumped by 7% in the second quarter as most of its portfolio companies did well. It made $28.1 billion, with its operating income rising to $6.7 billion. Among its best performers were railroads like BNSF. Its cash pile rose to $144 billion. Meanwhile, data published by Refinitiv showed that profits at all companies in the S&P 500 index rose by 93% in the second quarter from a year ago.
The economic calendar will be relatively muted today. Earlier on, China published inflation data, where the headline CPI rose by 1.0% and the producer price index (PPI) rose by 9.0%. The key data to watch will be the Switzerland unemployment rate and German trade data. In the US, the Bureau of Labour Statistics will publish the JOLTS job openings report.
EURUSD
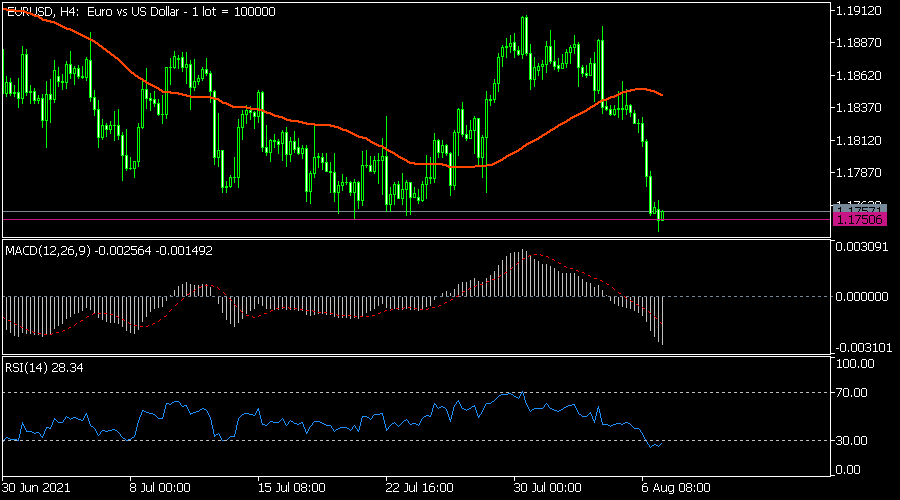
The EURUSD pair declined to 1.1750, which was the lowest level since late July. On the four-hour chart, the pair moved below the 25-day moving average while the MACD moved below the neutral line. The RSI has moved to the oversold. The volume also remained higher. Therefore, the pair may keep falling now that it has moved below the key support at 1.1750. The next level to watch will be 1.1700.
USDCHF
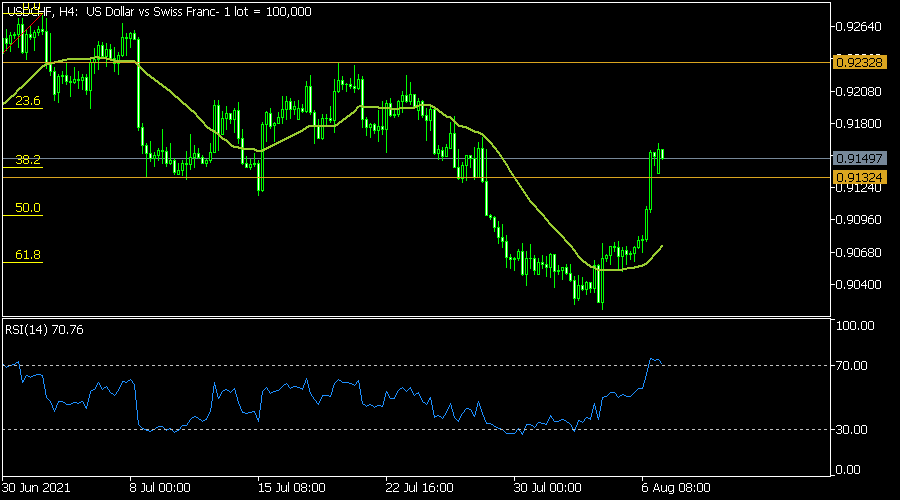
The USDCHF pair rose to 0.9150 after the US jobs numbers. This was the highest level since July 30. On the 4 hour chart, the pair managed to move above the key resistance at 0.9132, which was the neckline of the double-bottom pattern. It also rose above the 25-day and 50-day moving averages while the RSI has moved above the overbought level. Therefore, the pair will likely keep rising ahead of the Swiss unemployment data.
US30
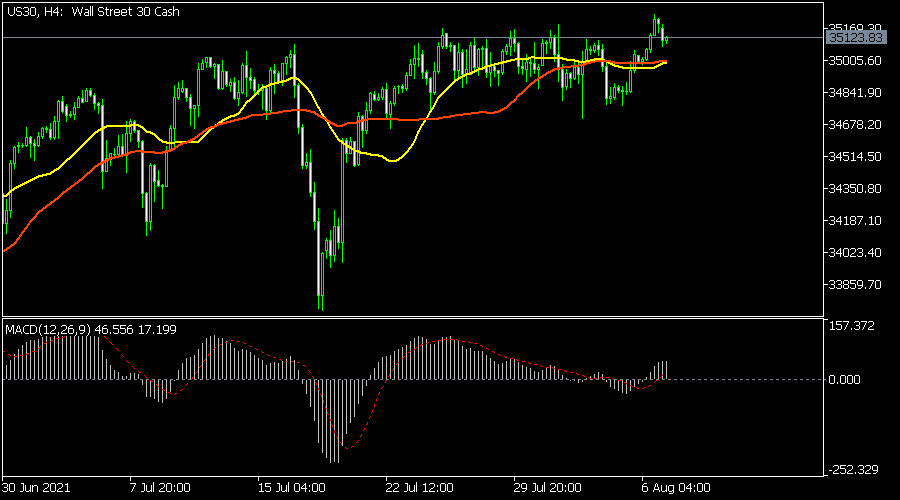
The Dow Jones futures retreated to $35,100, which was lower than its all-time high of $35,230. On the 4 hour chart, the price was slightly above the 25-day and 50-day moving averages while the neutral and signal lines of the MACD moved above the neutral level. The index will likely rebound as traders target the resistance at $35,500.
GBP/JPY Daily Outlook
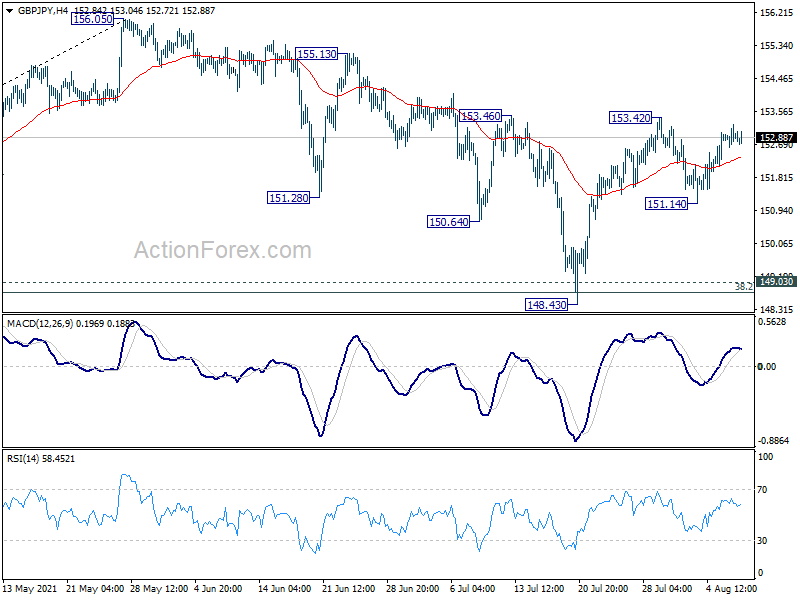
Daily Pivots: (S1) 152.64; (P) 152.95; (R1) 153.23; More...
Intraday bias in GBP/JPY remains neutral for the moment. On the upside, break of 153.42/46 resistance will reaffirm the case that correction from 156.05 has completed at 148.43. Intraday bias will be back on the upside for retesting 156.05. On the downside, though, below 151.14 will bring deeper fall back to retest 148.43.
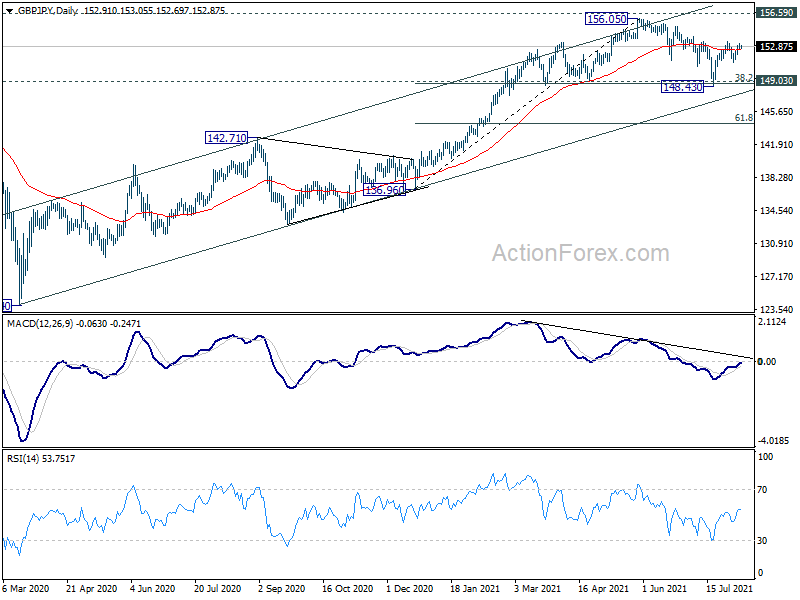
In the bigger picture, rise from 123.94 is seen as the third leg of the pattern from 122.75 (2016 low). Focus remains on 156.59 resistance (2018 high). Sustained break there should confirm long term bullish trend reversal. Next target is 61.8% retracement of 195.86 (2015 high) to 122.75 at 167.93. On the downside, sustained break of 149.03 support, however, will argue that rise from 123.94 has completed. Further break of 142.71 would open up the bearish case for retesting 122.75 low.
EUR/USD Likely To Maintain Channel
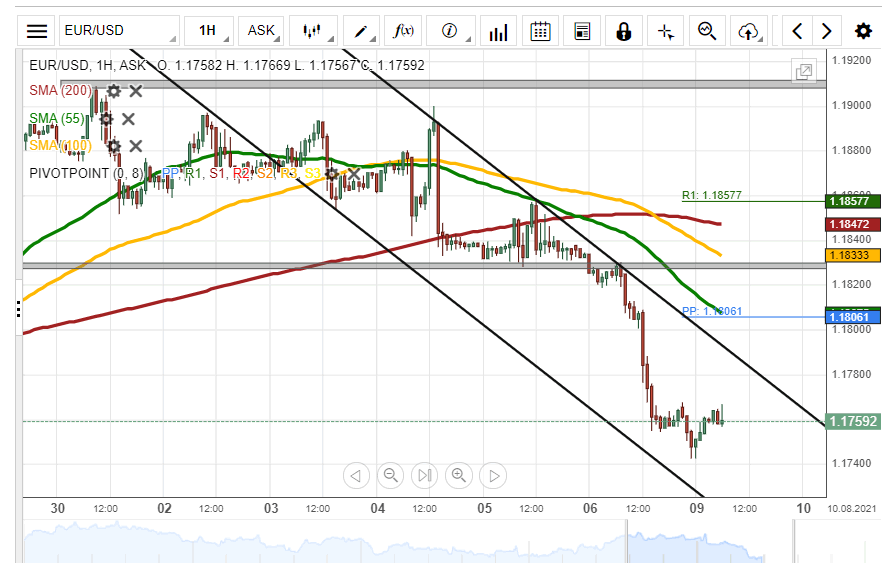
On Friday, the common European currency fell by 72 pips or 0.61% against the US Dollar. The currency pair was pressured lower by the 55– hour simple moving average during Friday's trading session.
Everything being equal, the exchange rate is likely to continue to trend lower in a descending channel pattern during the following trading session. The potential target for sellers will be near the weekly S1 at 1.1712.
However, the lower boundary of the channel pattern at 1.1740 could provide support for the EUR/USD currency exchange rate in the shorter term.
EUR/JPY Daily Outlook
Daily Pivots: (S1) 129.49; (P) 129.73; (R1) 129.87; More....
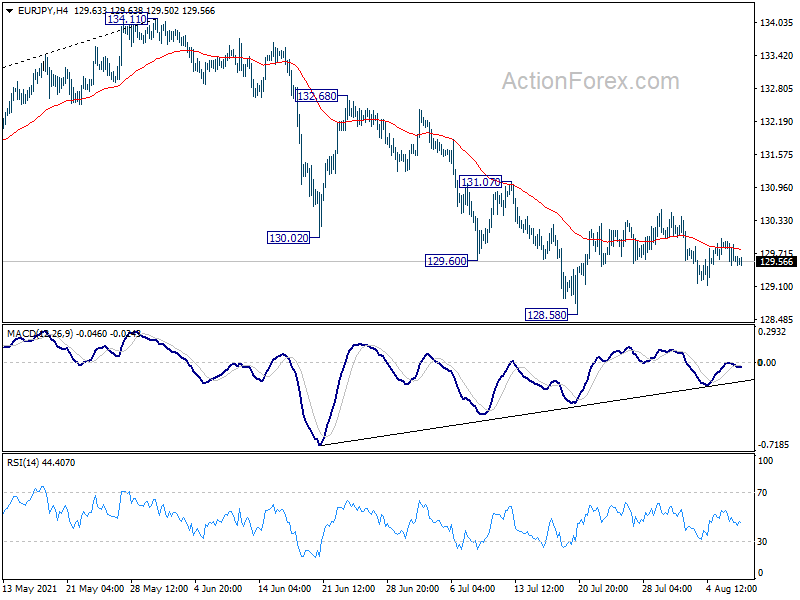
Intraday bias in EUR/JPY remains neutral as consolidation from 128.58 is extending. Outlook stays stays bearish with 131.07 resistance intact. On the downside, break of 128.85 will resume the fall from 134.11 to 127.07 resistance turned support next. On the upside, break of 131.07 resistance will argue that choppy fall from 134.11 has completed. Intraday bias will be turned back to the upside for 132.68 resistance first.
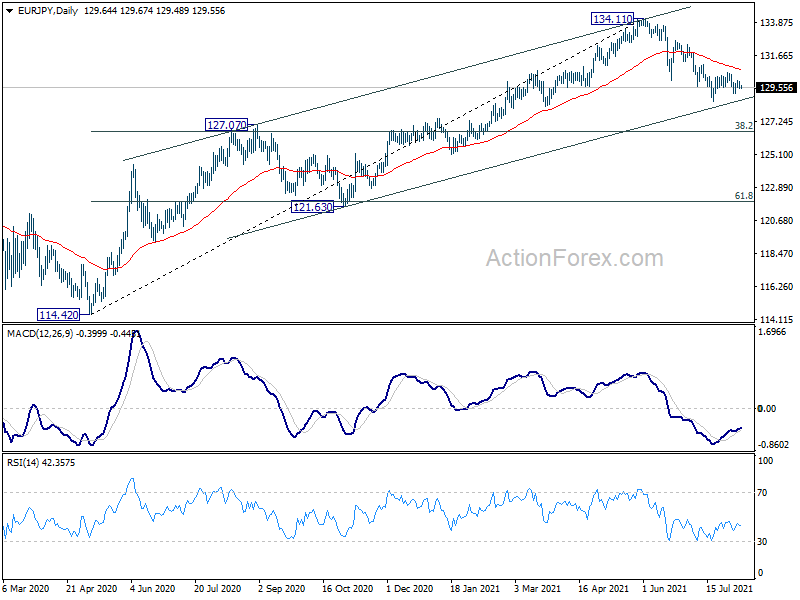
In the bigger picture, rise from 114.42 is seen as a medium term rising leg inside a long term sideway pattern. As long as 127.07 resistance turned support holds, further rise is still expected to retest 137.49 (2018 high). However, firm break of 127.07 will argue that the medium term trend has reversed, and open up the case for retesting 114.42.
GBP/USD Breaks Support At 1.3880
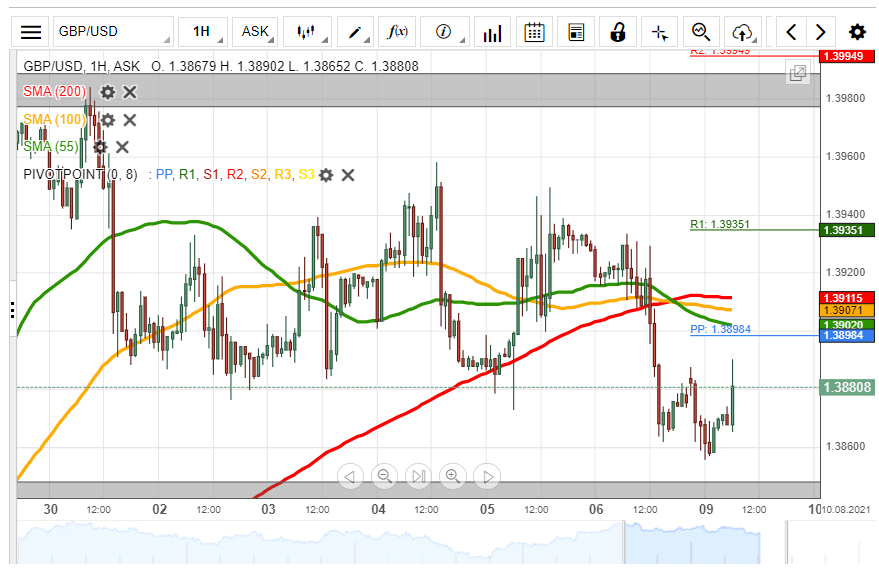
On Friday, the British Pound declined by 63 pips or 0.45% against the US Dollar. The currency pair breached the 55-, 100– and 200– hour SMAs during Friday's trading session.
All things being equal, the exchange rate could continue to edge lower during the following trading session. The possible target for the GBP/JPY pair will be near the 1.3810 area.
However, the weekly support level at 1.3838 could provide support for the currency exchange rate within this session.
USD/JPY Bulls Likely To Prevail
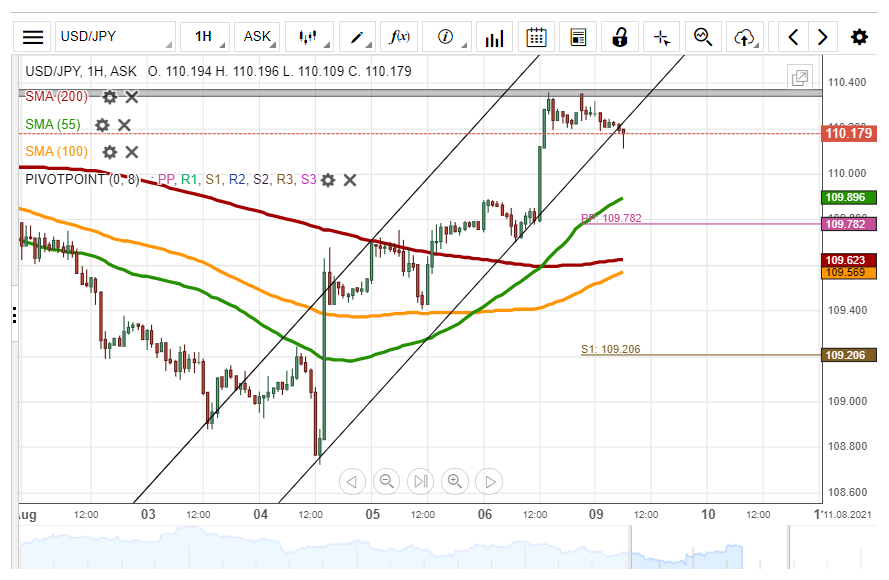
On Friday, the US Dollar edged higher by 63 pips or 0.58% against the Japanese Yen. The USD/JPY currency pair tested the 110.40 level during Friday's trading session.
Buyers are likely to drive the price of the exchange rate higher during the following trading session. The potential target for bulls will be near the weekly resistance level at 110.84.
However, the currency exchange rate could find resistance at 110.40 within this session.