Sample Category Title
EUR/USD Targets Fresh Lows, Dollar Recovers
Key Highlights
- EUR/USD failed to surpass 1.1900 and declined heavily.
- It broke a major bullish trend line at 1.1800 on the 4-hours chart.
- GBP/USD also declined below the 1.3900 support zone.
- The US nonfarm payrolls increased 943K in July 2021, up from the last 938K (revised from 850K).
EUR/USD Technical Analysis
The Euro started a major decline after it failed to surpass 1.1900 against the US Dollar. EUR/USD traded below the key 1.1850 support to move into a bearish zone.
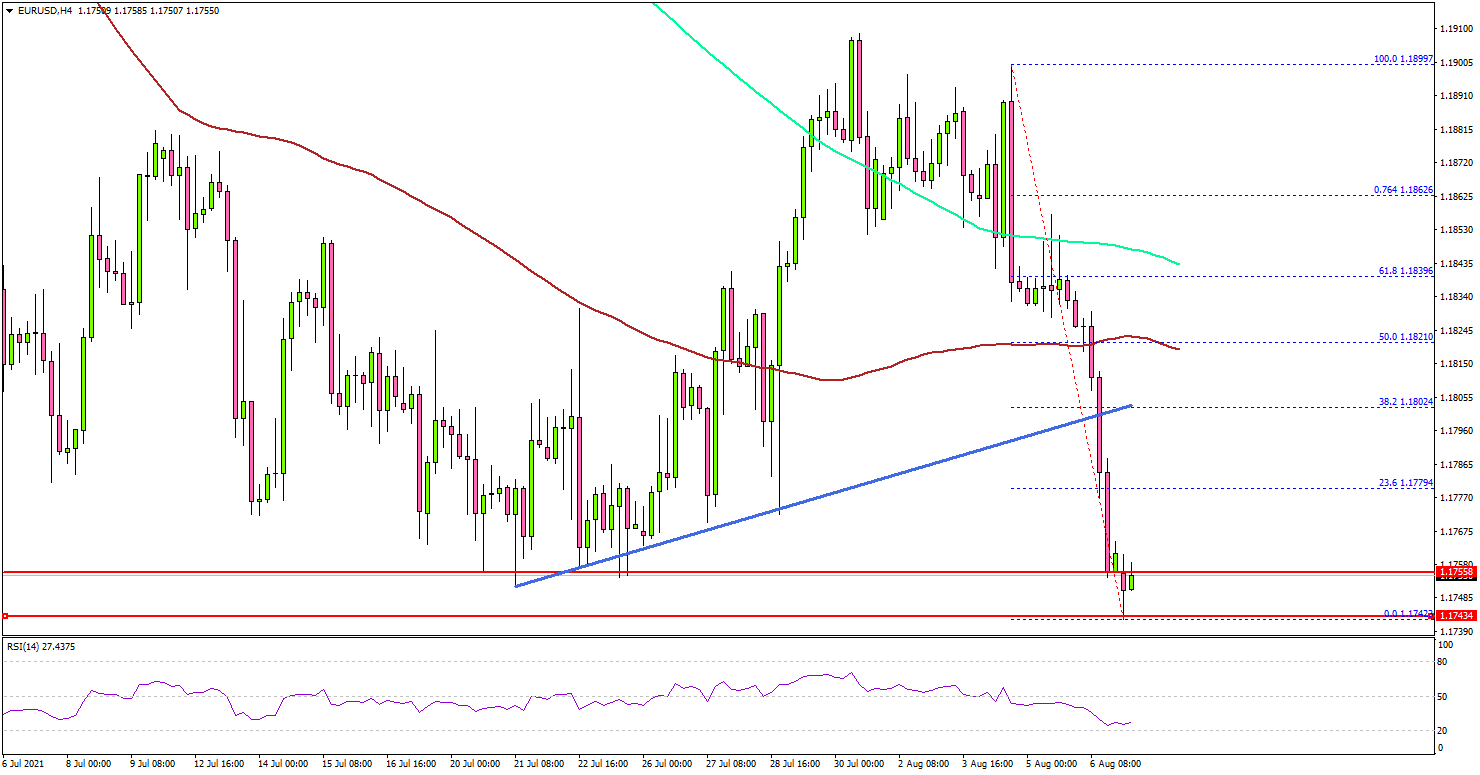
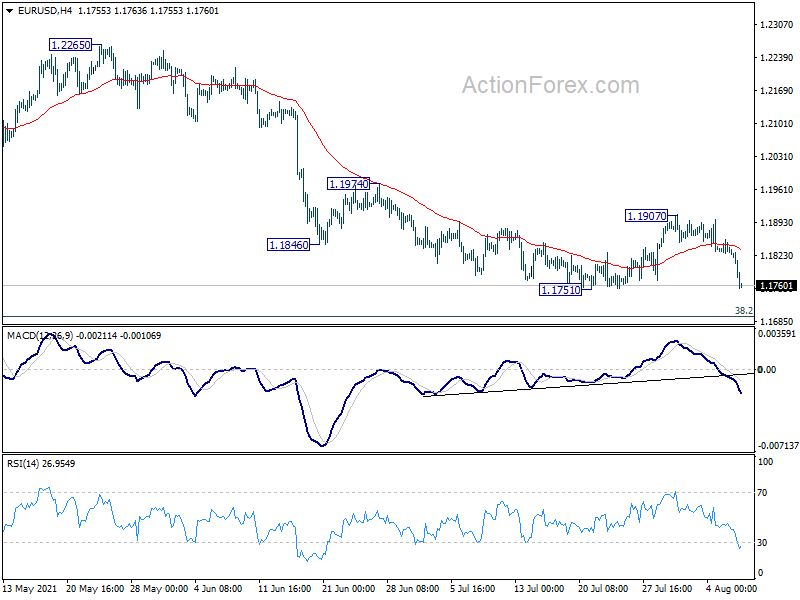
Looking at the 4-hours chart, the pair traded below the 1.1820 support zone. There was also a break below a major bullish trend line at 1.1800. The pair settled below the 1.1800 level, the 100 simple moving average (red, 4-hours), and the 200 simple moving average (green, 4-hours).
Finally, the pair traded below the 1.1755 support zone. A low is formed near 1.1742 and the pair is now consolidating losses.
If there is a downside break below 1.1740, the pair could accelerate lower towards 1.1700. The next major support on the downside is near the 1.1650 level.
On the upside, the first major resistance is near the 1.1800 level. The main resistance is now forming near the 1.1820 level and the 100 simple moving average (red, 4-hours). It is also near the 50% Fib retracement level of the recent decline from the 1.1899 swing high to 1.1742 low.
Looking at GBP/USD, the pair failed to surpass the 1.4000 resistance and it started a fresh decline below 1.3900. Besides, USD/JPY gained pace above the 110.00 resistance zone.
Economic Releases
- Germany’s Trade Balance for June 2021 - Forecast €13.5B, versus €12.6B previous.
- Euro Zone Sentix Investor Confidence for August 2021 - Forecast 29, versus 29.8 previous.
Market Morning Briefing: Aussie Seems To Have Paused Above 0.7290
STOCKS
Dow has risen but has to rise past 35250 from here to strengthen the bullish case of seeing 36000 on the upside. DAX is at the upper end of its 15200-15800 range and needs to see if it is breaking the range of the upside or is going to fall-back and retain the range for some more time. Shanghai is consolidating in a narrow range and looks mixed in the near-term. Nikkei is closed today. Sensex and Nifty have declined on Friday but have strong supports that can limit the downside and keep the broader bullish view intact..
Dow (35208.51, +144.26, +0.41%) has risen and closed just below 35250. We will have to wait and see if the much awaited break above 35250 and the rise to 36000 can happen now. As mentioned on Friday, in case if 35250 continues to hold and the Dow dips below 35000 decisively, the chances of falling to 34250-34000 will come back into the picture again and the broader 33000-35250 range will continue to remain intact.
DAX (15761.45, +16.78, +0.11%) tested 15800 – the upper end of its 15200-15800 range and has come-off slightly. We retain our bullish view of seeing an upside breakout above 15800 and a rise to 16000-16200 in the coming weeks. Failure to rise past 15800 can drag the index lower and keep it inside the 15200-15800 range for some more time.
Nikkei (27820.04) is closed today.
Shanghai (3468.47, +10.25, +0.30%) oscillates between 3440 and 3480 over the last few days. A breakout on either side of this narrow range will decide whether the index can go up to 3500-3550 or fall back 3400-3350 again. From a bigger picture Shanghai will have to rise past 3550 to bring back the bullishness and also to completely negate the chances of seeing 3200 on the downside.
Sensex (54277.72, −215.12, -0.39%) fell on Friday but is likely to get support in the 53500-53000 region in case the fall continues this week. While above 53000, the broader bullish view remains intact to see 56000 on the upside.
Nifty (16238.20, −56.40, -0.35%) seems to be struggling to get a strong follow-through rise above 16300. Immediate support is at 16150 and then slightly deeper ones are at 15900 and 15800. The outlook remains bullish while above 15800 to see a strong break above 16300 and a rise to 16500-16600 in the coming days.
COMMODITIES
Massive sell off seen in Gold and silver that has dragged down crude prices as well. We need to see if they manage to sustain above respective crucial supports else would be vulnerable to further bearishness in the coming sessions. Gold is bearish while below 1750, Silver is bearish while below 24.50, Brent and WTI are bearish on a break below 69 and 66/65 respectively. Co bounce from there could keep the long term uptrend intact else it could come into a bearish zone as well. Watch price action near 4.20 in the near term.
Brent (69.30) has important support at 69 which needs to hold in order for it to bounce back to 70-73. Any break below 69 would make it bearish towards 68/67-65 levels. WTI (66.81) has support at 65 which is important. Any break below that would make it bearish towards 60.
Gold (1739.70) has seen a massive selling that has taken the price down sharply below our expected support level of 1750. Gold has tested a low of 1680 before bouncing back and while above 1700, it could has some scope to bounce back but while below 1750 overall view is biased to the downside. We would keep a close watch to see if the bounce is short lived or will it continue to fall from here in the near term.
Silver (23.95) has also fallen sharply breaking below out expected support at 24.50. Note that 23 is now an important support which is needed to hold to push back Silver towards 24+ levels in the medium term. Any break below 23, if seen and sustained would indicate a fresh fall.
Copper (4.3280) has not fallen as much as that seen in Gold and Silver. But we would be cautious to see if support at 4.20 holds and produces a bounce back to higher levels. Any break below 4.20, could make Copper vulnerable to a sharp fall in the medium term.
FOREX
Dollar Index has risen and could test 93.0-93.30 before coming off while Euro can fall to 1.17. Dollar Yen has risen well in line with a rise in the Dollar Index and could test 110.30/50 before coming back from there. Aussie can rise to 0.74-0.75 while Pound could be ranged within 1.40-1.37 in the near term. USDCNY can head towards 6.46/45 while USDINR can fall towards 74-73.80 too.
Dollar Index (92.79) has risen again to head towards 93 as support near 91.75 is holding well for now. Watch price action near 93-93.30 to see if it breaks higher to indicate bullishness or continues to remain within the range of 93.30-91.75.
Euro (1.1759) has dipped sharply and if it falls below 1.1750 and sustains, it could be vulnerable to test 1.17-1.16 soon. Watch price action near current levels.
EURJPY (129.61) can fall to test 128.70 before again rising from there. Failure to sustain above 128.70 can take it down to deeper support at 128.
Dollar-Yen (110.20) has risen to test 110.30-110.50 from where a decline is possible. Watch price action at 110.50 over the next few sessions.
Aussie (0.7354) seems to have paused above 0.7290 and while it trades above 0.7290, there is scope for a rise to 0.74-0.75 in the medium term.
Pound (1.3868) is stuck within 1.40-1.37 and needs to break on either side and sustain to give clarity on further direction from here. Immediate view is bearish for a fall to 1.37.
USDCNY (6.4758) has declined from 6.4850 and can fall towards 6.46/45 in the near term.
USDINR (74.1550) has scope to fall down towards 74.0-73.80 before bouncing back from there. View is bearish while below 74.40/25.
INTEREST RATES
The US Treasury yields have surged following the strong US Non-Farm Payroll and the Unemployment data release on Friday. The expected corrective rally is happening now and there is room to move up further from here before resuming the overall downtrend. German Yields have also bounced-back from their supports as expected. A corrective rise is possible in the coming days and then the broader downtrend can resume. The 5Yr GoI spiked on Friday after the Reserve Bank of India’s policy meeting. Immediate resistance is there and while that holds, the yield can come down again this week.
The US 2Yr (0.21%), 5Yr (0.77%), 10Yr (1.30%) and the 30Yr (1.95%) Treasury yields have risen sharply on Friday. The expected corrective rally has begun in line with our expectation. A further rise from here can take the 10Yr up to 1.40%-1.45%. The 30Yr can extend the rally to 2.1%-2.15% on a break above 2% from here.
The German 2Yr (-0.77%), 5Yr (-0.73%), 10Yr (-0.46%) and 30Yr (-0.01%) yields have bounced-back across tenors as expected. The supports at -0.45% on the 10Yr and -0.05% on the 30Yr has held well in line with our expectation. A further rise from here will clear the way for the corrective rally to -0.30%/-0.25% (10Yr) and 0.10% (30Yr) that we had been mentioning. Thereafter a fresh leg of fall can happen in order to keep the broader downtrend intact.
The Indian 5Yr GoI (5.7661%) spiked to 5.8132% on Friday after the RBI meeting and has come-off from there. Resistance is at 5.78% which has to be broken decisively in order to move up further. While below 5.78%, the yield can fall back to 5.7% in the coming days.
China PPI rose to 9.0% yoy in Jul, CPI slowed to 1.0% yoy
China's PPI accelerated to 9.0% yoy in July, up from 8.8% yoy, above expectation of 8.8% yoy. "The price increase of industrial products expanded slightly in July as prices of crude oil, coal and related products rose sharply," said senior NBS economist Dong Lijuan.
CPI slowed to 1.0% yoy, down from 1.1% yoy, above expectation of 0.8% yoy. Core CPI, excluding food and energy prices, rose 1.3% yoy. Pork prices dropped -43.5% yoy, dragging down food prices down -3.7%. Non-food prices, on the other hand, rose 2.1% yoy.
Bundesbank Weidmann: I do not rule out higher inflation rates
Bundesbank President Jens Weidmann told the Welt am Sonntag newspaper, "I do not rule out higher inflation rates." He added, "In any case, I will insist on keeping a close eye on the risk of an excessively high inflation rate and not only on the risk of an excessively low inflation rate."
He also said that the emergency asset purchase program, known as PEPP, must end when the Covid-19 crisis is over. "The first P stands for pandemic and not for permanent. It's a question of credibility," he added.
On the plan of stimulus exit, "the sequence would then be: first we end the PEPP, then the APP is scaled back, and then we can raise interest rates," he said.
Eco Data 8/9/21
[php_everywhere instance="1"]
Forex Cryptocurrencies Forecast
EUR/USD: it's All About the Labor Market
The EUR/USD pair drew another wave of sine waves on the chart: it fell by the same amount in the first week of August as it rose in the last week of July.
Statistics from the US labor market set the tone for the week's trends. In anticipation, the pair was moving in the sideways range of 1.1850-1.1900 throughout the first half of the week. The bears tried to break through its lower border on Wednesday, August 04. However, amid disappointing private sector employment statistics from the ADP, the pair reversed and, conversely, aimed at a breakout of the channel's upper border. But this attempt, now by the bulls, failed. The reason was the record growth of business activity in the US services sector from ISM: it rose to 64.1 in July.
After pulling back to support 1.1830, the pair froze in anticipation of the release of non-farm payrolls (NFP), data on the number of new jobs created outside the US agricultural sector. This data is traditionally published every first Friday of the month. And the report released on August 6 did not disappoint investors. Moreover, some analysts called it "stellar" as it showed employment growth of 943 thousand against the forecast of 870 thousand. In addition, the unemployment rate fell from 5.9% to 5.4%.
The market responded immediately with a surge in the US currency, as according to Fed statements, the timing of the monetary stimulus program (QE) and interest rate hikes are directly dependent from a crackdown on inflation and a full-fledged recovery in the US labor market.
After the release of the report, the yield on 10-year US bonds went up in the direction of 1.30%, which supported the rally in the dollar. The DXY rose 0.60% to 92.80, while EUR/USD plunged to 1.1755. The last chord of the week sounded very close, at the level of 1.1760.
Impressive labor market data allowed President Joe Biden to say his approach to economics is working. True, the White House host urged not to relax and stated that there was still a lot of hard work to do. Moreover, the country has to extinguish a new wave of coronavirus associated with the Delta strain. The president believes that the number of new cases of Covid will initially rise, but then decline, thanks to the current scale of vaccinations. And therefore, the US economy will not suffer as much damage as it did before.
Biden's words also went into the piggy bank of those waiting for the Fed's policy tightening soon. For example, analysts at Canadian investment bank TD Securities forecast that the dollar will perform better against currencies whose national central banks retain a dovish mood.
The overall picture for the pair looks bearish, something 70% of experts agree on. They believe that the EUR/USD pair intends to test the end-March low of 1.1700 once again. If it succeeds, it will encounter a strong support in the 1.1600-1.1610 zone. This forecast is supported by 100% of trend indicators on both H4 and D1. But the oscillators note the weakening of the bearish onslaught. 10% of them have taken a neutral position on H4, and 15% are giving signals that the pair is oversold. There are even more of them on D1, 35%, which indicates a possible quick correction to the north. The remaining 30% of the experts are also expecting it. Moreover, in their opinion, the pair may not just limit itself to correction, but return first to the channel 1.1850-1.1900, and then rise to 1.2000. Although, of course, this is not a matter of the next few days.
As for the macro statistics for the coming week, here we can note the release of data on the consumer market in Germany and the United States on Wednesday, August 11. In addition, the University of Michigan Consumer Confidence Index will also be released at the end of the five-day period, on Friday, August 13. It is predicted that it may show a slight increase, which will slightly strengthen the US currency.
GBP/USD: Waiting for the Start of QE
The Bank of England held a meeting on Thursday August 05, which, as expected, offered no surprises. Even with the good pace of recovery from the pandemic and rising inflation, all basic monetary policy parameters remained unchanged. The regulator kept the interest rate at a historically low level of 0.1%, and the quantitative easing (QE) program at £895 billion.
The GBP/USD pair was never able to break the record of 30 July and was held in 1.3870-1.3935 for the whole week. An attempt made, in parallel with the euro, to break through its upper border on August 4, ended in nothing. As a result of the week's session, thanks to strong US statistics, the pair returned to the bottom of the channel, where it placed the final point at 1.3875.
The main interest for investors was not the predictable decision of the Bank of England, but the subsequent comments of its management regarding the future monetary policy. As mentioned above, the country's economy is confidently moving along the path of recovery. According to the data released earlier, inflation in June rose to 2.5%, exceeding the target level of 2%. The government is managing to cope with the next wave of COVID-19, so no new restrictions or lockdowns are yet to be seen. And although the Deputy Chairman of the Bank of England Benjamin Broadbent uttered a mysteriously ornate phrase that "moderate (!) tightening is likely (!), maybe (!) will be needed", it did not impress investors. Especially as Broadbent said inflation in the country will rise 4% in Q4 2021 and Q1 2022.
Therefore, according to 75% of experts, any signal about a possible transition from QE to a tighter policy, will be enough to lift the GBP/USD pair to 1.4000. 60% of oscillators agree with this position, but only 40% of trend indicators on D1. There is even greater discord in the readings of the indicators on H4. Graphical analysis on this timeframe first draws a fall of the pair to the 1.3800 horizon, and then a return to the highs of the end of July in the 1.3980 zone. It is clear that the support/resistance levels along the way will be the 1.3870-1.3935 channel boundaries.
As for the events of the coming week, we can single out the publication of preliminary data on UK GDP for tQ2 2021 on Thursday August 12. This figure is projected to show a very significant increase, from minus 1.6% to plus 4.8%. And if the forecast is met, it will give the pound strong support, thus becoming a signal to the possible start of the QE program cuts.
USD/JPY: North Following Treasury Yields
Starting on Wednesday August 04, the yen surrendered one frontier of defense after another, losing 150 points. The USD/JPY pair jumped from 108.71 to 110.21 in just three days. And, of course, it's all again to blame the same growing US labor market, pulling the yield of American treasuries. As mentioned above, this indicator approached 1.30%, which hit the Japanese currency hard.
Most experts (55%) expect the pair to return to support at 109.00. However, according to 45% of analysts, the pair has not yet exhausted its upside potential, especially if the yield on 10-year US Treasuries continues to rise. This forecast is actively supported by 100% of trend indicators on both timeframes, 65% of oscillators on H4 and 50% on D1. Graphical analysis on D1 predicts that the pair will finally be able to reach the coveted 112.00 level. The resistances on the way to this target are 110.65, 111.10 and 111.65.
CRYPTOCURRENCIES: Is Crypto Winter Canceled?
The digital currency market is optimistic. Investors hope that the crypto freeze has passed, and instead of a crypto winter, a crypto spring has immediately arrived. Indeed, over the past two weeks, a lot of green leaves have appeared on the "tree" of bitcoin quotes, of which there are much more than yellow-red dull autumn ones.
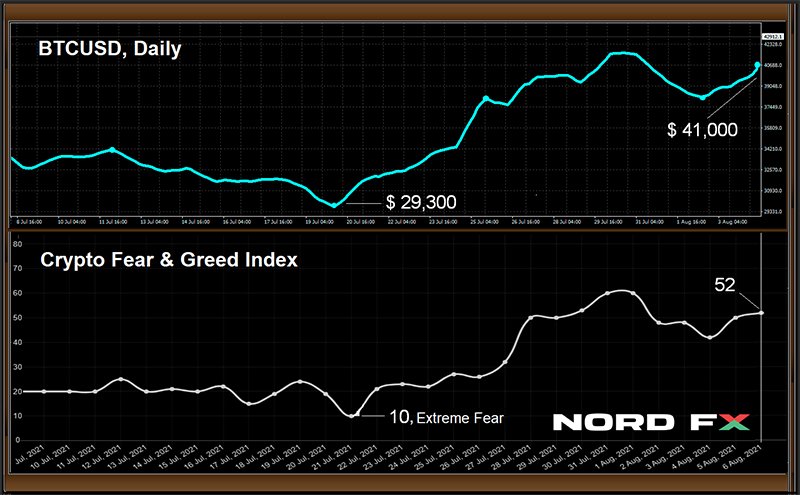
Bouncing off the low of $29,300 on July 20, the BTC/USD pair added about 40% and is trading in the $41,000-42,500 zone at the time of writing the forecast. The total capitalization of the crypto market grew by the same 40% over this period: from $1.19 trillion to $1.67 trillion. As for the Crypto Fear & Greed Index, it has finally moved from the Extreme Fear zone to the center of the scale, rising from 10 points to 52.
In addition to the quotes, major influencers statements and macro statistics support the market optimism. Recall that it was these factors that served as the main drivers of the bitcoin rally last fall.
For example, MicroStrategy chief Michael Saylor, said in an interview with Bloomberg TV that bitcoin has "the greatest growth potential and the lowest risk" and could therefore become "the property of the future" which will be possessed by everyone from small investors to big tech companies and governments. We see a future in which digital gold will become the basis of technological innovation in Apple, Amazon and Facebook and will take place on the balance sheets of corporations, cities, states and countries," the billionaire explained.
Analysts at one of the largest U.S. financial institutions, Bank of America, confirmed Saylor indirectly. They believe that the recognition of bitcoin as an official means of payment in El Salvador can give this country a number of serious advantages. This could potentially reduce the cost of remittances from abroad, which account for almost a quarter of El Salvador's GDP, and positively affect the incomes of the country's citizens. The analysts have called the democratization of financial services another advantage of the introduction of bitcoin, since approximately 70% of the adult population of the country does not have bank accounts. El Salvador can also attract direct foreign investment flows, becoming a major cryptocurrency mining center.
State Street, the second oldest bank in the United States with an investment portfolio of $3.1 trillion, plans to begin providing cryptocurrency related services. It is about helping private foundations to carry out transactions with digital assets and provide them with information on the optimal price levels for entering the crypto market.
But of course, things are not limited to State Street alone. Michael Miebach, CEO of payment giant Mastercard, said that cryptocurrencies must enter the banking sector on a large scale. Moreover, his company will do everything possible to become an integral part of the crypto space. "Mastercard is ready to become an assistant for the authorities in this task. We are ready for experiments and testing of digital currencies, so that in the end banks begin to work with them," said Miebach. And he added that Mastercard will allow 1 billion of its users to pay with digital assets in more than 30 countries around the world in 2021.
Recall that another payment giant, Visa, is already working on the integration of stablecoins into the global economy.
In terms of statistics, according to the research resource Glassnode, there was a sharp jump in the total number of active bitcoin addresses at the end of July. The increase in the indicator was about 30% in just a week. And the purses of "whales" accumulated 9.23 million BTC for the first time in history.
A further rise in prices is predicted by such an indicator as the ratio of put and call contracts in the bitcoin derivatives market. Low values of this indicator indicate that investors are supporting the rise in prices. And it fell to an 8-month low on August 01, that is, it is below the April value: the very one after which BTC surged above $60,000.
The likelihood index shows that there is a 30% chance that BTC will reach $46,000 in the near future. Moreover, according to the indicator, the overall probability that bitcoin will be worth between $50,000 and $55,000 is 28.3%.
The mood of analysts is even more elated. 60% of them vote for growth above $46,000. On the contrary, 20% are expecting a fall to the $30,000 area, and the remaining 20% vote for a sideways trend in the $35,000-42,000 range.
CFTC Commitments of Traders – Expect GBP Futures to Return to Net Long after Hawkish BOE
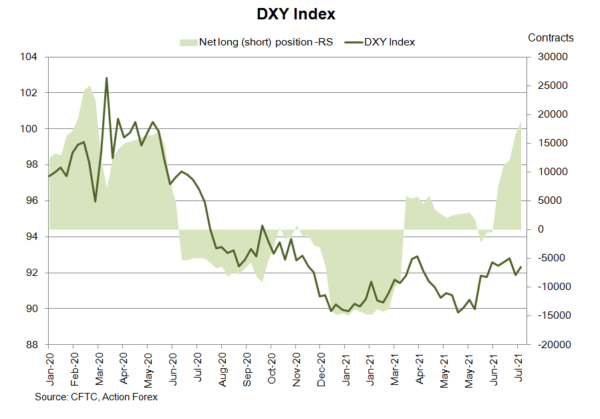
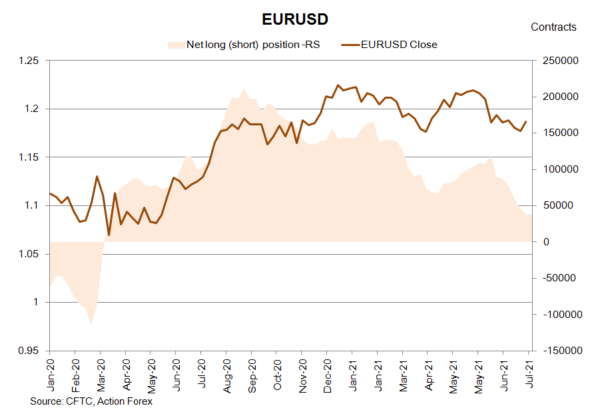
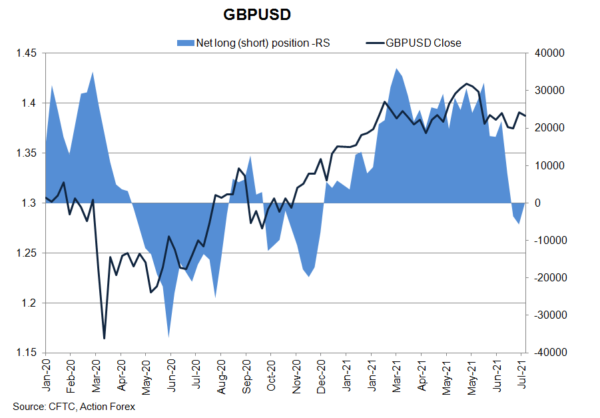
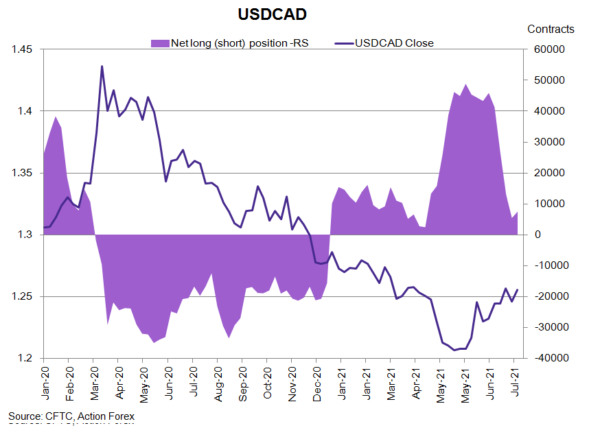
As suggested in the CFTC Commitments of Traders report in the week ended August 3, NET SHORT of USD index futures gained +2 340 contracts to 18 881. Speculative long positions added +1 703 contracts while shorts decreased -637 contracts. Concerning European currencies, NET LENGTH in EUR futures sank -119 contracts to 38 007. GBP futures' NET SHORT was trimmed sharply, by -5 598 contracts, to 86. It is possible that GBP futures would return to net length next week as sterling could recover after a more-hawkish-than-expected BOE.
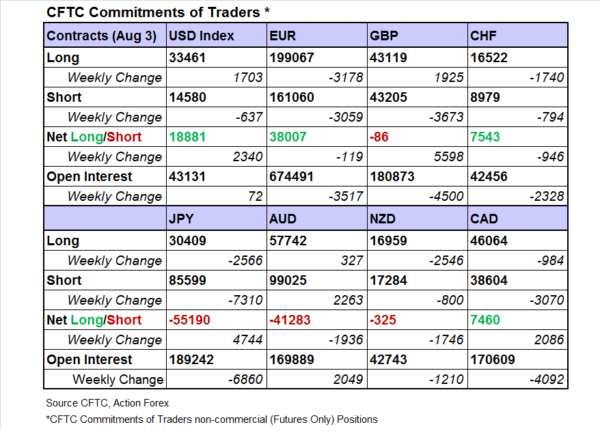
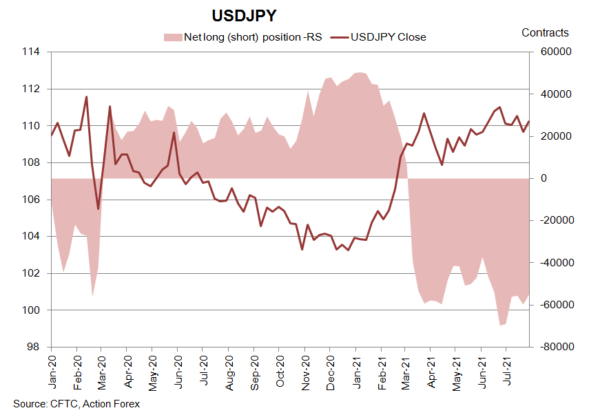
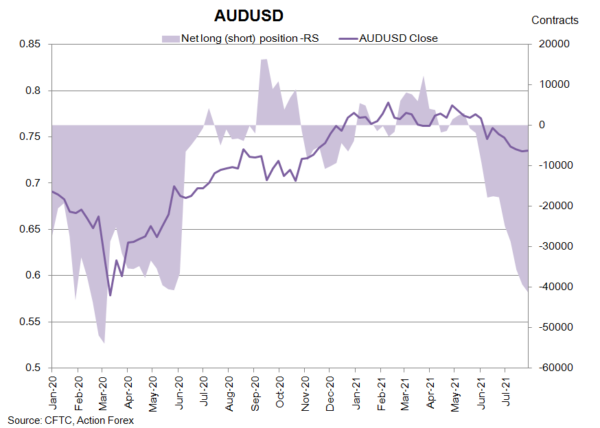
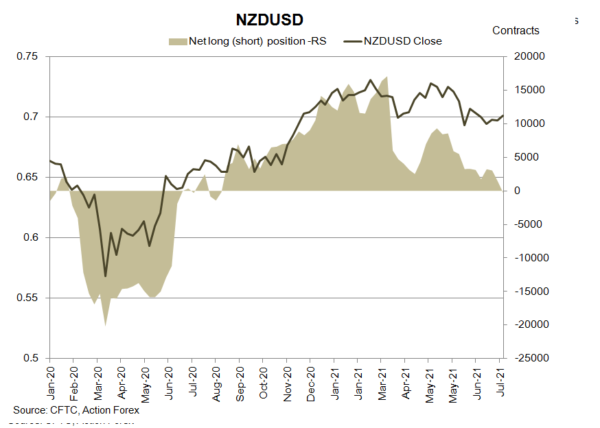
On safe-haven currencies, NET LENGTH of CHF futures dropped -946 contracts to 7 543 while NET SHORT of JPY futures fell -4 744 contracts to 55 190. Concerning commodity currencies, NET SHORT of AUD futures increased +1 936 contracts to 41 283 while NZD futures drifted to NET SHORT of 325 contracts during the week. NET LENGTH of CAD futures gained+2 086 contracts to 7 460 during the week.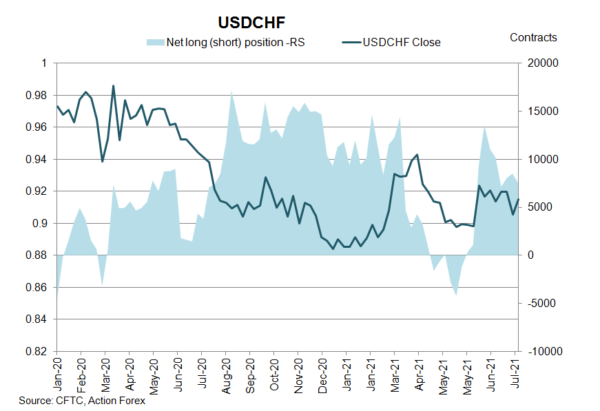
CFTC Commitments of Traders – Traders Sharply Trimmed Bets on Higher Crude Price
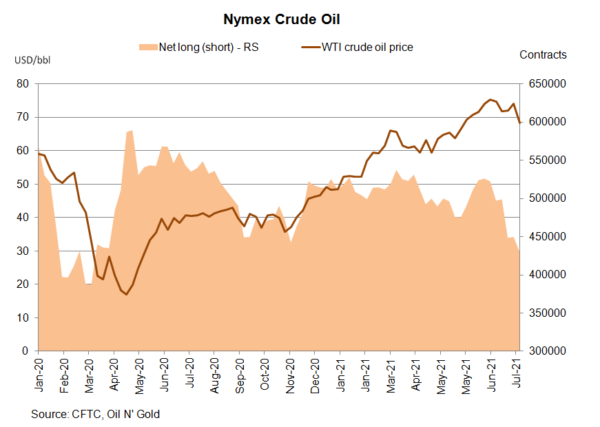
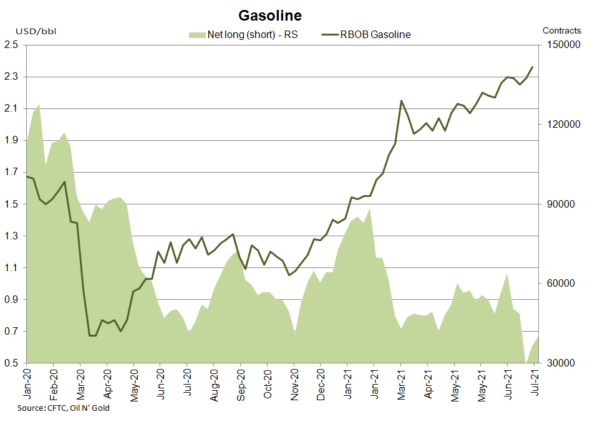
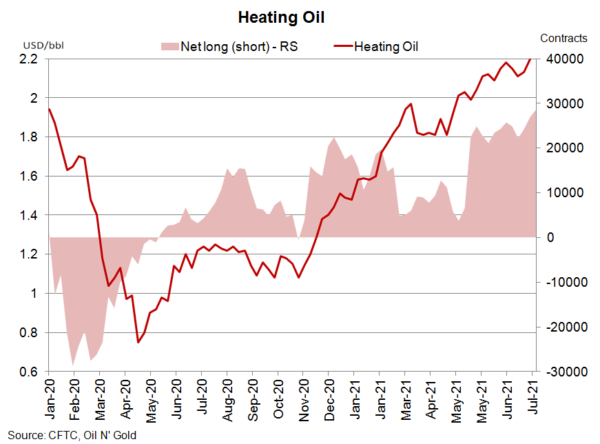
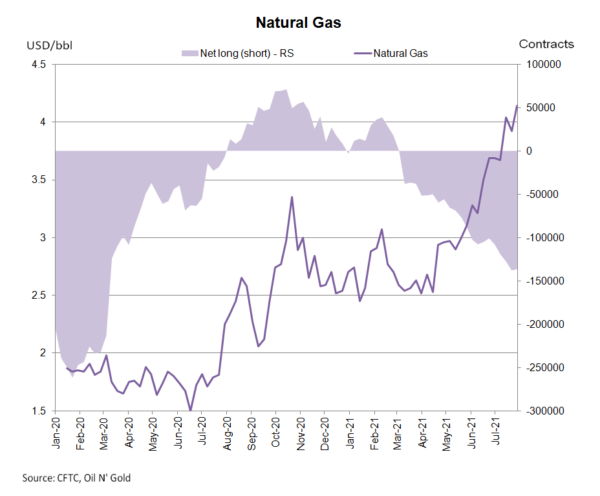
According to the CFTC Commitments of Traders report for the week ended August 3. NET LENGTH for crude oil futures sank -19 237 contracts to 430 527 for the week. Speculative long position declined -17 941 contracts, while shorts increased +1 296 contracts. Net length of WTI crude oil should fall further in the coming week. The benchmark contract plunged amidst concerns over resurgence of the pandemic in the US and China, the world's two largest oil consumers. For refined oil products, NET LENGTH for heating oil gained +1 645 contracts to 28 540, while that for gasoline rose +3 654 contracts to 40 005. NET SHORT of natural gas futures dropped -1 513 contracts to 136 245 during the week.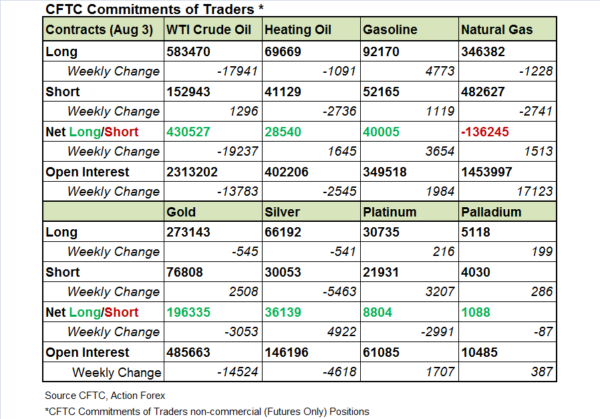
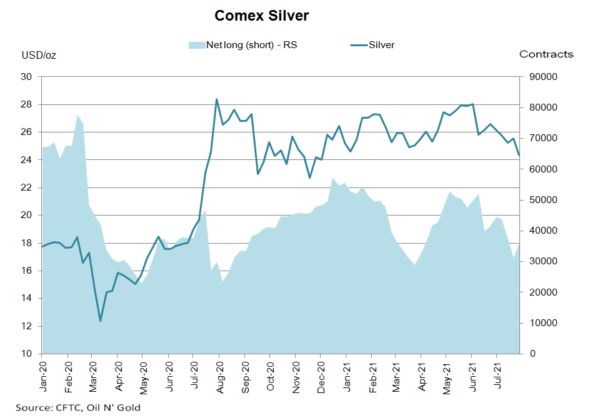
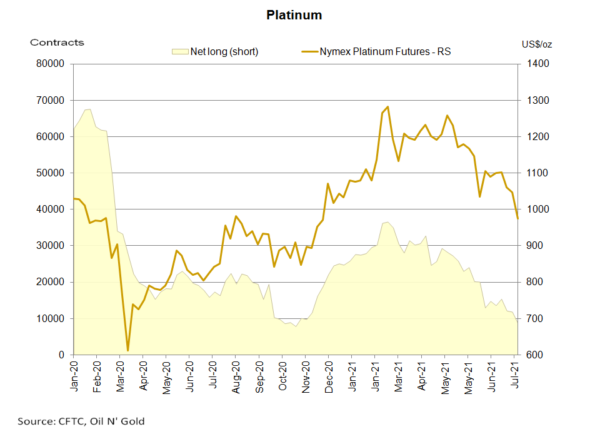
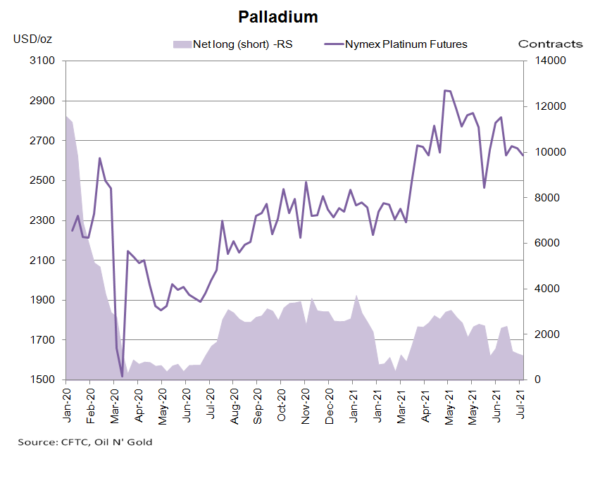
 Gold futures’ NET LENGTH dropped -3 053 contracts to 196 335 while silver futures’ NET LENGTH gained +4 922 contracts to 36 139. For PGMs, NET LENGTH of Nymex platinum futures dropped -2 991 contracts to 8 804 while that for palladium slipped -87 contracts to 1 088.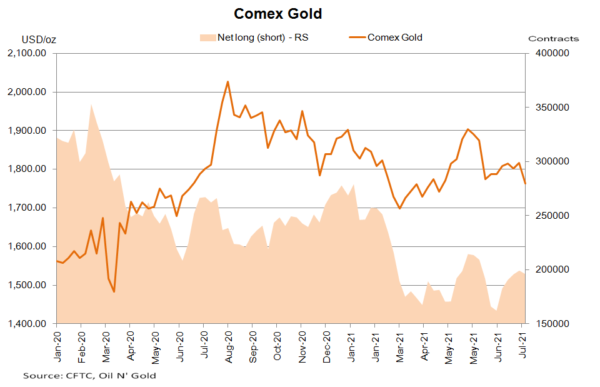
EUR/USD Weekly Outlook
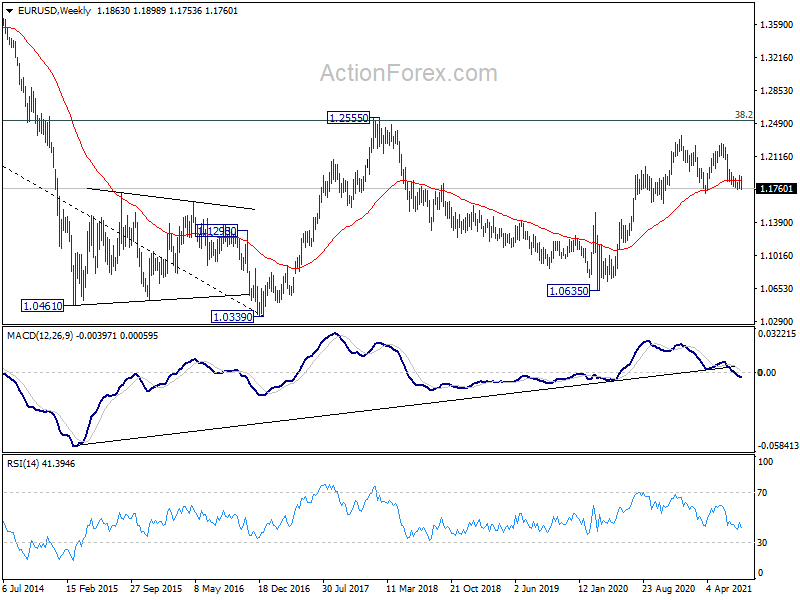
EUR/USD dropped sharply last week and the development suggest rejection by 55 day EMA. Immediate focus is now on 1.1751 support. Break will resume fall from 1.2265 to 1.1602/1703 support zone. We'd look for strong support from there to bring rebound. But break of 1.1907 resistance is needed to confirm short term bottoming. Meanwhile, sustained break of 1.1602 will argue that it's already reversing the trend from 1.1603, and target 61.8% retracement of 1.1603 to 1.2348 at 1.1888.
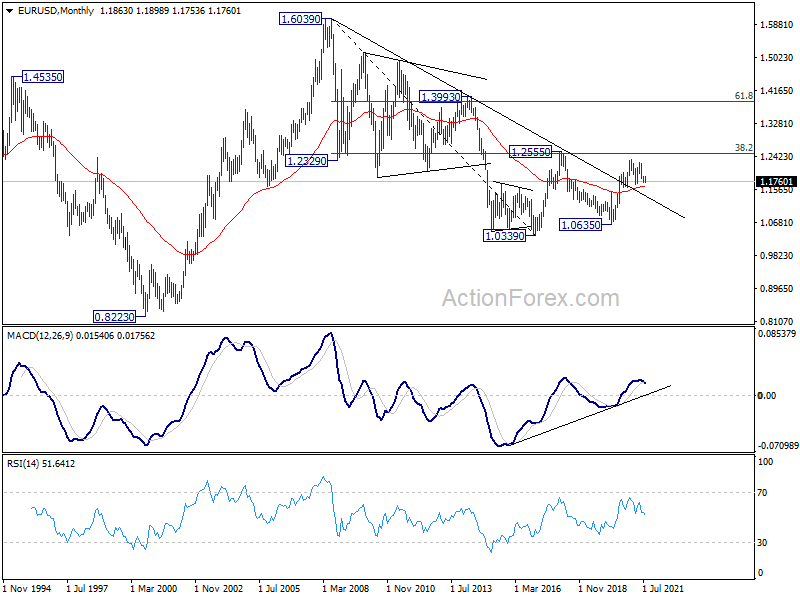
In the bigger picture, rise from 1.0635 is seen as the third leg of the pattern from 1.0339 (2017 low). Further rally could be seen to cluster resistance at 1.2555 next, (38.2% retracement of 1.6039 to 1.0339 at 1.2516). This will remain the favored case as long as 1.1602 support holds. Reaction from 1.2555 should reveal underlying long term momentum in the pair. However sustained break of 1.1602 will argue that the rise from 1.0635 is over, and turn medium term outlook bearish again.
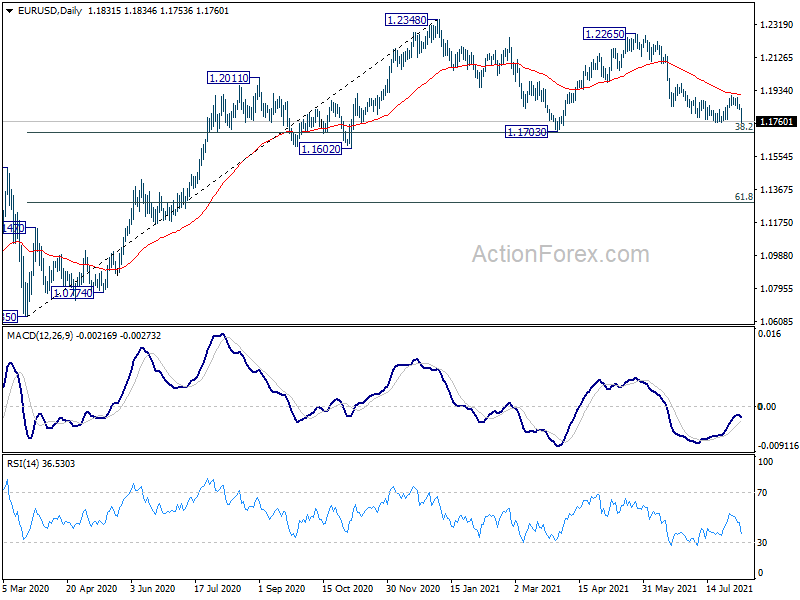
In the long term picture, focus remains on 1.2555 cluster resistance (38.2% retracement of 1.6039 to 1.0339 at 1.2516). Sustained break there should confirm long term bullish reversal and target 61.8% retracement at 1.3862 and above. However, rejection by 1.2555 will keep medium term outlook neutral first, and raise the prospect of down trend resumption at a later stage.
USD/JPY Weekly Outlook
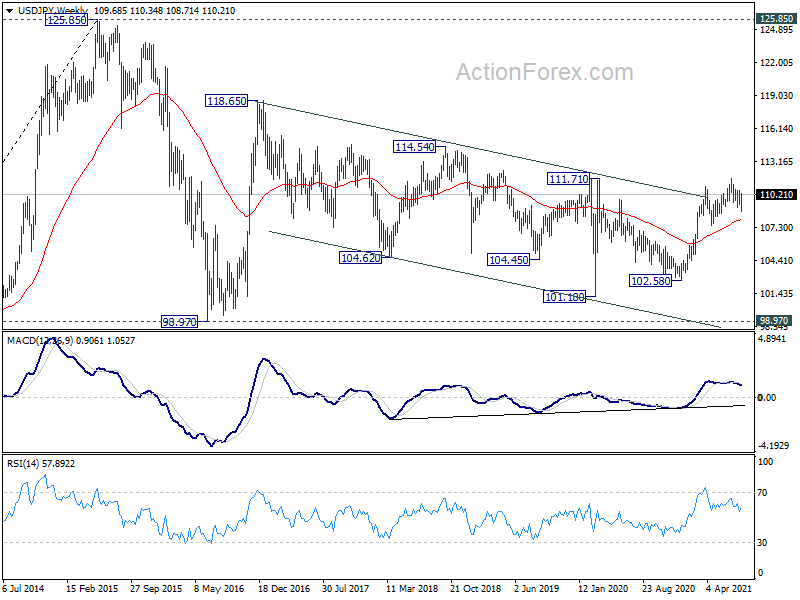
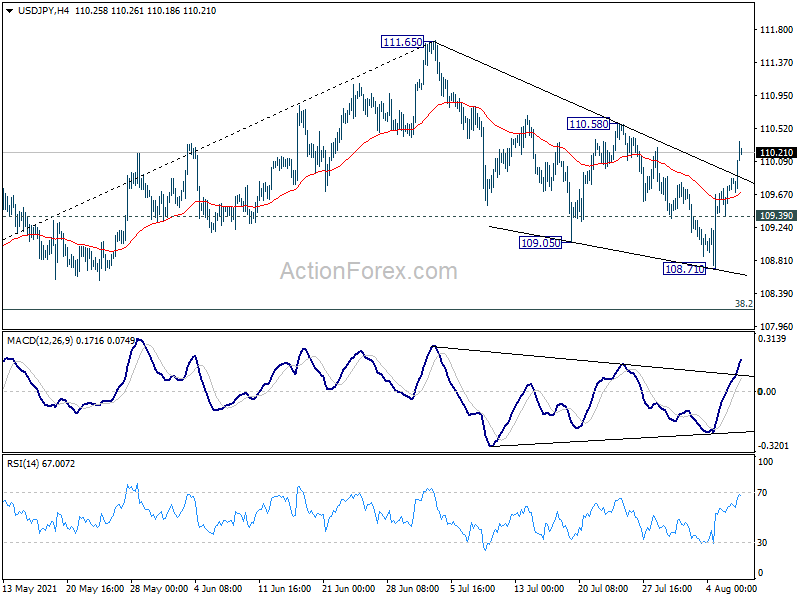
USD/JPY's strong rebound last week argues that corrective fall from 111.65 might have completed with three waves down to 108.71 already. Initial focus is now on 110.58 resistance first. Break will bring retest of 111.65 high. On the downside, though, below 109.39 minor support will bring retest of 108.71 support instead.
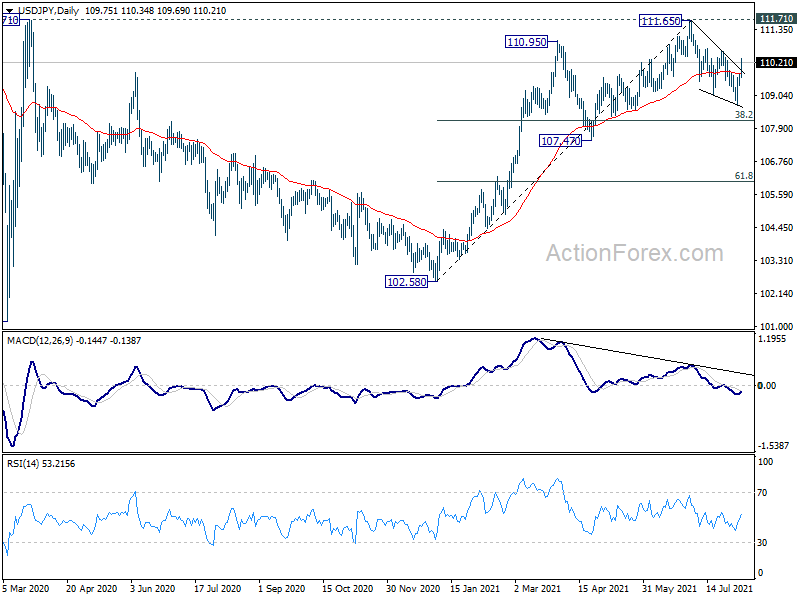
In the bigger picture, medium term outlook is staying neutral with 111.71 resistance intact. The pattern from 101.18 could still extend with another falling leg. Sustained trading below 55 day EMA will bring deeper fall to 107.47 support and below. For now, outlook won't turn bullish as long as 111.71 resistance holds, even in case of strong rebound.
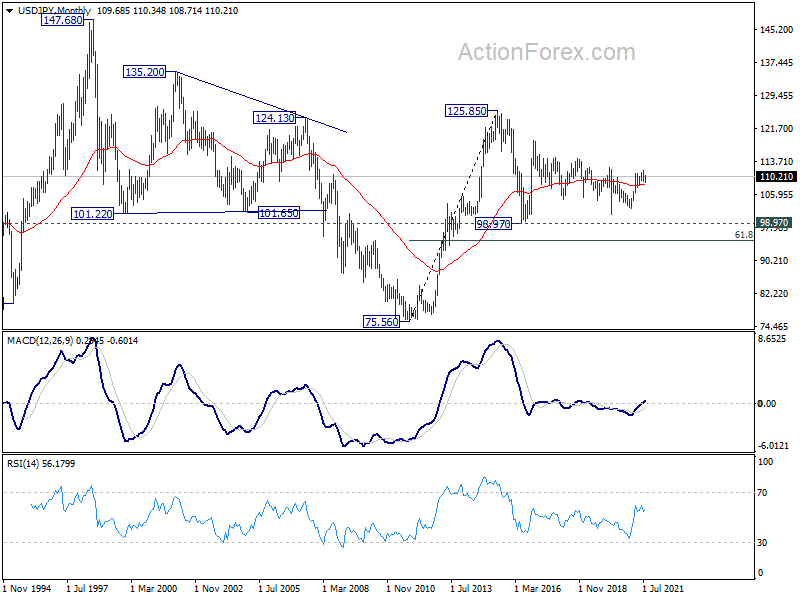
In the long term picture, the rise from 75.56 (2011 low) long term bottom to 125.85 (2015 high) is viewed as an impulsive move, no change in this view. Price actions from 125.85 are seen as a corrective pattern which could still extend. In case of deeper fall, downside should be contained by 61.8% retracement of 75.56 to 125.85 at 94.77. Up trend from 75.56 is expected to resume at a later stage for above 135.20/147.68 resistance zone.