Sample Category Title
USD/CHF Mid-Day Outlook
Daily Pivots: (S1) 0.9092; (P) 0.9124; (R1) 0.9183; More....
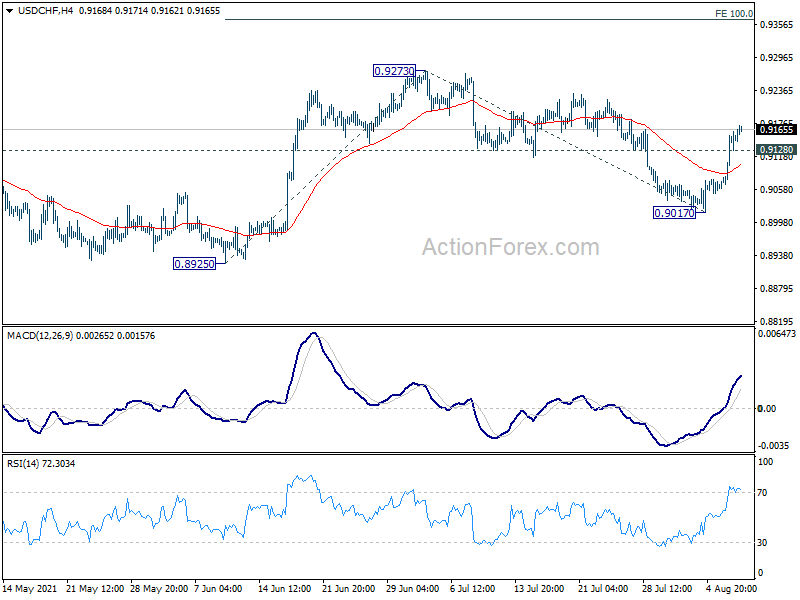
Intraday bias in USD/CHF stays mildly on the upside at this point. Corrective fall from 0.9273 should have completed with three waves down to 0.9017. Further rally would be seen to retest 0.9273 first. Break there will resume rise from 0.8925 to 100% projection of 0.8925 to 0.9273 from 0.9017 at 0.9365. On the downside, below 0.9128 minor support will mixed up the outlook and turn intraday bias neutral first.
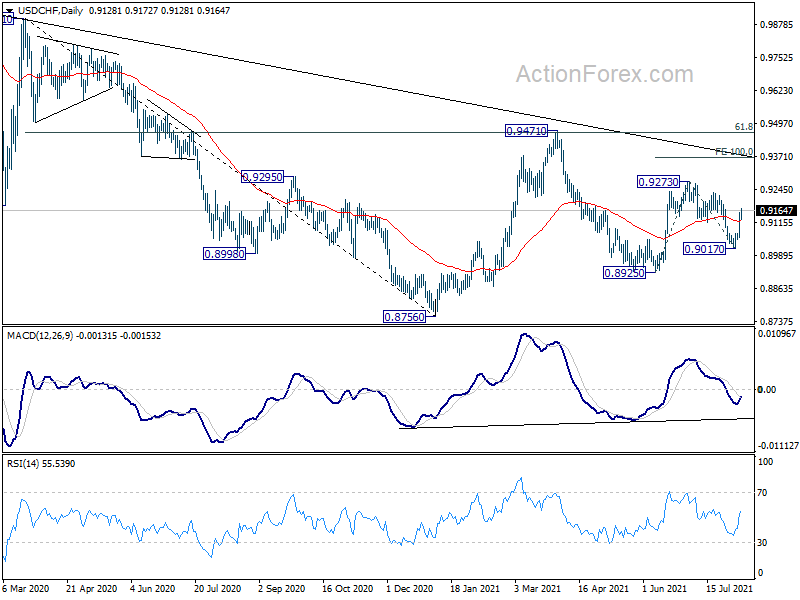
In the bigger picture, the failure to sustain above 55 week EMA (now at 0.9183) retains medium term bearish in USD/CHF. Break of 0.8925 support should resume the whole decline form 1.0342 (2016 high) through 0.8756 low. However, break of 0.9273 resistance and sustained trading above 55 week EMA will be an early sign of bullish trend reversal. Focus will then turn to 0.9471 resistance for confirmation.
GBP/USD Mid-Day Outlook
Daily Pivots: (S1) 1.3845; (P) 1.3890; (R1) 1.3919; More...
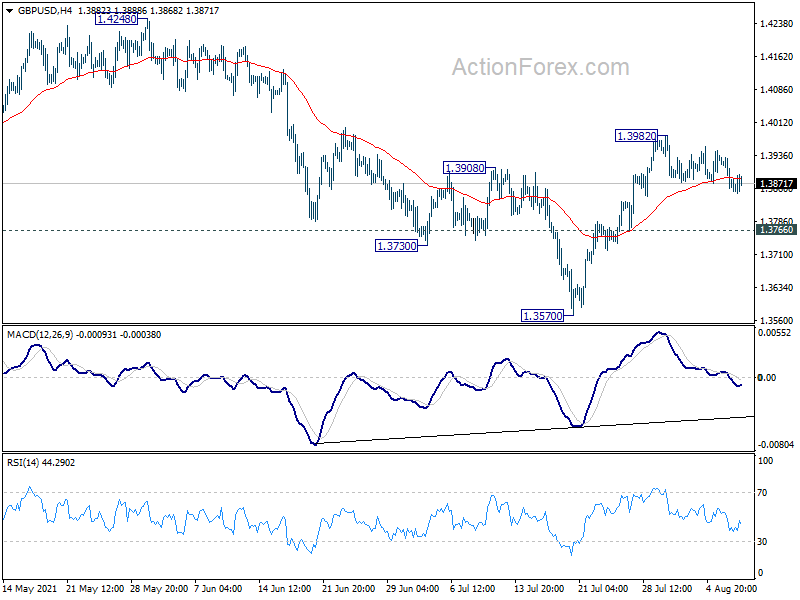
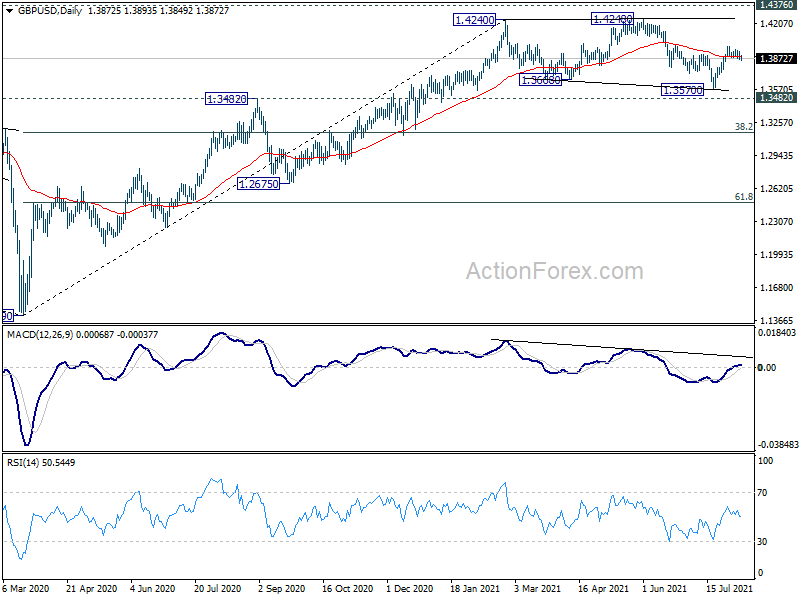
GBP/USD is staying in consolidation from 1.3982 and intraday bias remains neutral first. Outlook is unchanged that corrective pattern from 1.4240 could have completed with three waves down to 1.3570. On the upside, break of 1.3982 will resume the rise from 1.3570 to retest 1.4248 high. However, break of 1.3766 support will dampen this bullish view and bring retest of 1.3570.
In the bigger picture, as long as 1.3482 resistance turned support holds, up trend from 1.1409 should still continue. Decisive break of 1.4376 resistance will carry larger bullish implications. However, firm break of 1.3482 support will argue that the rise from 1.1409 has completed. GBP/USD would then be seen in another leg of long term range pattern between 1.1409 and 1.4376. Deeper fall could then be seen to 61.8% retracement of 1.1409 to 1.4248 at 1.2493, and even below.
EUR/USD Mid-Day Outlook
Daily Pivots: (S1) 1.1732; (P) 1.1784; (R1) 1.1814; More...
Intraday bias in EUR/USD remains on the downside at this point. Current fall from 1.2265 should target 1.1602/1703 support zone. We'd expect strong support from there to bring rebound. But break of 1.1907 resistance is needed to confirm short term bottoming. Meanwhile, sustained break of 1.1602 will argue that it's already reversing the trend from 1.1603, and target 61.8% retracement of 1.1603 to 1.2348 at 1.1888.
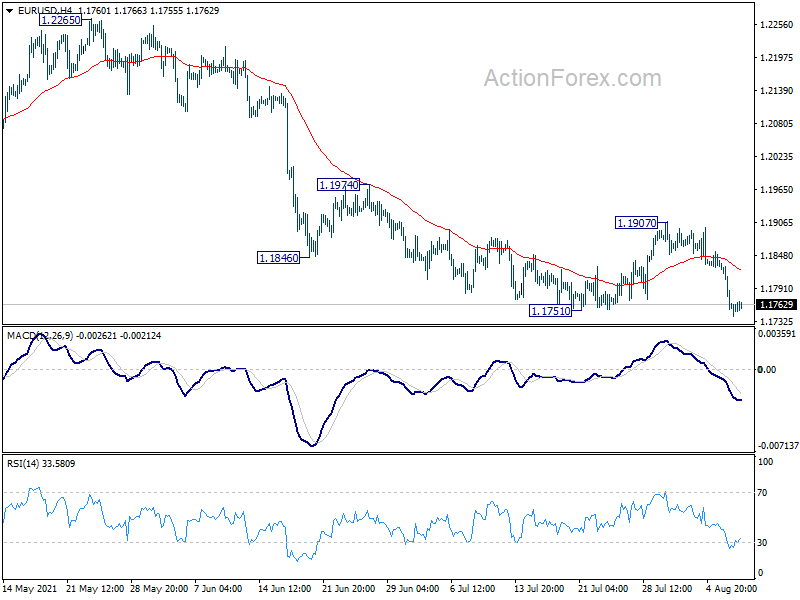
In the bigger picture, rise from 1.0635 is seen as the third leg of the pattern from 1.0339 (2017 low). Further rally could be seen to cluster resistance at 1.2555 next, (38.2% retracement of 1.6039 to 1.0339 at 1.2516). This will remain the favored case as long as 1.1602 support holds. Reaction from 1.2555 should reveal underlying long term momentum in the pair. However sustained break of 1.1602 will argue that the rise from 1.0635 is over, and turn medium term outlook bearish again.
Dollar Digesting Gains Awaiting Fed Speaks, Markets Turned Mixed
Overall markets are mixed today, as Dollar is digesting some of last week's gains, awaiting more guidance from FOMC members regarding tapering. New Zealand and Canadian Dollar are the stronger ones for now. But Australian Dollar is among the weakest together with Euro and Swiss France. Yen and Sterling is slightly firmer. Gold and silver recovered after initial selloff, but stays below last week's low.
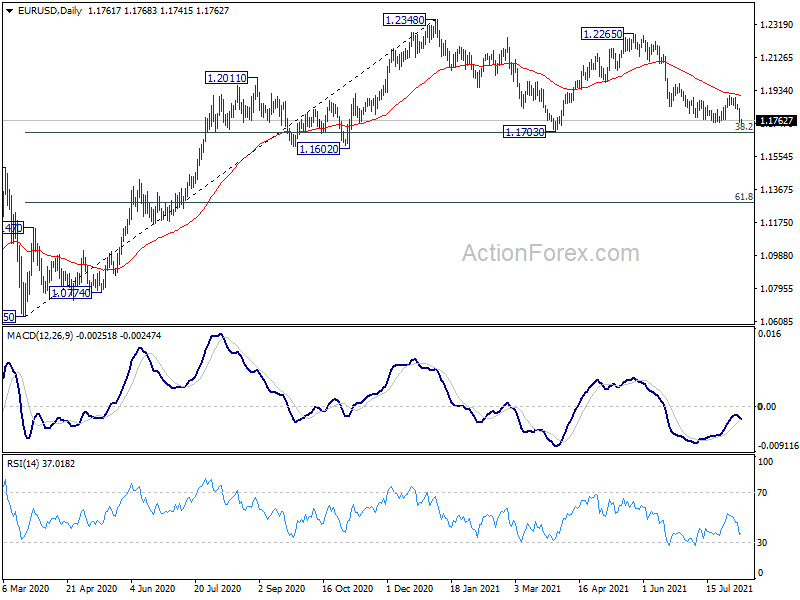
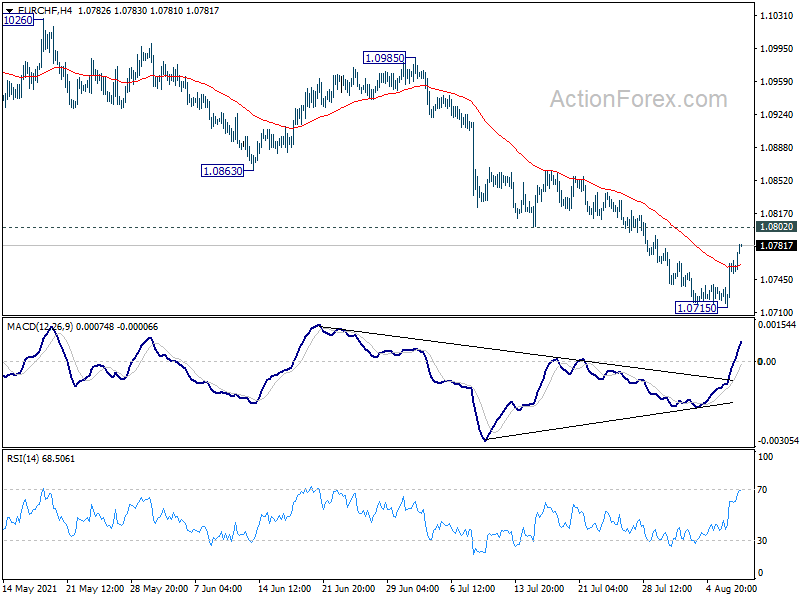
Technically, recovery in EUR/CHF is helping EUR/USD stabilizing around 1.1751 low. But EUR/CHF would face near term resistance at 1.0802, which should hold to resume recent fall. The decline in EUR/USD could take up momentum again when EUR/CHF's recovery finishes. However, break of 1.0802 in EUR/CHF could prompt stronger rebound in itself, as well as in EUR/USD too.
In Europe, at the time of writing, FTSE is down -0.12%. DAX is down -0.06%. CAC is up 0.01%. Germany 10-year yield is down -0.0147 at -0.467. Earlier in Asia, Hong Kong HSI rose 0.40%. China Shanghai rose 1.05%. Japan and Singapore were on holiday.
Eurozone Sentix dropped to 22.2, fall in expectations sends a warning sign
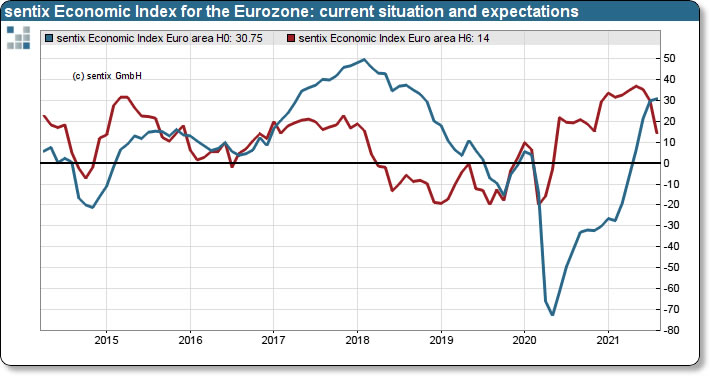
Eurozone Sentix Economic Sentiment dropped from 29.8 to 22.2 in August, below expectation of 29.0. Current Situation index rose from 29.8 to 30.8, highest since October 2018. However, Expectations index dropped sharply from 29.5 to 15.0, lowest since May 2020 and the third decline in a row.
Sentix said: "Economists traditionally recognise a trend reversal in a threefold decline. Accordingly, this decline should not be dis-missed as a mere loss of momentum, but should be understood as a warning sign. As the "first mover" among the leading indicators, these developments herald significant declines in other leading indicators. The development is therefore likely to contribute to increased market volatility in the coming weeks. In 2006 and 2010, when we went through similar phases, interim stock market corrections of around 10% followed."
From Germany, trade surplus widened to EUR 13.6B in June, below expectation of EUR 13.9B. Swiss unemployment rate dropped to 3.0% in July, matched expectations.
China PPI rose to 9.0% yoy in Jul, CPI slowed to 1.0% yoy
China's PPI accelerated to 9.0% yoy in July, up from 8.8% yoy, above expectation of 8.8% yoy. "The price increase of industrial products expanded slightly in July as prices of crude oil, coal and related products rose sharply," said senior NBS economist Dong Lijuan.
CPI slowed to 1.0% yoy, down from 1.1% yoy, above expectation of 0.8% yoy. Core CPI, excluding food and energy prices, rose 1.3% yoy. Pork prices dropped -43.5% yoy, dragging down food prices down -3.7%. Non-food prices, on the other hand, rose 2.1% yoy.
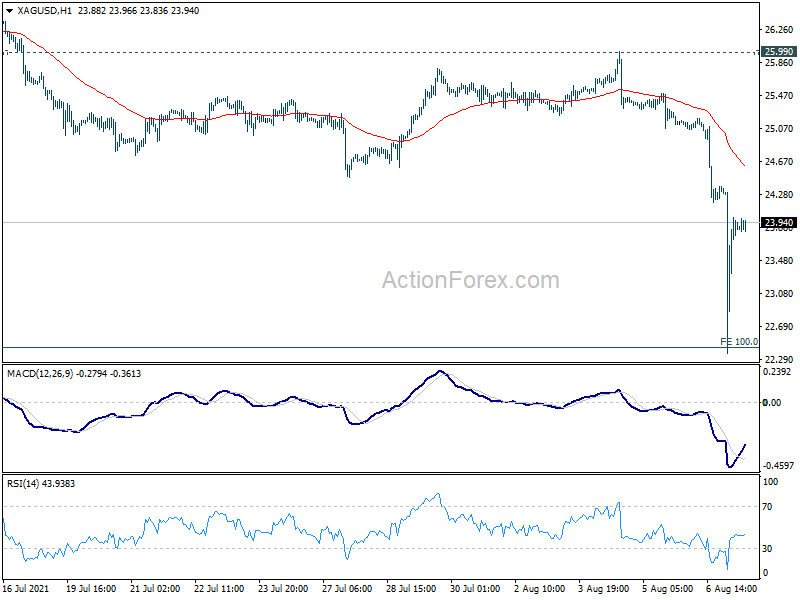
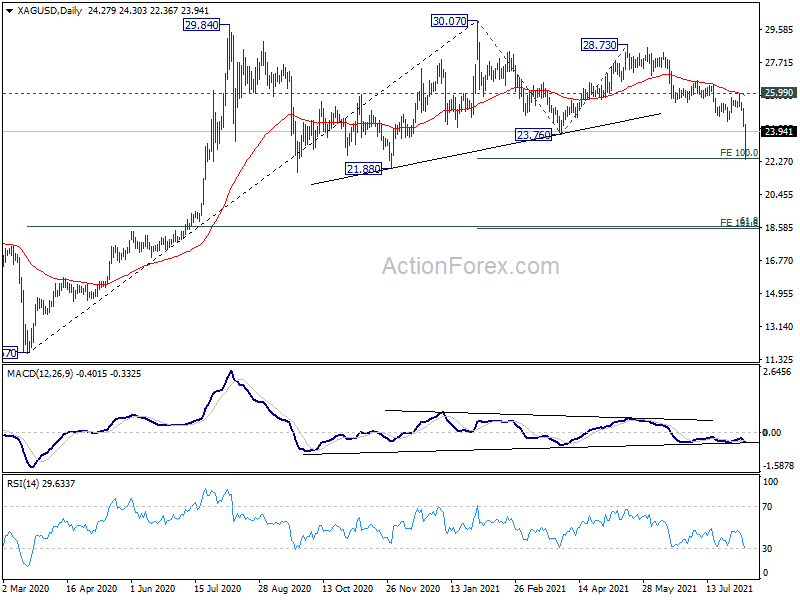
Silver stabilized after initial dive, but more downside still expected
Silver tumbled along with Gold in ultra thin Asian open, and hit as low as 22.36. While it quickly rebounded, near term outlook will stay bearish as long as 25.99 resistance holds. Prior rejection by 55 day EMA also affirmed near term bearishness. Fall from 30.07 is seen as corrective whole up trend from 11.67 low.
There are various interpretations on the price actions. One way to see them is that a head and shoulder top was formed (ls: 29.84; head: 30.07; rs: 28.73). But in any case, firm break of 100% projection of 30.07 to 23.76 from 28.73 at 22.42 will pave the way to 161.8% projection at 18.52. That is close to 61.8% retracement of 11.67 to 30.07 at 18.69. That's probably the level where Silver would complete the correction.
EUR/USD Mid-Day Outlook
Daily Pivots: (S1) 1.1732; (P) 1.1784; (R1) 1.1814; More...
Intraday bias in EUR/USD remains on the downside at this point. Current fall from 1.2265 should target 1.1602/1703 support zone. We'd expect strong support from there to bring rebound. But break of 1.1907 resistance is needed to confirm short term bottoming. Meanwhile, sustained break of 1.1602 will argue that it's already reversing the trend from 1.1603, and target 61.8% retracement of 1.1603 to 1.2348 at 1.1888.
In the bigger picture, rise from 1.0635 is seen as the third leg of the pattern from 1.0339 (2017 low). Further rally could be seen to cluster resistance at 1.2555 next, (38.2% retracement of 1.6039 to 1.0339 at 1.2516). This will remain the favored case as long as 1.1602 support holds. Reaction from 1.2555 should reveal underlying long term momentum in the pair. However sustained break of 1.1602 will argue that the rise from 1.0635 is over, and turn medium term outlook bearish again.
Economic Indicators Update
| GMT | Ccy | Events | Actual | Forecast | Previous | Revised |
|---|---|---|---|---|---|---|
| 01:30 | CNY | CPI Y/Y Jul | 1.00% | 0.80% | 1.10% | |
| 01:30 | CNY | PPI Y/Y Jul | 9.00% | 8.80% | 8.80% | |
| 05:45 | CHF | Unemployment Rate Jul | 3.00% | 3.00% | 3.10% | |
| 06:00 | EUR | Germany Trade Balance (EUR) Jun | 13.6B | 13.9B | 12.6B | |
| 08:30 | EUR | Eurozone Sentix Investor Confidence Aug | 22.2 | 29 | 29.8 |
AUD/USD Pair Started a Fresh Decline from 0.7420
The Aussie Dollar failed to clear the 0.7420 resistance zone against the US Dollar. The AUD/USD pair started a fresh decline and it broke the 0.7400 support zone.
There was also a break below the key 0.7375 support level and a close below the 50 hourly simple moving average. The pair traded as low as 0.7328 and it is currently correcting higher.
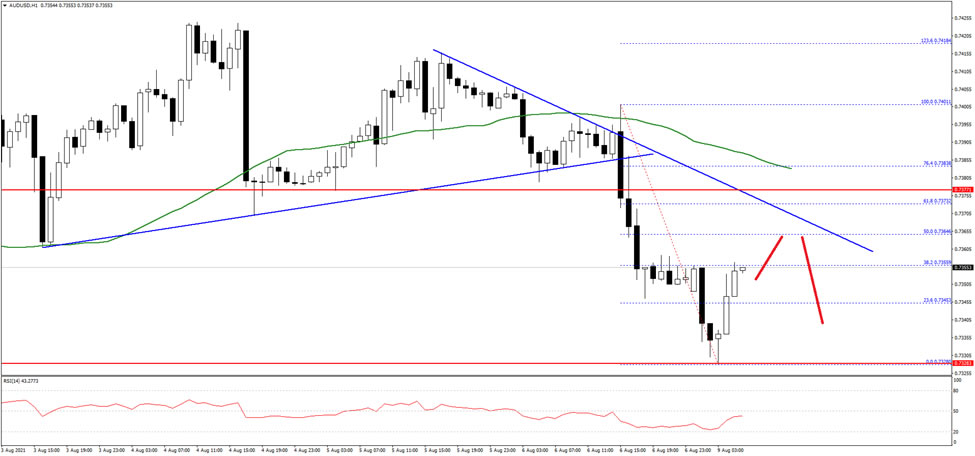
An immediate resistance on the upside is near the 0.7360 level. The first major resistance is near the 0.7365 level and a connecting bearish trend line. The main resistance is still near the 0.7385 level and the 50 hourly simple moving average.
If the pair fails to clear the trend line resistance, it could start a fresh decline below 0.7350 on FXOpen. The next major support is near the 0.7325 level, below which there is a risk of a larger decline in the near term.
China’s Mild Inflation Paves Way for Further PBOC Easing
Headline CPI eased to +1% y/y in July from +1.1% a month ago. From a month ago, inflation rose +5.3%, compared with +1.8% in June. This suggests that the slowdown in the year-over-year data was mainly due to high base. Food inflation contracted -3.7% y/y, after dropping -1.7% in June. Deflation in pork prices worsened to -43.5% y/y in July from -36.5% a month ago. Meanwhile, fresh vegetable price also fell into deflation, falling -4% y/y during the month. Yet, fresh fruit price accelerated to +5.2%, from June’s +3.1%. Non-food price improved to +2.1% y/y in Jule, from +1.7% in the prior month. Core CPI, the headline inflation excluding food and energy, climbed higher to +1.3% y/y. In June, the reading was +0.9%.
On the upstream prices, PPI accelerated to +9% y/y in July, from +8.8% in the prior month. The monthly reading also rose to +9.7% in July, from June’s +6.4%. The report reveals that the cost of production continued to increase in China. Yet, producers find it difficult to pass the cost to customers.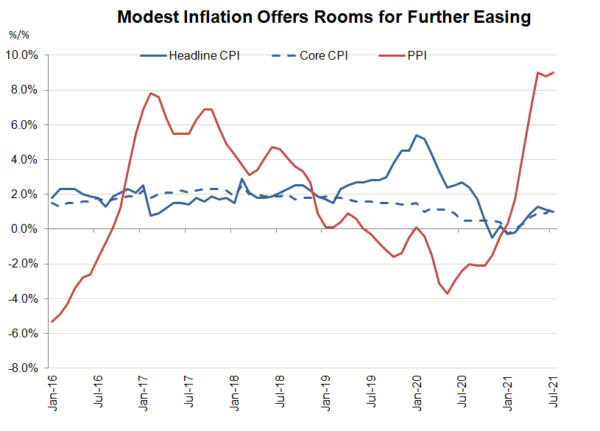
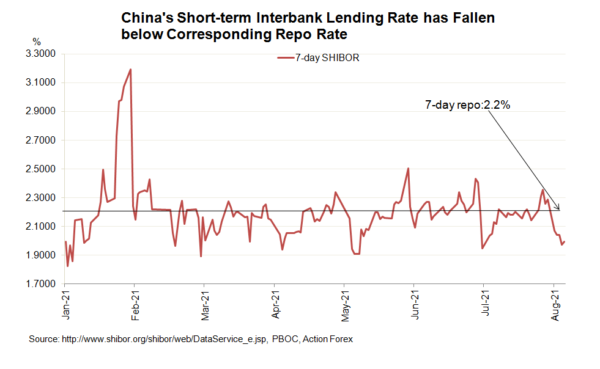
Modest CPI inflation suggests that the PBOC could still go ahead with further easing in coming months. The PBOC cut the broad RRR by -50 bps in July and affirmed a prudent and stable monetary policy stance. We believe this was an insurance cut to prevent deterioration in the country’s growth. The worsening of delta outbreak in the country affirms that more easing is needed from the central bank. Indeed, the market is preparing for more RRR cut later this year. The decline in 10-year government bond yield has accelerated since July. From the peak in mid-February, the yield has actually fallen more than 40 bps.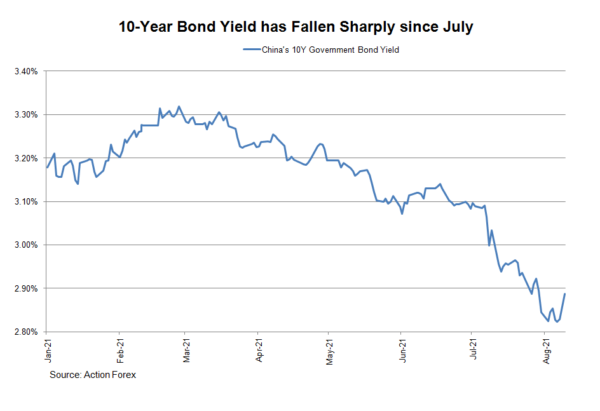 Interbank borrowing costs have also been lowered. The entire SHIBOR yield curve has shifted lower after PBOC's RRR last month. Meanwhile, the 7-day SHIBOR rate has consistently been trading below the 7-day repo rate since the beginning of August. The cost of borrowing amongst financial institutions has been lowered amidst PBOC's injection of liquidity.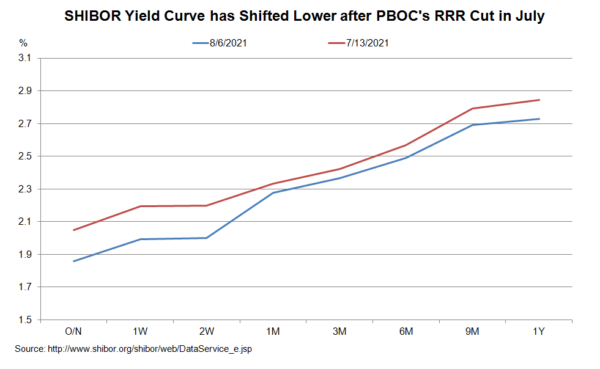
Crude Oil Falling Too Fast Amid Spread of Covid in Asia
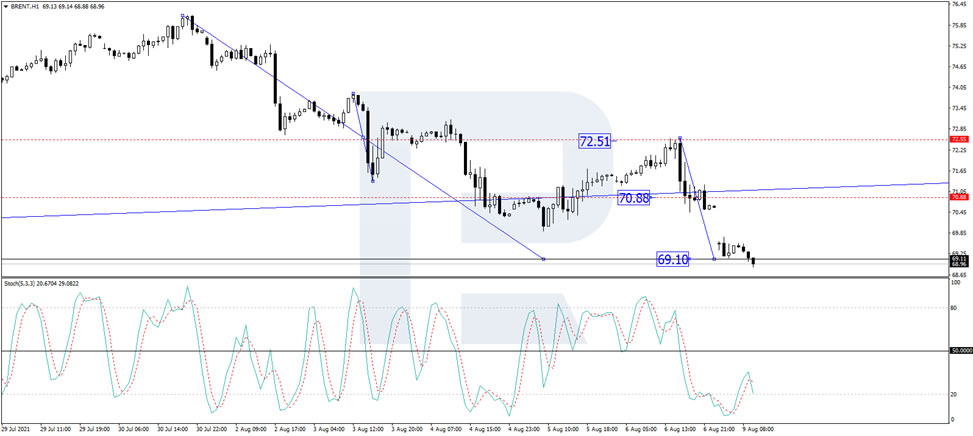
At the beginning of the new week, Brent oil prices are declining very fast, heading for the lows of July 21st and perhaps even lower.
The main reason for sales is an increase in the number of newly diseases by the coronavirus — in Japan, China, and Malaysia. This is a very threatening situation for Asia. China, for instance, is one of the main consumers of energy consumers, and a new wave of the pandemic might send the demand for oil down. This is exactly what is pushing oil prices to the bottom.
Moreover, last week it was already obvious that oil reserve in the USA had started to increase. This news has already been included in the price, but there is a risk that the new statistic will confirm the trend.
On H4, Brent oil quotations have demonstrated a wave of decline to 69.10. Today we expect a compact consolidation range to develop around this level. With an escape upwards, a link of growth to 70.88 might follow. With an escape downwards, the correction might extend to 66.10. Then growth to 71.71 might follow. Technically, this scenario is confirmed by the MACD oscillator. Its signal line is trading under zero and has returned to the histogram area. This warns us of a possible further decline.
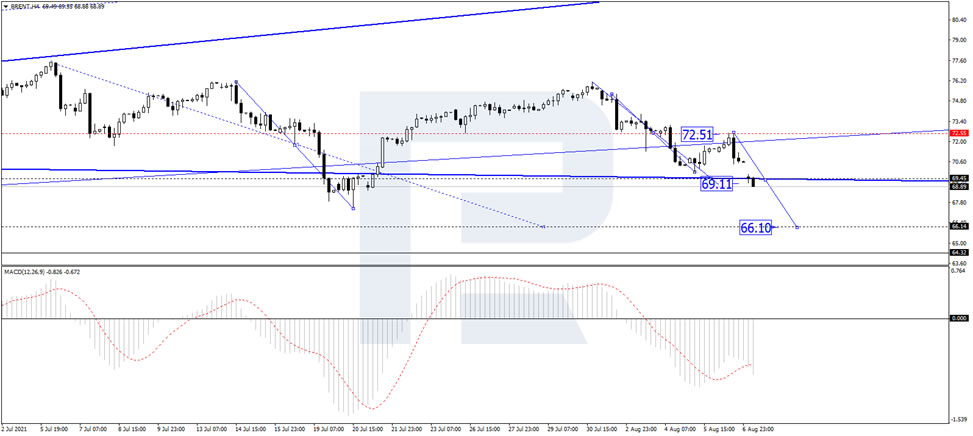
On H1, Brent completed a wave of decline to 70.85. Today the market has formed a consolidation range around this level and almost reached the next goal of the decline with a gap downwards. This structure can be interpreted as the fifth wave of decline, heading for 69.10. We expect a consolidation area to form around 69.10. With an escape upwards, we expect a link of growth to 70.85. With an escape downwards, the wave might extend to 66.10. Then growth to 71.00 might follow. The goal is first. Technically, this scenario is confirmed by the Stochastic oscillator. Its signal line is heading strictly upwards. A breakaway of 20 opened a pathway for growth to 50. With a breakaway of this, growth might continue to 80.
Infrastructure Bill Inching Closer To Passage
Notes/Observations
- German exports rise for the 14th straight month.
Asia
- (CN) China July Trade Balance: $56.6B v $52.0Be; Exports Y/Y: 19.3% v 20.0%e; Imports Y/Y: 28.1% v 33.6%e.
- CN) China July CPI Y/Y: 1.0% v 0.8%e; PPI Y/Y: 9.0% v 8.8%e.
- (CN) China July Foreign Reserves: $3.236T v $3.232Te.
Coronavirus
- US cases top 100K per day (6-month high); Asia spread worsens.
- Israel is reinstating restrictions and warning of a fresh lockdown as the number of serious cases has risen to a four month high.
Europe
ECB's Weidmann (Germany): If inflation outlook rises sustainably, ECB will have to act in line with its price stability objective. Must tighten policy if needed to counter inflation.
Former Italy PM Conte appointed leader of 5-Star party.
Various UK Ministers said to have warned PM Johnson not to remove Chancellor of the Exchequer Sunak even though they have conflicting views on spending and lockdowns.
Americas
- President Biden’s bipartisan infrastructure deal cleared its final serious Senate hurdle over the weekend. Senate voted 69 to 28 [includes 48 Democrats and 19 Republicans] to support the compromise provisions related to the $1.0T infrastructure proposal.
Speakers/Fixed income/FX/Commodities/Erratum
Equities
- Indices [Stoxx600 +0.02% at 470.08, FTSE -0.23% at 7,106.85, DAX -0.14% at 15,738.60, CAC-40 +0.03% at 6,818.67, IBEX-35 -0.11% at 8,869.00, FTSE MIB +0.30% at 26,079.50, SMI +0.63% at 12,253.02, S&P 500 Futures -0.17%].
- Market Focal Points/Key Themes: European indices open mixed with upward bias and failed to gain direction as the session wore on; sectors trending to the upside include consumer discretionary and health care; financials and industrials sectors among the underperformers; McColl's confirms looking into capital raise; Halma announces series of M&A; Vectura confirms offer from Philip Morris; Odey sells it's stakes in Ryanair and IAG; Delivery Hero takes stake in Deliveroo; earnings expected in the upcoming US session include Air Products, Dish Network and Barrick.
Equities
- Consumer discretionary: PageGroup [PAGE.UK] -3% (earnings), PostNL [PNL.NL] -2% (earnings), McColl's Retail [MCLS.UK] -19% (confirms media reports).
- Healthcare: Bavarian Nordic [BAVA.DK] +5% (vaccine study), Roche [ROG.CH] +1.5% (trial results).
Speakers
- Poland Central Bank's Kropiwnicki: Inflation at 5.0% was alarming and saw the 1st Polish rate hike in November at the earlier and by 15bps maximum.
- Romania Central Bank Gov Isarescu stated that CPI was driven higher by more factors at this time; raised both 2021 and 2022 inflation outlook. Tightening cycle had started without rate hike and saw some price growth easing due to policy tightening. Reiterated plan for hikes taking place at the appropriate time.
Currencies/ Fixed income
- The USD was slightly softer in the session as dealers noted that some profit-taking was encountered following the greenback’s sharp rise last week. EUR/USD tested 1.1742 for 4-month lows during Asia’s session. Friday session saw a stronger USD on expectations the Fed was moving closer to reducing stimulus after a strong jobs report.
- EUR/USD at 1.1750 area in the session. Euro remain vulnerable due to divergence in central bank outlook. Overall markets anticipate on additional monetary policy easing by the ECB while the Fed appears to be inching towards the exit.
- Safe haven flows being eyed as participants are warily eyeing a rise in COVID-19 cases across Asia.
Economic data
- (SE) Sweden Aug SEB Housing-Price Indicator: 39 v 62 prior.
- (CH) Swiss Unemployment Rate:2.8 % v 2.8%e; Unemployment Rate (seasonally adj): 3.0% v 3.0%e.
- (DE) Germany Jun Current Account Balance: €22.5B v €18.9Be; Trade Balance: €16.3B v €13.5Be; Exports M/M: 1.3% v 0.3%e; Imports M/M: 0.6% v 0.4%e.
- (NO) Norway Jun Industrial Production M/M: +0.9% v -0.3% prior; Y/Y: 4.3% v 2.1% prior.
- (NO) Norway Jun Manufacturing Production M/M: +0.9% v -0.1% prior; Y/Y:4.3 % v 7.6% prior.
- (DK) Denmark Jun Current Account Balance (DKK): 18.8B v 14.6B prior; Trade Balance: 15.3B v 6.0B prior.
- (AU) Australia July Foreign Reserves: A$64.0B v A$64.7B prior.
- (CZ) Czech July Unemployment Rate: 3.7% v 3.7% prior.
- (CH) Swiss weekly Total Sight Deposits (CHF): 713.2B v 712.0B prior; Domestic Sight Deposits: 635.9B v 636.4B prior.
- (CZ) Czech July International Reserves: $167.5B v $167.1B prior.
- (TW) Taiwan July Trade Balance: $5.9B v $5.4Be; Exports Y/Y: 34.7% v 33.4%e; Imports Y/Y: 41.0% v 39.2%e.
- (FR) Bank of France July Industrial (Business) Sentiment: 105 v 107e.
- (EU) Euro Zone Aug Sentix Investor Confidence: 22.2 v 29.0e.
- (GR) Greece Jun Industrial Production Y/Y: % v 14.1% prior.
- (GR) Greece July CPI Y/Y: % v 1.0% prior; CPI EU Harmonized Y/Y: % v 0.6% prior.
- (HU) Hungary July YTD Budget Balance (HUF): T v -1.705T prior.
Fixed income issuance
- None seen.
Looking ahead
- 05:25 (EU) Daily ECB Liquidity Stats.
- 05:30 ((DE) Germany to sell €4.0B in 6-month BuBills.
- 05:30 (ZA) South Africa announces details of upcoming I/L bond sale (held on Fridays).
- 06:00 (IE) Ireland Jun Industrial Production M/M: No est v -4.6% prior; Y/Y: No est v 30.0% prior (revised from 29.9%).
- 06:00 (IE) Ireland July Live Register Monthly Change: No est v -3.5K prior; Live Register Level: No est v 170.9K prior.
- 06:00 (IL) Israel to sell bonds.
- 06:00 (RO) Romania to sell RON400M in 4.75% 2034 Bonds.
- 06:45 (US) Daily Libor Fixing.
- 07:00 (MX) Mexico July CPI M/M: 0.6%e v 0.5% prior; Y/Y: 5.8%e v 5.9% prior; CPI Core M/M: 0.5%e v 0.6% prior.
- 07:00 (BR) Brazil July FGV Inflation IGP-DI M/M: 1.3%e v 0.1% prior; Y/Y: 33.2%e v 34.5% prior.
- 07:25 (BR) Brazil Central Bank Weekly Economists Survey.
- 08:00 (UK) Daily Baltic Dry Bulk Index.
- 08:00 (IN) India announces details of upcoming bond sale (held on Fridays).
- 08:30 (UR) Ukraine July CPI M/M: -0.2%e v +0.2% prior; Y/Y: 9.9%e v 9.5% prior.
- 08:30 (CL) Chile July Trade Balance: No est v $1.1B prior; Total Exports: No est v $7.5B prior; Total Imports: No est v $6.4B prior; Copper Exports: No est v $4.4B prior.
- 08:30 (CL) Chile July International Reserves: No est v$45.0B prior.
- 09:00 (FR) France Debt Agency (AFT) to sell €4.0-5.2B in 3-month, 6-month and 12-month bills.
- 09:45 (EU) ECB weekly QE bond buying update.
- 09:45 (UK) BOE buys £1.147B in APF Gilt purchase operation (3-7 years).
- 10:00 (US) Jun JOLTS Job Openings: 9.270Me v 9.209M prior.
- 10:00 (US) Fed’s Bostic.
- 11:30 (US) Treasury to sell 13-Week and 26-Week Bills.
- 12:00 (US) Fed’s Barkin.
- (CO) Colombia July Consumer Confidence Index: -16.5e v -22.3 prior.
- 16:00 (US) Weekly Crop Progress Report.
- 18:00 (NZ) New Zealand July Heavy Truckometer M/M: No est v 1.2% prior.
- 18:45 (NZ) New Zealand July Retail Card Spending M/M: No est v 0.9% ; Total Card Spending M/M: No est v 1.6% prior.
- 19:01 (UK) July BRC Sales Like-For-Like Y/Y: 5.0%e v 6.7% prior.
- 19:30 (AU) Australia ANZ Roy Morgan Weekly Consumer Confidence Index: No est v 101.8 prior.
- 19:50 (JP) Japan July Current Account Balance: ¥846.2Be v ¥1.980T prior; Adjusted Current Account: ¥1.713Te v ¥1.867T prior; Trade Balance (BOP basis): ¥639.0Be v ¥2.0B prior.
- 19:50 (JP) Japan July Bank Lending Y/Y: No est v 1.4% prior; Bank Lending (ex-trusts) Y/Y: No est v 0.8% prior.
- 21:30 (AU) Australia July NAB Business Confidence: No est v 11 prior; Business Conditions: No est v 24 prior.
- 21:30 (KR) South Korea to sell KRW400B in 2-year Bonds.
- 22:00 (PH) Philippines Q2 GDP Q/Q: -1.1%e v +0.3% prior; Y/Y: +10.8%e v -4.2% prior.
- 22:30 (KR) South Korea to sell KRW600B in 2-Year Bonds
- 23:00 (TH) Thailand Govt to sell THB17.0B in 2031 Bonds.
- 23:00 (TH) Thailand Central Bank to sell THB60B in Bills.
- 23:30 (HK) Hong Kong to sell 3-month and 6-month Bills.
Eurozone Sentix dropped to 22.2, fall in expectations sends a warning sign
Eurozone Sentix Economic Sentiment dropped from 29.8 to 22.2 in August, below expectation of 29.0. Current Situation index rose from 29.8 to 30.8, highest since October 2018. However, Expectations index dropped sharply from 29.5 to 15.0, lowest since May 2020 and the third decline in a row.
Sentix said: "Economists traditionally recognise a trend reversal in a threefold decline. Accordingly, this decline should not be dis-missed as a mere loss of momentum, but should be understood as a warning sign. As the "first mover" among the leading indicators, these developments herald significant declines in other leading indicators. The development is therefore likely to contribute to increased market volatility in the coming weeks. In 2006 and 2010, when we went through similar phases, interim stock market corrections of around 10% followed."
The Analytical Overview Of The Main Currency Pairs
The EUR/USD currency pair
Technical indicators of the currency pair:
Prev Open: 1.1832
Prev Close: 1.1761
% chg. over the last day: -0.60%
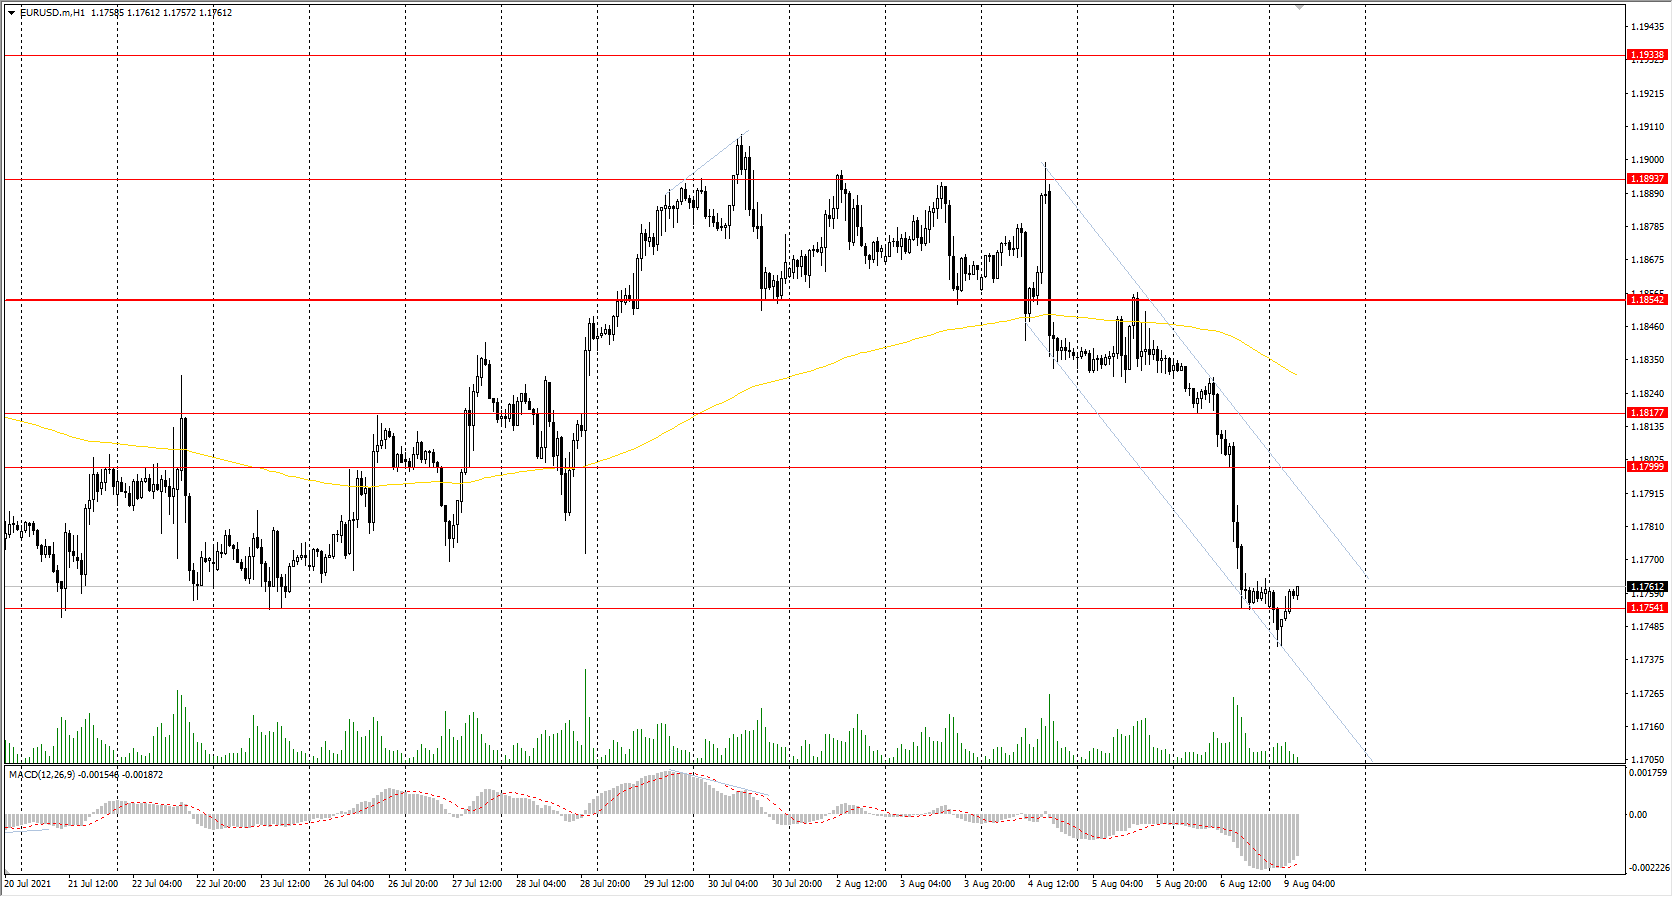
The EUR/USD currency pair sharply fell by 0.60% and broke through the priority change level with the release of the non-farm news on Friday. The European currency has gained an extremely weak position now. There are no important events scheduled in Europe until the end of August (vacation season), so it’s the US policy that will mainly influence the European currency.
Trading recommendations
Support levels: 1.1754, 1.1609
Resistance levels: 1.1799, 1.1817, 1.1854, 1.1894, 1.1934, 1.1969
From a technical point of view, the general trend on the EUR/USD currency pair has changed to bearish. The price went below the moving average; the MACD indicator is in the oversold zone, but with no signs of a reversal. Under such market conditions, it is better to look for sell trades from the resistance levels, but after a slight upward correction since the price has deviated strongly from the middle line. Buy trades can only be considered throughout the day and only with confirmation in the form of a bullish initiative.
Alternative scenario: if the price breaks through the 1.1854 resistance level and fixes above, the mid-term uptrend is likely to resume.
News feed for 2021.08.09:
- US FOMC Member Bostic Speaks at 17:00 (GMT+3);
- JOLTs Job Openings (m/m) at 17:00 (GMT+3);
- US FOMC Member Barkin Speaks at 19:00 (GMT+3).
The GBP/USD currency pair
Technical indicators of the currency pair:
Prev Open: 1.3926
Prev Close: 1.3872
% chg. over the last day: -0.39%
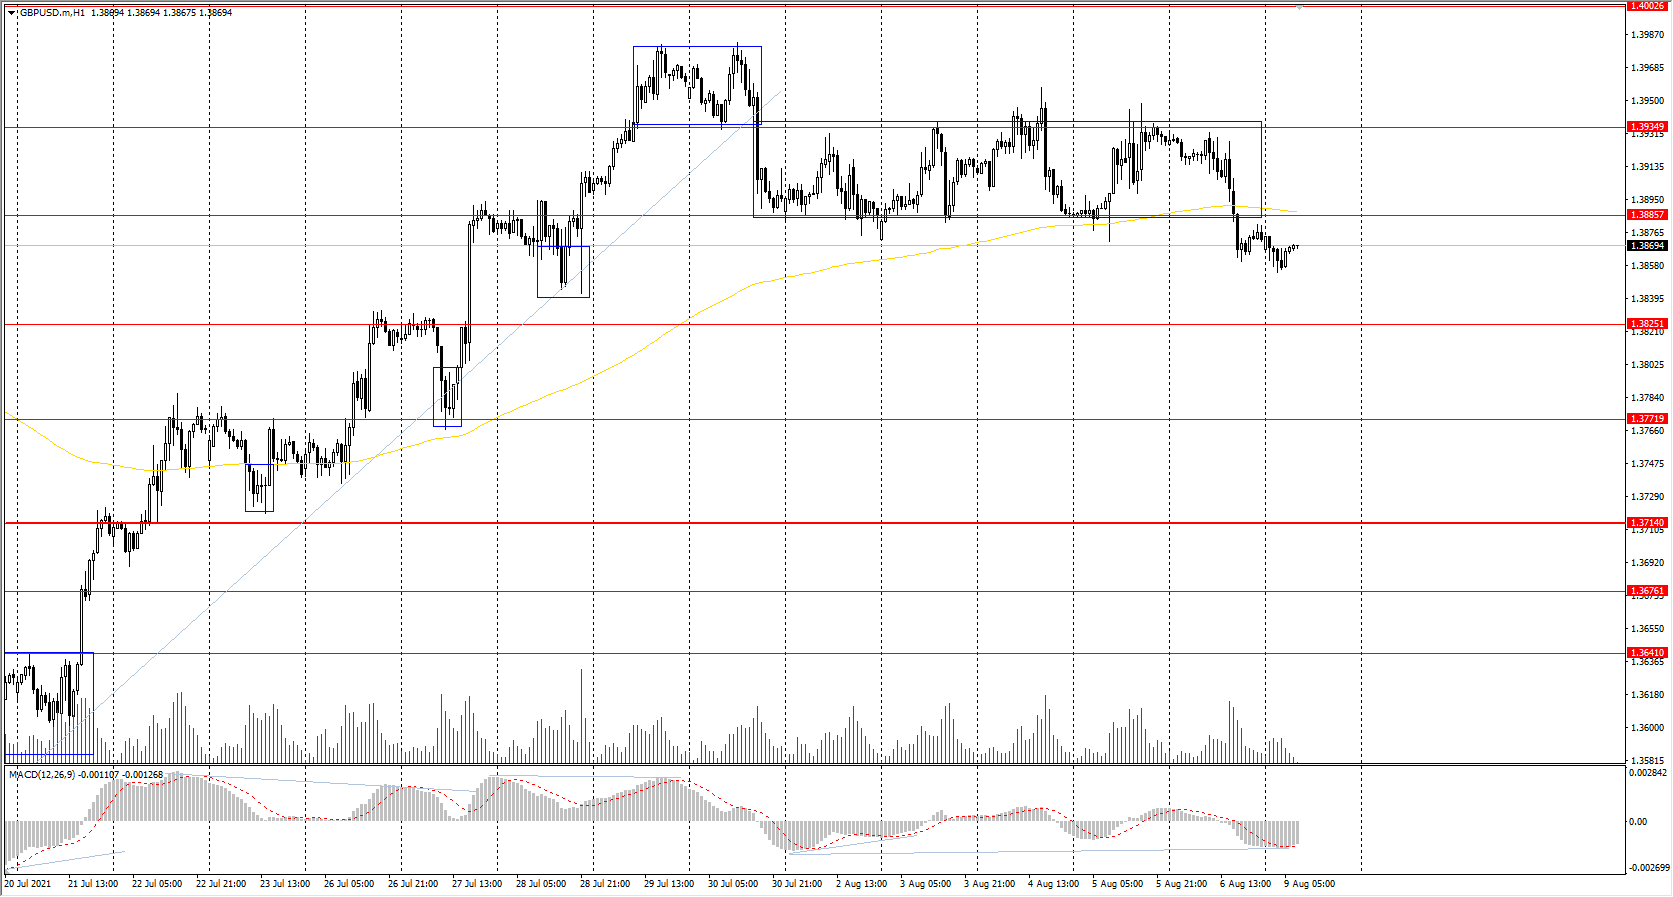
Unlike the euro, the British pound gained a more confident position. Despite the decline in the price, the British pound remained in an uptrend. The fundamental picture for the UK is now positive, so with any weakness in the dollar index, the British currency will continue to strengthen.
Trading recommendations
Support levels: 1.3825, 1.3772, 1.3714, 1.3676 ,1.3641, 1.3614, 1.3525
Resistance levels: 1.3886, 1.3935, 1.4002, 1.4075, 1.4101
On the hour timeframe, the trend of the GBP/USD currency pair is bullish. The price left the trading range in a downward direction, but if it returns to the indicated corridor, the price will immediately head to the 1.3935 resistance level. The MACD indicator went into the negative zone, but there are signs of a hidden divergence. Under such market conditions, traders are better to look for buy trades after breaking the resistance level of 1.3885. Sell positions can be considered from the resistance levels, but only on intraday timeframes, and only with short targets.
Alternative scenario: if the price breaks through the 1.3714 support level and consolidates below, the bearish scenario is likely to resume.
The USD/JPY currency pair
Technical indicators of the currency pair:
Prev Open: 109.76
Prev Close: 110.22
% chg. over the last day: +0.42%
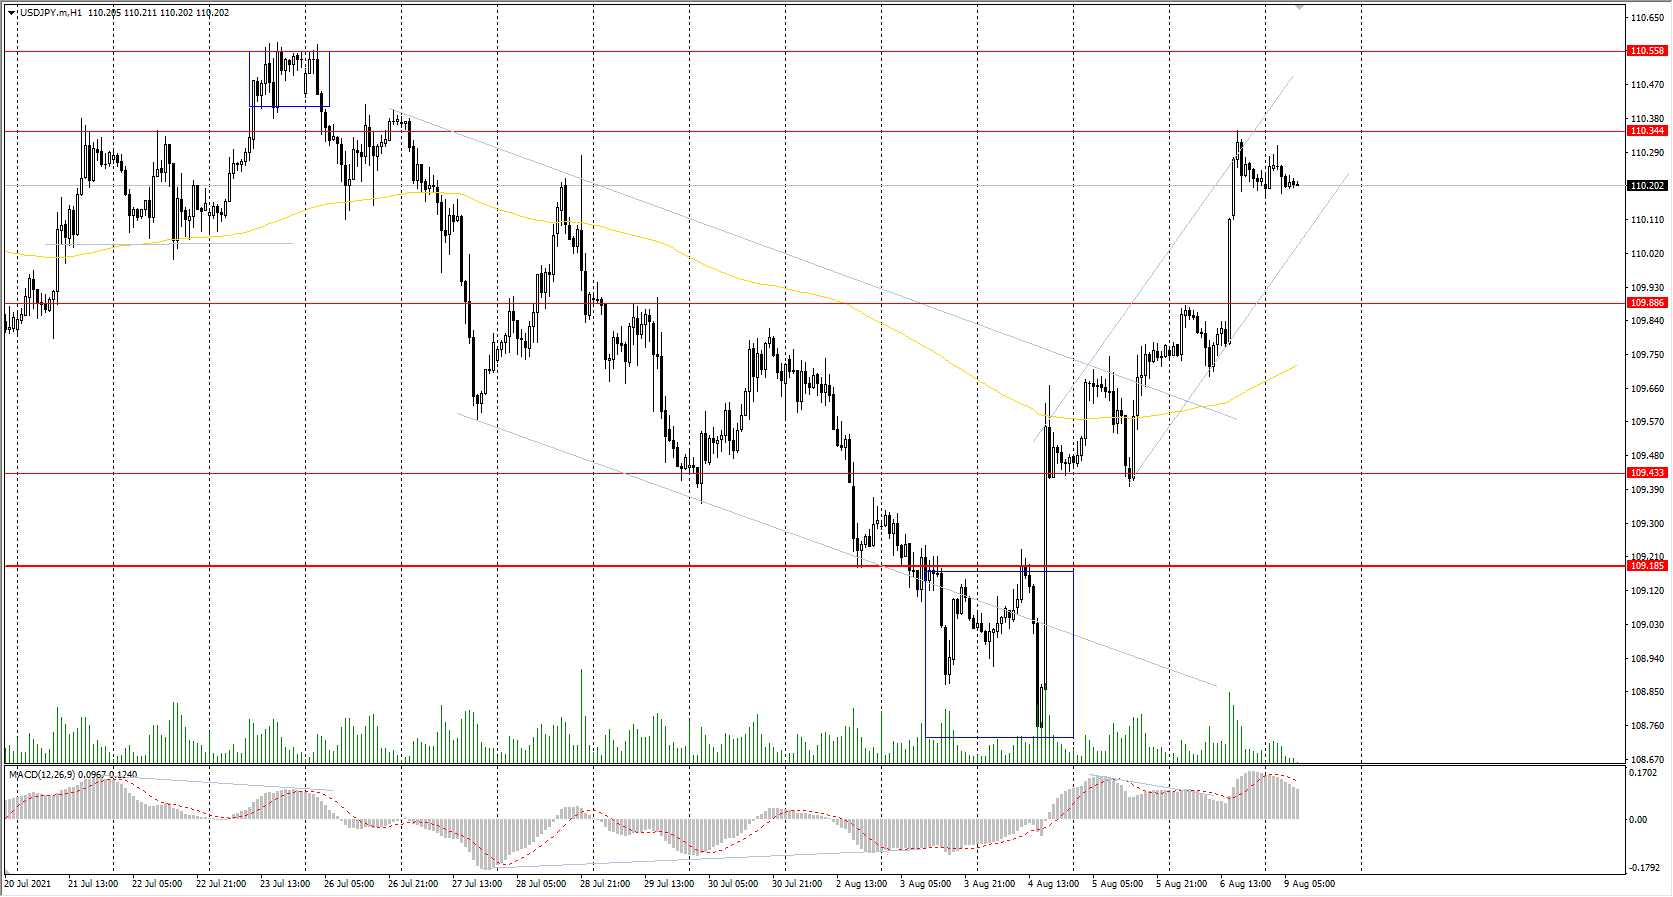
The Japanese Yen is losing momentum. Considering the dollar index growth, the USD/JPY currency pair increased by another 0.42%, breaking through the priority change level and changing the medium-term trend. The economists forecast a slowdown in economic growth for the third quarter in Japan, so with the continued dynamics of the dollar index, the rate of USD/JPY will tend to rise.
Trading recommendations
Support levels: 109.88, 109.43, 109.19, 108.65
Resistance levels: 110.34, 110.56
The main trend on the USD/JPY currency pair has changed to bullish. The MACD indicator is in the oversold zone but with no signs of a reversal. Under such market conditions, it is better to look for buy positions after a small pullback downwards because the price has strongly deviated from the moving average now. Sell positions should be considered only on the lower timeframes from the resistance level and only with short targets.
Alternative scenario: if the price falls below 109.19, the uptrend is likely to be broken.
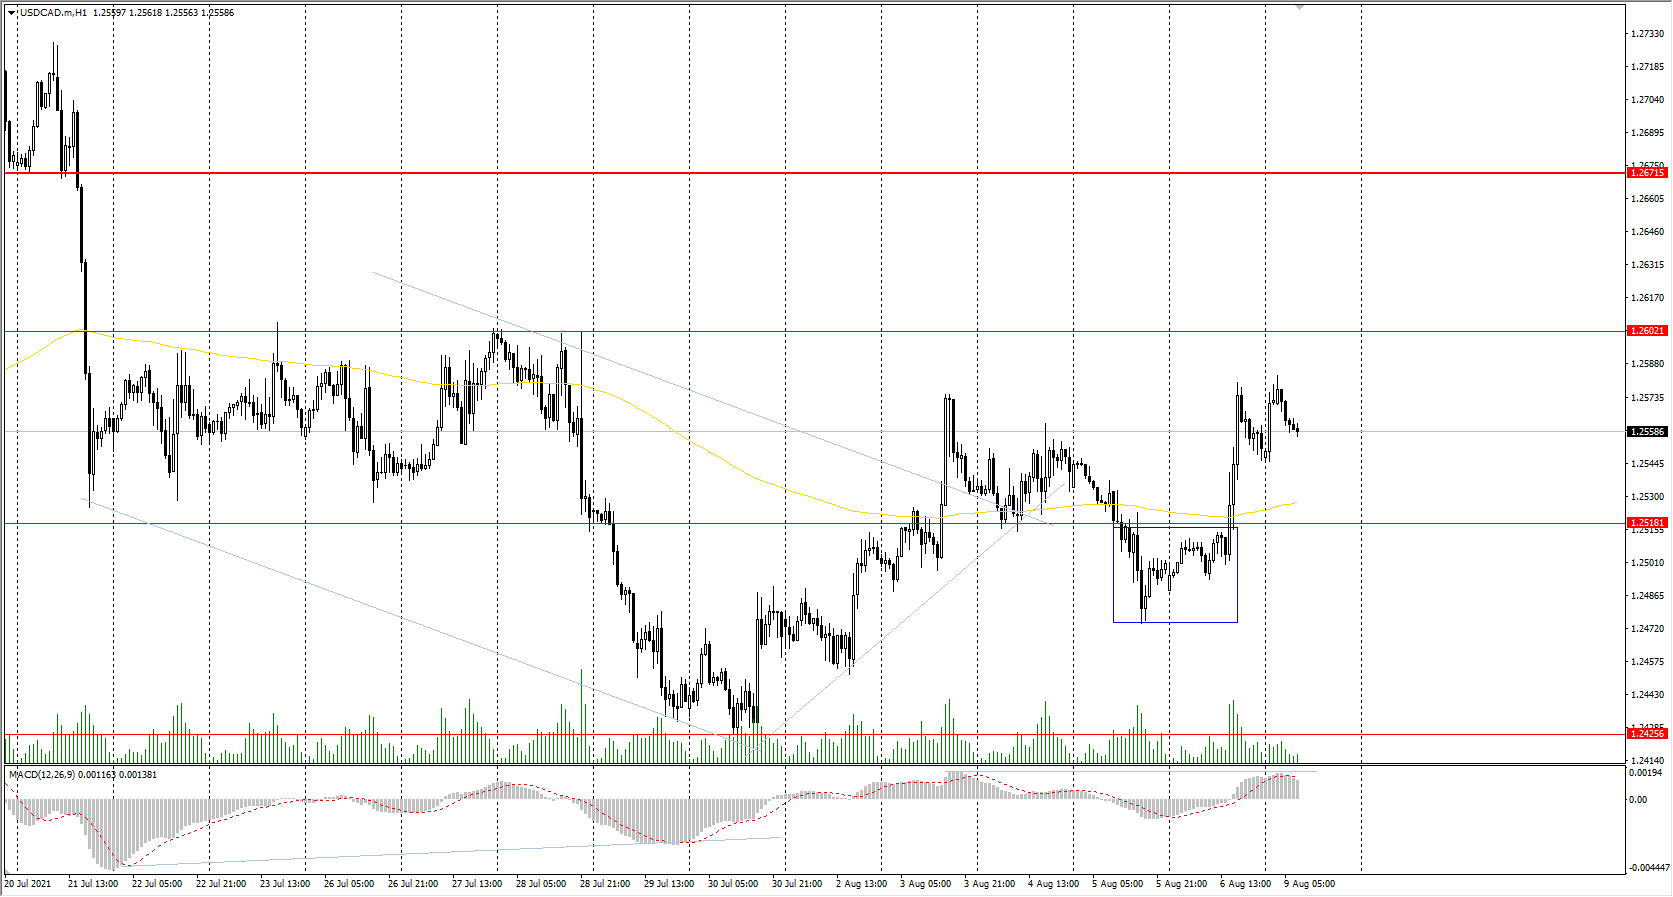
The USD/CAD currency pair
Technical indicators of the currency pair:
Prev Open: 1.2489
Prev Close: 1.2551
% chg. over the last day: +0.50%
The Canadian dollar is highly dependent on the dollar index and the oil price dynamics. On Friday, the dollar index increased while oil prices fell, which caused the rise in the USD/CAD currency pair. According to the Bureau of Statistics, the unemployment rate fell to its lowest level since March this year, to 7.5% (previous 7.8%), while the economy introduced more than 94,000 jobs. But there is still a long way to go before reaching the level of 5.5% (February 2020).
Trading recommendations
Support levels: 1.2518, 1.2471, 1.2425, 1.2370, 1.2312
Resistance levels: 1.2602, 1.2671, 1.2787, 1,2951
Considering technical analysis, the USD/CAD trend is bearish. The price is above the moving average, the MACD indicator is positive, but there are signs of a hidden divergence. Under such market conditions, traders should look for sell positions from the resistance levels after sellers show initiative. Traders should consider buy positions from the support levels and only on intraday timeframes.
Alternative scenario: if the price breaks through the 1.2671 resistance level and fixes above, the uptrend is likely to be resumed.