

Sample Category Title
Crude Oil Prone to Record First Fall in 3 Weeks on Delta Variant, China Slowdown and OPEC+’s Deal
Despite recovery, crude oil prices are prone to record the first decline in 3 weeks. The sharp selloff earlier in the week is a result of a confluence of factors including resurgence of the pandemic in the US and China, China’s economic slowdown and OPEC+’s plan to increase output.
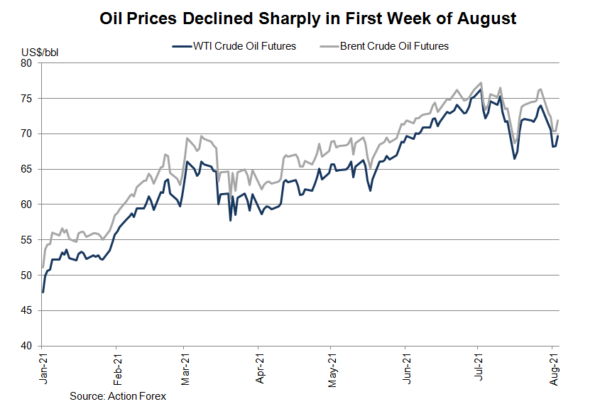
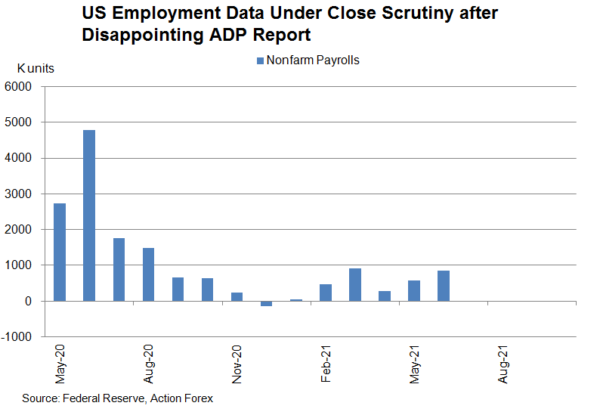
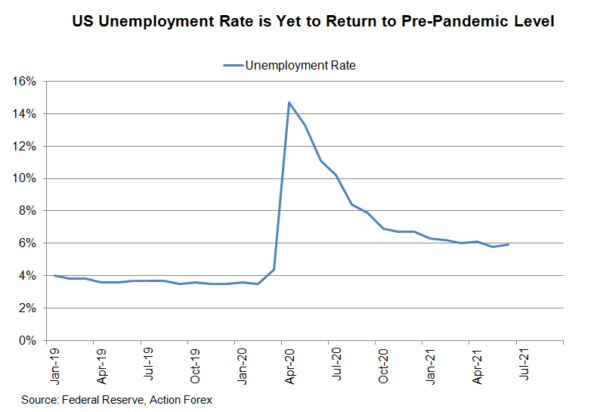
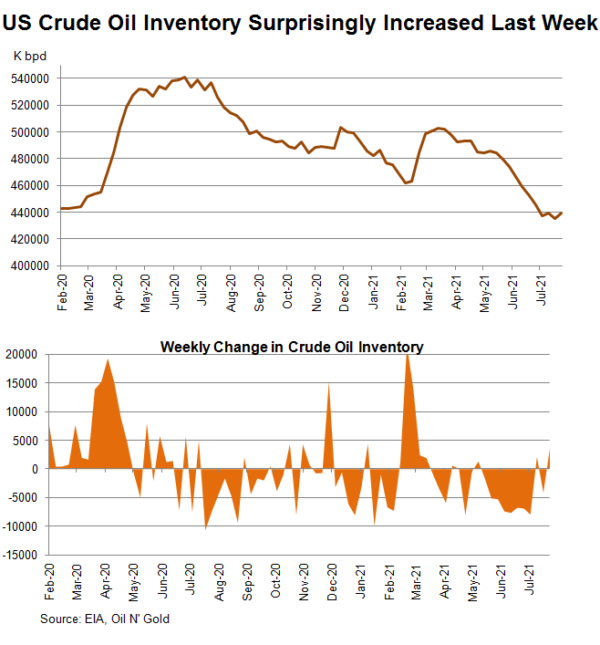
The rapid spread of the delta variant has raised the uncertainty of global economic recovery. In the US, the world’s largest oil consumer, the number of new coronavirus cases has hit a 6-month high with over 100K infections on Wednesday. The 7-day average, at about 95K, represents a 5-fold increase from a month ago. On the dataflow, the ADP report showed that the number of payrolls increased only +330K in July, greatly missing consensus of +680K addition. The attention is now turned to Friday’s nonfarm payrolls which probably gained +700K last month. A reading below this one could lead to more risk aversion and further correction in oil prices. The surprising increase in US crude oil inventory only added to worries. Stockpile gained +3.63M bpd in the week ended July 30, compared with consensus of a -3.1M bpd decline. Yet, the inventory level remains the lowest since February 2020. A longer timeframe is needed to reflect demand/supply situation of the US.
The latest outbreak in China, the second largest oil consumer, has already spread to more than 20 cities and nearly half of the country’s 32 provinces, triggering new restrictive measures (including restriction of individual movements, and cancellation of inbound and outbound flights) in the country. Wang Lining, a researcher with China National Petroleum Corp’s Economics and Technology Research Institute, noted that “this round of infection could potentially wipe out 5% of short-term oil demand”. The actual impact remains unknown as it depends on the infection rate and the duration of the resurgence.
China's growth momentum decelerated in 2Q21. GDP growth eased to +7.9% y/y in 2Q21, from +18.3%. Notwithstanding the strong base, the growth actually missed consensus of +8.1%. Separately, industrial production expanded +8.3% y/y in June, easing from +8.8% a month ago while retail sales grew +12.1 % y/y, easing slightly from +12.4% in May. The slowdown in fixed asset investments was the most remarkable. Growth eased to +12.6% y/y in the first half of the year, compared with +15.4% in the first 5 months. The latest round of outbreak will also inevitably add pressure to China’s slowing economic activities.
Notwithstanding demand constraint, OPEC+ decided to move ahead with more output. In mid-July, OPEC+ reached a deal which allows the alliance to pump more crude to the market. The alliance agreed to trim production cuts by 0.4M bpd per month starting in August, amounting to a 2M bpd total increase by the end of the year. The deal also extends the OPEC+ supply management pact to the end of 2022, from its previous expiry of April 2022. It is anticipated that all output cut will be removed by September 2022.
Markets Quiet Ahead Of US Payroll Report
Notes/Observations
- European indices trading sideways ahead of US payroll data.
- Corporate front: Companies due to report during the NY morning include DraftKings, Canopy Growth, Norwegian Cruise Line, Goodyear Tire & Rubber, Dominion Energy, Inc., etc.
Asia
- (CN) China Q2 Preliminary Current Account Balance: $52.8B v $69.4B prior.
- (AU) RESERVE BANK OF AUSTRALIA (RBA) STATEMENT ON MONETARY POLICY (SOMP): Will act if worsening health outcomes hit economic outlook.
- (IN) INDIA CENTRAL BANK (RBI) LEAVES REPURCHASE RATE UNCHANGED AT 4.00%; AS EXPECTED.
Coronavirus
- UK govt added Germany, Austria, Norway, Latvia, Slovakia and Slovenia to its 'green list'.
Europe
- Italy PM Draghi: Expects Italian economy to continue to do well, committed to beginning school year with face to face teaching.
Mid-East
- Israel fires artillery into southern Lebanon in retaliation for second day of rocket attacks from the area.
Americas
- US futures steady ahead of July Non-Farm payroll report, forecast for 870K jobs added inline with the prior month.
Speakers/Fixed income/FX/Commodities/Erratum
Equities
- Indices [Stoxx600 0.00% at 469.98, FTSE % at #, DAX +0.13% at 15,765.15, CAC-40 -0.01% at 6,780.55, IBEX-35 -0.22% at 8,817.00, FTSE MIB +0.47% at 25,786.50, SMI +0.07% at 12,208.75, S&P 500 Futures +0.01%].
- Market Focal Points/Key Themes: European indices open mixed and failed to gain direction as the session wore on; sectors trending to the upside include financials and health care; sectors trending to the downside include materials and utilities; DAX supported by better than expected results from Allianz; insurance subsector supported by UK government scheme to support live events; Marks announces to acquisitions along with earnings; focus on upcoming NFP later in the day; earnings expected in the upcoming US session include Gannett, Spectrum Brands, Fluor and Dominion Energy.
Equities
- Financials: Allianz [ALV.DE] +2.5% (earnings), ING Group [INGA.NL] +1% (earnings), London Stock Exchange [LSEG.UK] +4% (earnings).
- Industrials: Airbus [AIR.FR] -1% (deliveries), Maersk [MAERSKB.DK] -1% (final earnings; acquisitions).
- Materials: Covestro [1COV.DE] -1% (earnings).
Speakers
- (AU) Reserve Bank of Australia (RBA) Gov Lowe: Outbreaks mean GDP likely to decline in Sept quarter, Does not expect to raise cash rate before 2024 - statement ahead of SOMP release.
- (IN) Reserve Bank of India (RBI) Das: High-frequency indicators suggest consumption are on demand of regaining traction
Currencies/Fixed Income
- Quiet FX session ahead of US jobs data
- Cable steady following BoE rate decision yesterday, consolidating above $1.39.
- Bank of Italy targeting debt reduction in July to €492B from €521B in June, with funding to banks steady at €463.7B
Economic data
- (CN) China Q2 Preliminary Current Account Balance: $52.8B v $69.4B prior
- (DE) GERMANY JUN INDUSTRIAL PRODUCTION M/M: -1.3% V +0.5%E; Y/Y: 5.1% V 7.9%E.
- (UK) JULY HALIFAX HOUSE PRICE INDEX M/M: +0.4% V -0.5% PRIOR; Y/Y: +7.6% V 8.8% PRIOR
- (FR) FRANCE JUN TRADE BALANCE: -€5.8B V -€6.2BE.
- (IS) Iceland July Preliminary Trade Balance (ISK): -16.1B v -30.2B prior.
- (IT) Italy Jun Industrial Production M/M: 1.0% v 1.1%e; Y/Y: 13.9% v 13.4%e
- (SE) Sweden July Budget Balance (SEK): +8.1B v -34.0B prior.
- (AT) Austria July Wholesale Price Index M/M: 1.5% v 1.4% prior; Y/Y: 12.1% v 11.2% prior.
- (ES) Spain Jun Industrial Production M/M: -1.0% v 0.5%e; Y/Y: 11.1% v 13.5%e.
- (ES) Spain Jun House transactions Y/Y: 73.5% v 107.6% prior.
- (CH) Swiss July Foreign Currency Reserves (CHF): 923.2B v 941.4B prior.
- (CZ) Czech Jun National Trade Balance (CZK): -6.9B v +19.8Be.
- (CZ) Czech Jun Industrial Output Y/Y: 11.4% v 8.7%e.
- (HU) Hungary Jun Industrial Production M/M: -0.3% v +3.3% prior; Y/Y: 18.6% v 17.5%e.
- (HU) Hungary Jun Preliminary Trade Balance: €0.7B v €0.1B prior.
- (IT) Bank of Italy July Balance-Sheet Aggregates: Target2 Liabilities at €492.2B v €521.5B prior.
Fixed income Issuance
- Non seen yet.
Looking Ahead
- (MX) Mexico May Gross Fixed Investment: % v 45.4%e.
- (MX) Mexico July Vehicle Production: K v 264.0K prior.
- (IN) India Weekly Forex Reserve w/e July 30th: $B v $611.1B prior.
- (CL) Chile July CPI M/M: % v 0.4%e; Y/Y: % v 4.1%e.
- (US) July Change in Nonfarm Payrolls: + 870Ke v +850K prior; Change in Private Payrolls: +709Ke v +662K prior; Change in Manufacturing Payrolls: +28Ke v +15K prior.
- US) July Unemployment Rate: 5.7%e v 5.9% prior; Underemployment Rate: No est v 9.8% prior; Labor Force Participation Rate: 61.8%e v 61.6% prior.
- (US) July Average Hourly Earnings M/M: 0.3%e v 0.3% prior; Y/Y: 3.9%e v 3.6% prior; Average Weekly Hours: 34.7e v 34.7 prior.
- (CA) Canada July Net Change in Employment: +1505.0Ke v +230.7K prior; Unemployment Rate: 7.4%e v 7.8% prior; Full Time Employment Change: No est v -33.2K prior; Part Time Employment Change: No est v +263.9K prior; Participation Rate: 65.5%e v 65.2% prior; Hourly Wage Rate Y/Y: 0.2%e v 0.1% prior.
- (RU) Russia July Official Reserve Assets: $597.4Be v $597.5B prior.
- (US) Jun Final Wholesale Inventories M/M: 0.8%e v 0.8% prelim; Wholesale Trade Sales M/M: No est v 0.8% prior.
- CA) Canada July Ivey Purchasing Managers Index (seasonally Adj): No est v 71.9 prior; PMI (unadj): No est v 67.7 prior.
- (TR) Turkey July Cash Budget Balance (TRY): No est v -7.2B prior.
- (US) Weekly Baker Hughes Rig Count.
- (US) Jun Consumer Credit: $23.0Be v $35.3B.
GBPJPY Edges Sideways As Advances Curbed By 50-MA
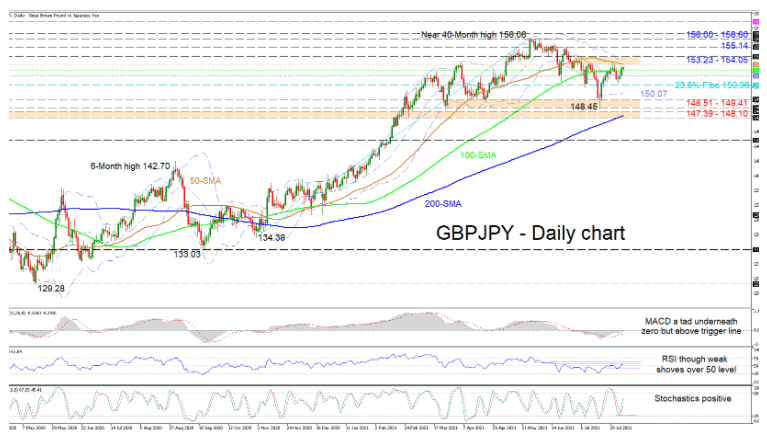
GBPJPY is presently stuck between the 50- and 100-day simple moving averages and directional momentum appears to have become feeble. The 200-day SMA is backing the positive structure, while the 50- and 100-day SMAs are endorsing a more neutral trajectory in the pair.
The short-term oscillators are indicating a pickup in buying interest but the power behind the bullish impetus appears to be somewhat lacking. The MACD is above the red trigger line and is rising towards the zero line, while the RSI is fighting to improve further above the 50 level. The positive charge in the stochastic oscillator is promoting additional positive price action in the pair.
If upside forces start to strengthen, upside limitations could commence from the zone between the 50-day SMA at 153.23 and the 154.05 high. Overcoming this barrier, which encompasses the upper Bollinger band, the next resistance obstacle may develop at the 155.14 nearby high. Conquering this too may cheer buyers to challenge the resistance section of 156.00-156.60, the latter being the rally peak in February 2018 and the former the near 40-month high.
If selling interest intensifies, an initial support area between the immediate 100-day SMA at 152.58 and the mid-Bollinger band at 151.98 could form. If the price successfully dips beneath this zone, next support may transpire from the 150.96 barrier, which happens to be the 23.6% Fibonacci retracement of the up leg from 134.39 until 156.06. Next, if the lower Bollinger band at 150.07 fails to dismiss a deeper decline from evolving, the bears could then retest the support base of 148.51-149.41. In the event downward forces steer the pair below the 148.45 trough, a neighbouring support border of 147.39-148.10 could deny sellers the chance to gain the upper hand.
Summarizing, GBPJPY is exhibiting a neutral tone in the near-term. A break below the 200-day SMA could shift the bias to bearish, while a push above the 154.00 mark could fuel optimism in the pair.
GBPUSD Bearish Bias
Technical analysis
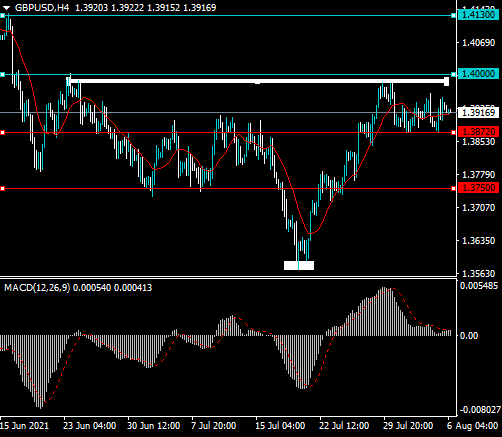
The four-hour time frame shows that the GBPUSD pair has formed a large inverted head and shoulders pattern, although a final drop may need to happen to complete the structure of the pattern.
The MACD indicator on the four-hour time frame is starting to trend lower and is looking increasingly bearish.
What the possible outcomes are
In our most likely scenario, the GBPUSD pair will eventually drop towards the 1.3750 level and then recover back towards the 1.4000 resistance level.
Alternatively, the GBPUSD pair will start to rally towards the 1.4000 resistance level and then correct back towards the 1.3750 support level.
Key levels
Support 1.3872 1.3750
Resistance 1.4000 1.4130
EURUSD Bullish Bias
Technical analysis
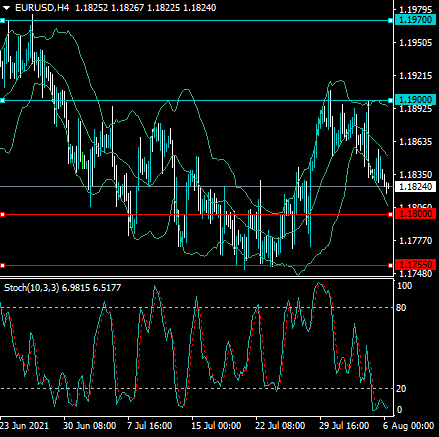
The EURUSD pair has formed a notable inverted head and shoulders price pattern on the four-hour time frame, with an upside target of nearly 150 points.
The Stochastic indicator on the four-hour time frame is approaching overbought territory so a price rebound in the EURUSD pair could happen at anytime.
What the possible outcomes are
In our most likely scenario, the EURUSD pair will start to rally towards the 1.1970 level after breaking past the 1.1900 resistance area.
Alternatively, the EURUSD pair corrects one final time back towards the 1.1770 support level and then starts to rally towards the 1.1900 resistance level.
Key levels
Support 1.1800 1.1770
Resistance 1.1900 1.1970
Gold Supported Prior To NFP
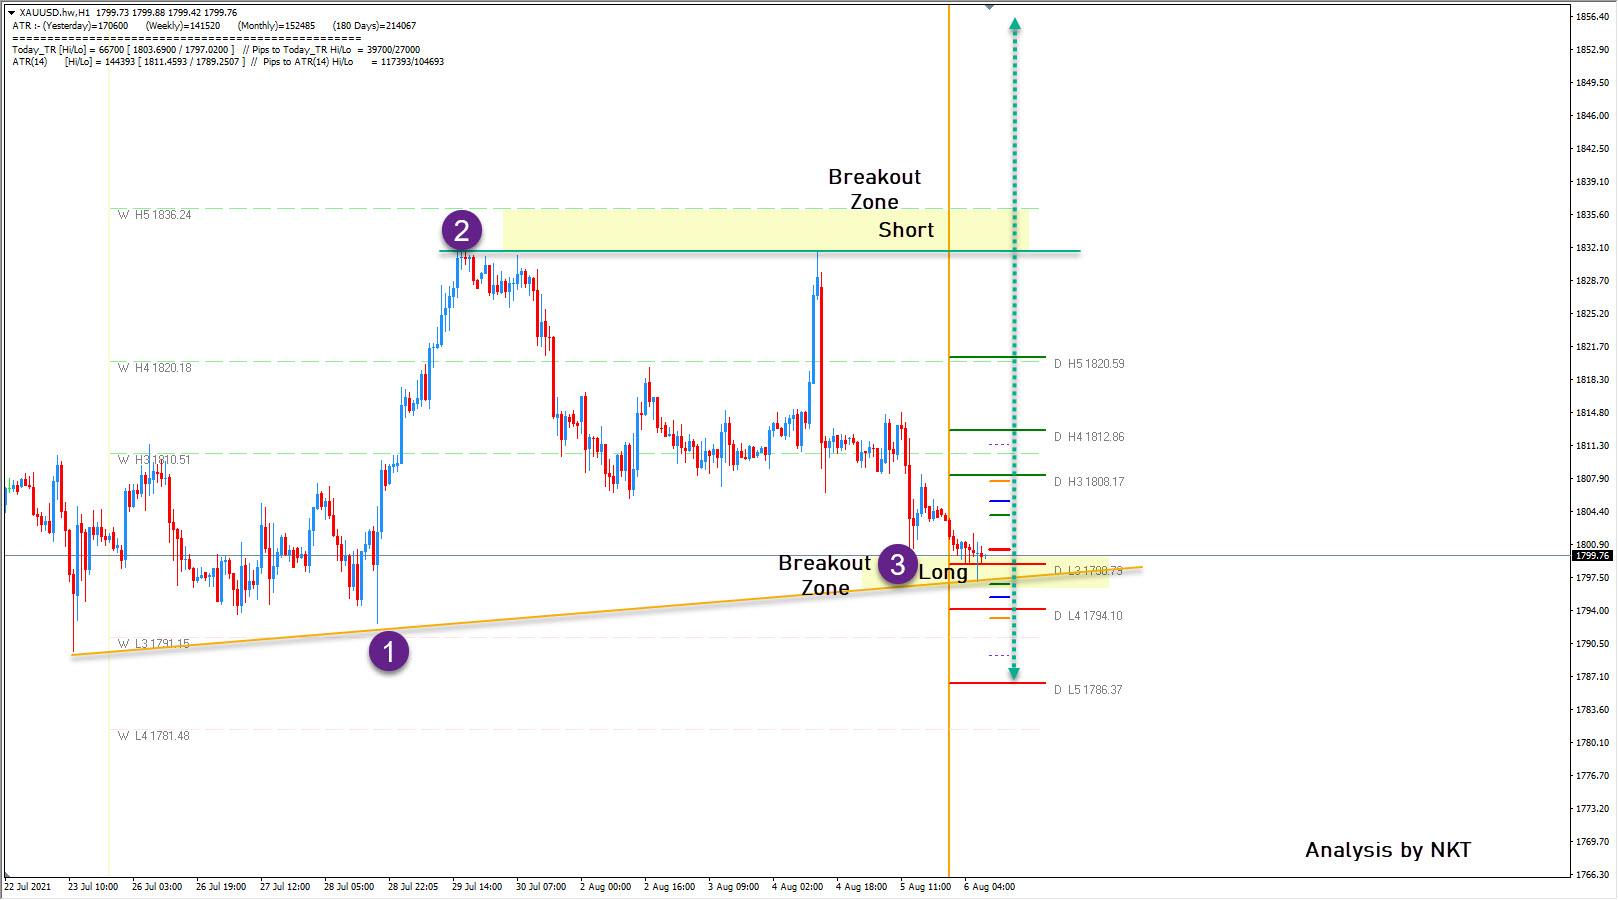
Gold made a small breakout yesterday, but it is supported prior to the NFP. We might see a move up before the NFP.
The main even the Nonfarm Payrolls will determine the move in gold. However, we might expect a small move to the upside prior to the news. After the NFP, we could see the following scenarios:
- Move up from the 1799 zone towards 1812 and if it breaks 1830.
- 1830 holds and we have a sell trade there.
- 1830 breaks and 1855 is next.
- 1795 breaks and the price goes lower to 1786.
- 1786 breaks and 1765 is retested.
Watch for the full NPF report and trade GOLD.
The Analytical Overview Of The Main Currency Pairs
The EUR/USD currency pair
Technical indicators of the currency pair:
Prev Open: 1.1836
Prev Close: 1.1831
% chg. over the last day: -0.04%
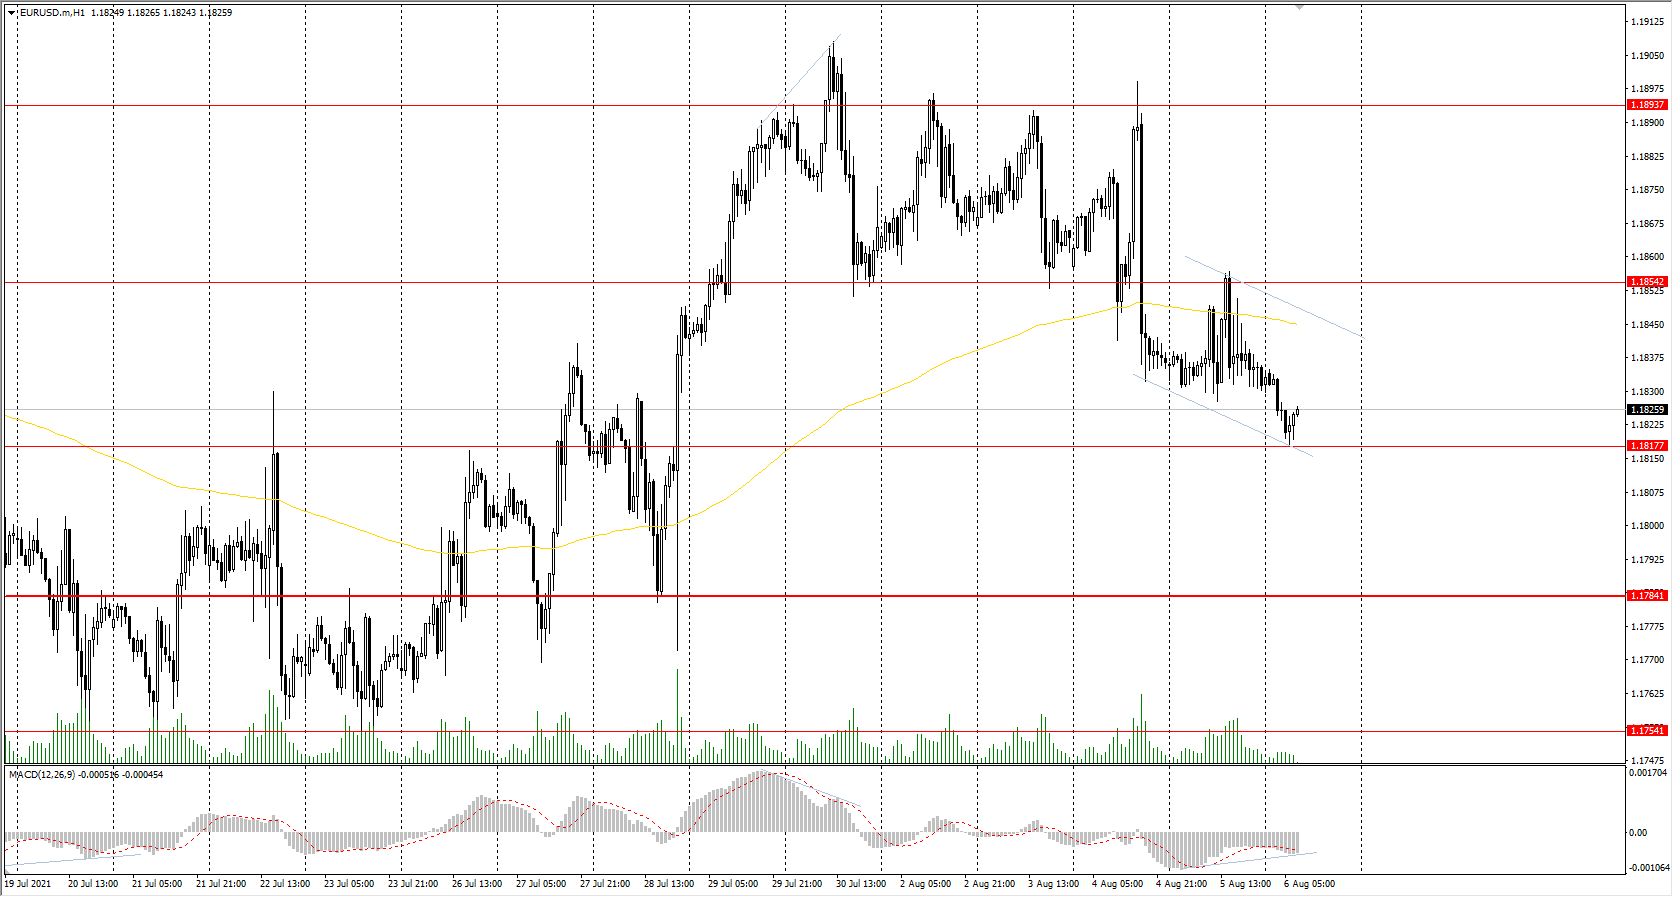
The EUR/USD currency pair is slowly correcting to the support level. In recent weeks, the ECB has started to consider the issue towards the cutting of stimulus measures in Europe as high vaccination rates help businesses to recover. But some government groups call on not to rush to cut the aid because of the global spread of the Delta strain. In France, there is a sharp increase in the number of new coronavirus strain cases.
Trading recommendations
Support levels: 1.1817, 1.1784, 1.1754, 1.1609
Resistance levels: 1.1854, 1.1894, 1.1934, 1.1969
From a technical point of view, the general trend of the EUR/USD currency pair remains bullish. The price fell below the moving average; the MACD indicator is in the negative zone, but there are signs of divergence. Under such market conditions, it’s better to consider intraday trading. Buy positions should be considered from the nearest support levels. Sell deals should be considered from the resistance levels, but only throughout the day and with short targets.
Alternative scenario: if the price breaks through the 1.1784 support level and fixes below, the mid-term uptrend is likely to be broken.
News feed for 2021.08.06:
- US Nonfarm Payrolls (m/m) at 15:30 (GMT+3);
- US Unemployment Rate (m/m) at 15:30 (GMT+3).
The GBP/USD currency pair
Technical indicators of the currency pair:
Prev Open: 1.3886
Prev Close: 1.3928
% chg. over the last day: +0.30%
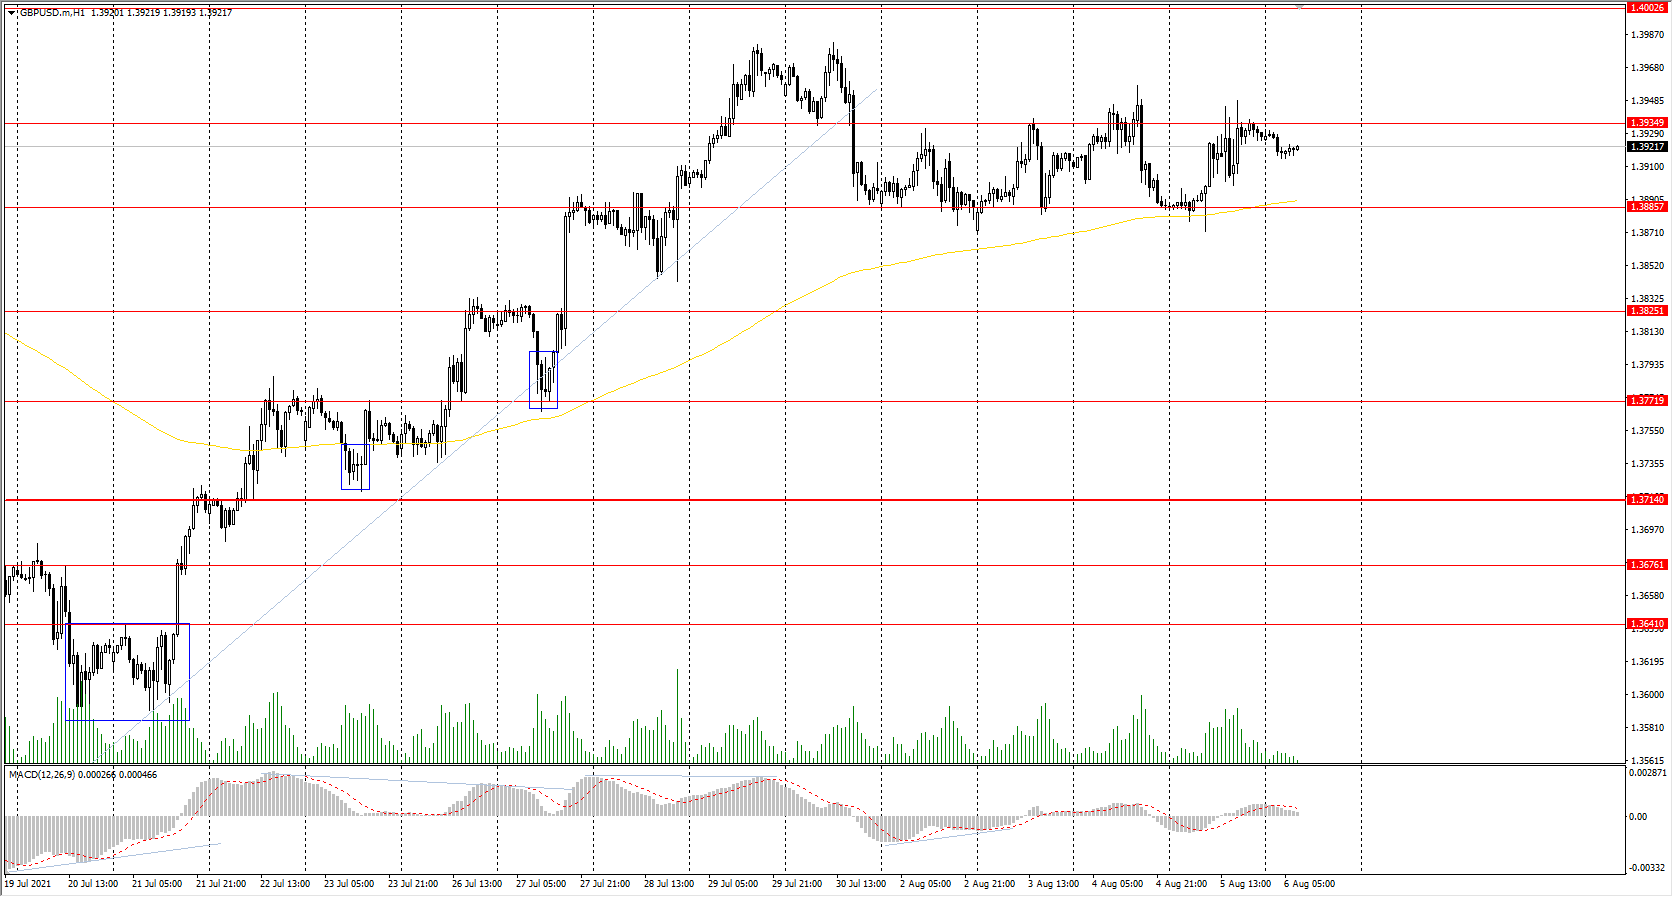
Unlike the euro, the British pound gained a more confident position. The Bank of England expectedly kept interest rates unchanged but indicated that some moderate tightening of monetary policy is likely to be needed to keep inflation under control in the near term. The inflation forecast is 4% by the end of the year, but the period of high inflation will be temporary. The UK's recovery from the pandemic is accelerating at a rapid pace - most of the economy is open and businesses are reporting strong sales.
Trading recommendations
Support levels: 1.3886, 1.3825, 1.3772, 1.3714, 1.3676 ,1.3641, 1.3614, 1.3525
Resistance levels: 1.3935, 1.4002, 1.4075, 1.4101
On the hour timeframe, the trend of the GBP/USD currency pair is bullish. The MACD indicator has become inactive; the price is still inside of a corridor. Under such market conditions, traders are better to look for buy trades after the breakthrough of the 1.3935 resistance level. There are no optimal points for sell positions right now.
Alternative scenario: if the price breaks through the 1.3714 support level and consolidates below, the bearish scenario is likely to resume.
News feed for 2021.08.06:
- UK BoE MPC Member Broadbent’s Speech at 14:15 (GMT+3).
The USD/JPY currency pair
Technical indicators of the currency pair:
Prev Open: 109.48
Prev Close: 109.78
% chg. over the last day: +0.27%
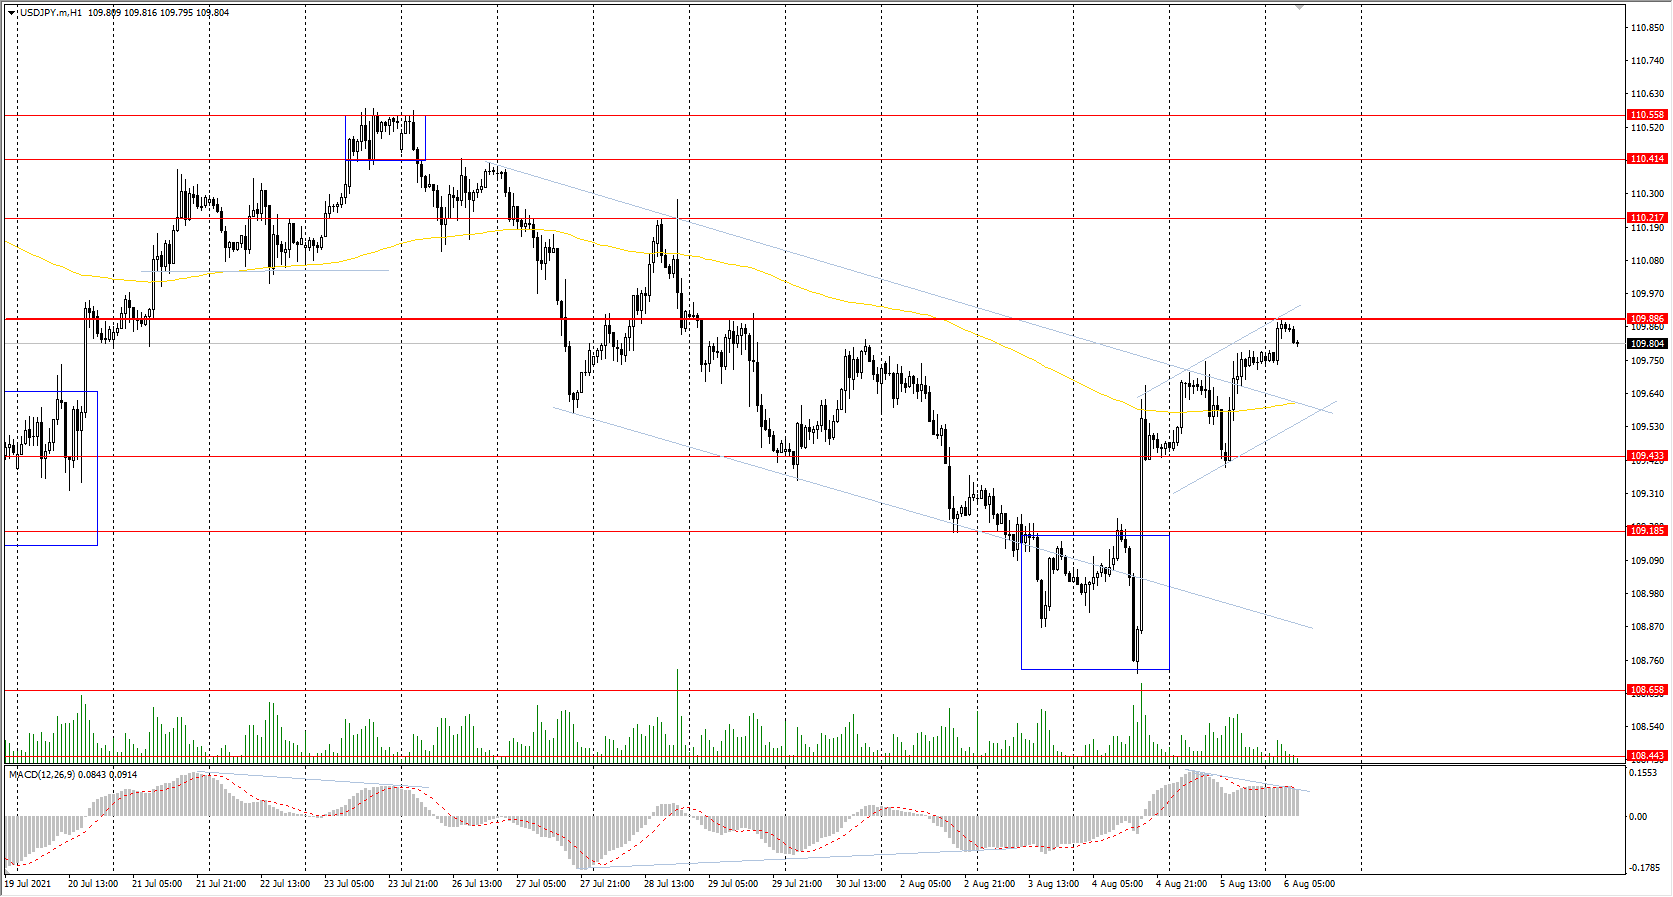
The Japanese yen is losing its positions. Japan's economy slightly recovered in the second quarter after a sharp decline at the beginning of the year, but economists believe that Japan will be in recession again in the third quarter and the economy will fail to keep pace with other developed countries, as the strengthening of restrictions, as well as the Olympics without spectators, will cause significant financial damage to businesses and production.
Trading recommendations
Support levels: 109.43,109.19, 108.65
Resistance levels: 109.88, 110.22, 110.41, 110.56
The main trend of the USD/JPY currency pair is bearish. But the price has reached the priority change level. The MACD indicator is in the positive zone, but there are signs of divergence. Under such market conditions, it is better for traders to look for sell positions from the priority change level. Buy trades should be considered only after the price pulls back to the buyers' initiative zone or to the support levels.
Alternative scenario: if the price rises above 109.88, the uptrend is likely to be resumed.
The USD/CAD currency pair
Technical indicators of the currency pair:
Prev Open: 1.2534
Prev Close: 1.2500
% chg. over the last day: -0.27%
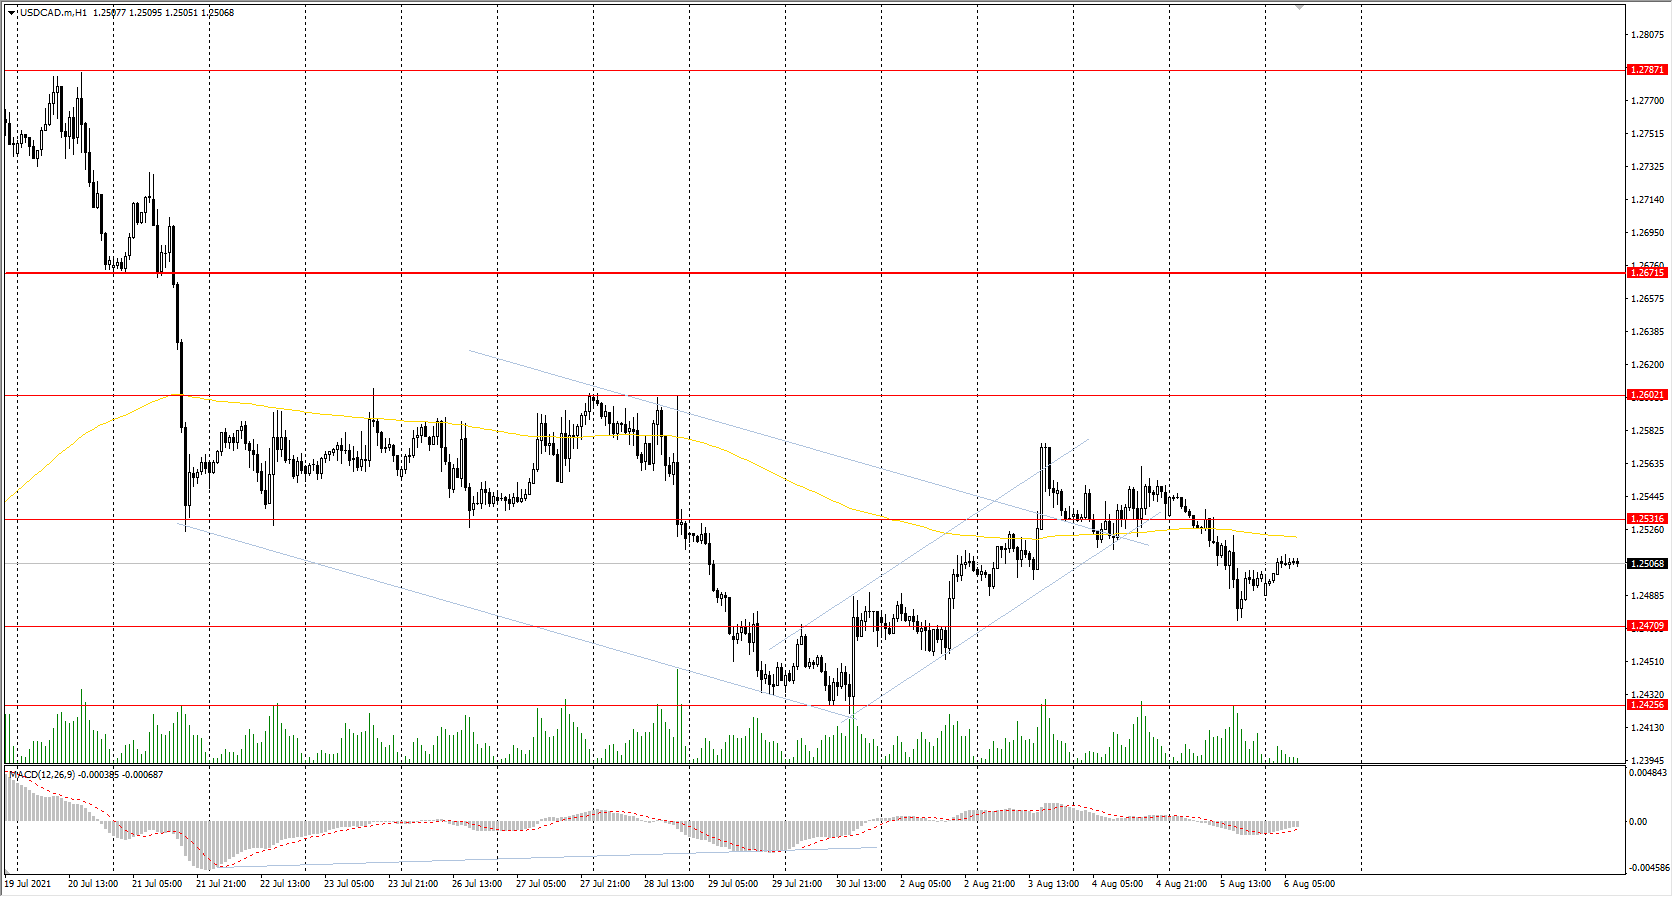
The Canadian dollar is highly dependent on the dollar index and the oil price dynamics. The dollar index did not change much yesterday, while oil price slightly increased, which caused the strengthening of the Canadian dollar and the decline of the USD/CAD currency pair. Analysts expect fuel prices to rise in the nearest future, which will play in favor of a stronger Canadian dollar. Today, Canada will report on the state of the labor market.
Trading recommendations
Support levels: 1.2471, 1.2425, 1.2370, 1.2312
Resistance levels: 1.2531, 1.2602, 1.2671, 1.2787, 1,2951
Considering technical analysis, the USD/CAD trend is bearish. The MACD indicator is inactive. Under such market conditions, traders should look for sell positions from the resistance levels after sellers show initiative. Only intraday time frames should be considered for opening buy positions.
Alternative scenario: if the price breaks through the 1.2671 resistance level and fixes above, the uptrend is likely to be resumed.
News feed for 2021.08.06:
- Canada Unemployment Rate (m/m) at 15:30 (GMT+3);
- Canada Ivey PMI (m/m) at 17:00 (GMT+3).
All About Nonfarm Payrolls
- US employment report today crucial for dollar and stocks
- Sterling gains altitude as BoE strikes a more cheerful tone
- Gold hammered, Wall Street celebrates new records
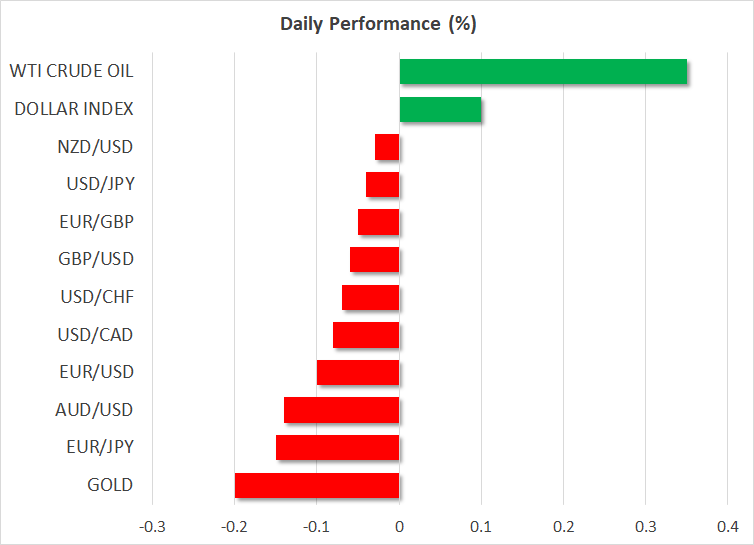
Dollar braces for nonfarm payrolls
The stakes are sky-high going into this US employment report. Fed officials have made it crystal clear that the most important element for the normalization of monetary policy is the labor market. Hence, the upcoming data could determine whether a September taper announcement is realistic or premature.
Nonfarm payrolls are forecast to clock in at 870k in July, pushing the unemployment rate down two clicks to 5.7%. That said, there is tremendous uncertainty around these forecasts. The most optimistic analyst sees payrolls at 1.6 million, while the most pessimistic one anticipates only 350k.
It’s really a guessing game, especially since the labor market tea leaves for the month were mixed. Arguing for a strong report were the ISM business surveys, both of which showed employment gains firing up. However, the ADP jobs report was disappointing and jobless claims rose during the NFP survey week, pointing to some weakness.
The market reaction will depend on the magnitude of any surprise. Anything above 1.3 million for nonfarm payrolls could fuel bets for an earlier withdrawal of Fed stimulus, turbocharging the dollar but hitting stocks. On the flipside, a figure below 500k might sink the dollar and lift equities. Something in-between is unlikely to rattle markets much.
Bear in mind that the S&P 500 has closed higher after every single employment report this year. Bad news for the economy is good news for stocks as investors price in more Fed liquidity for longer, while good jobs news is great for corporate bottom lines. All news is good news for stocks essentially. For equities to bleed, it would probably take an incredible jobs report that sparks panic about the Fed tapering immediately.
BoE outlines normalization plans
The Bank of England kept policy unchanged yesterday but there were some fireworks. Only one member voted to end quantitative easing right away, which sent the pound a little lower on the decision. Markets expected two dissenters.
However, the overall rhetoric was quite hawkish, so the pound soon recovered to trade higher overall. The Bank signaled that some monetary tightening will likely be needed if the economy continues to recover well, while the latest economic forecasts saw inflation hitting 4% this year.
But the most crucial part was around asset purchases. Once the Bank Rate hits 0.5%, the Bank will stop reinvesting bonds that mature on its balance sheet, essentially draining liquidity out of the sterling market. This means that after two rate increases, the BoE will begin ‘quantitative tightening’ like the Fed did back in 2017-2019, which is great news for the pound in the longer term.
Stocks climb, gold struggles, Canadian jobs eyed
The party on Wall Street continues to rage, with both the S&P 500 and the Nasdaq closing at new record highs yesterday. The earnings season has been spectacular so far, reflecting the strength of the recovery. Looking ahead, the next major catalyst for equities is the $3.5 trillion reconciliation package that is currently being brewed in the Senate.
Meanwhile, gold took a hit yesterday and remains under pressure early on Friday, suffering at the hands of a firmer US dollar and a recovery in real Treasury yields. A break either below $1790 or above $1835 is needed for bullion to escape its trading range.
Finally, Canadian employment data will also be released today. Expectations are for another solid report, which could vindicate the Bank of Canada’s decision to keep trimming its asset purchases.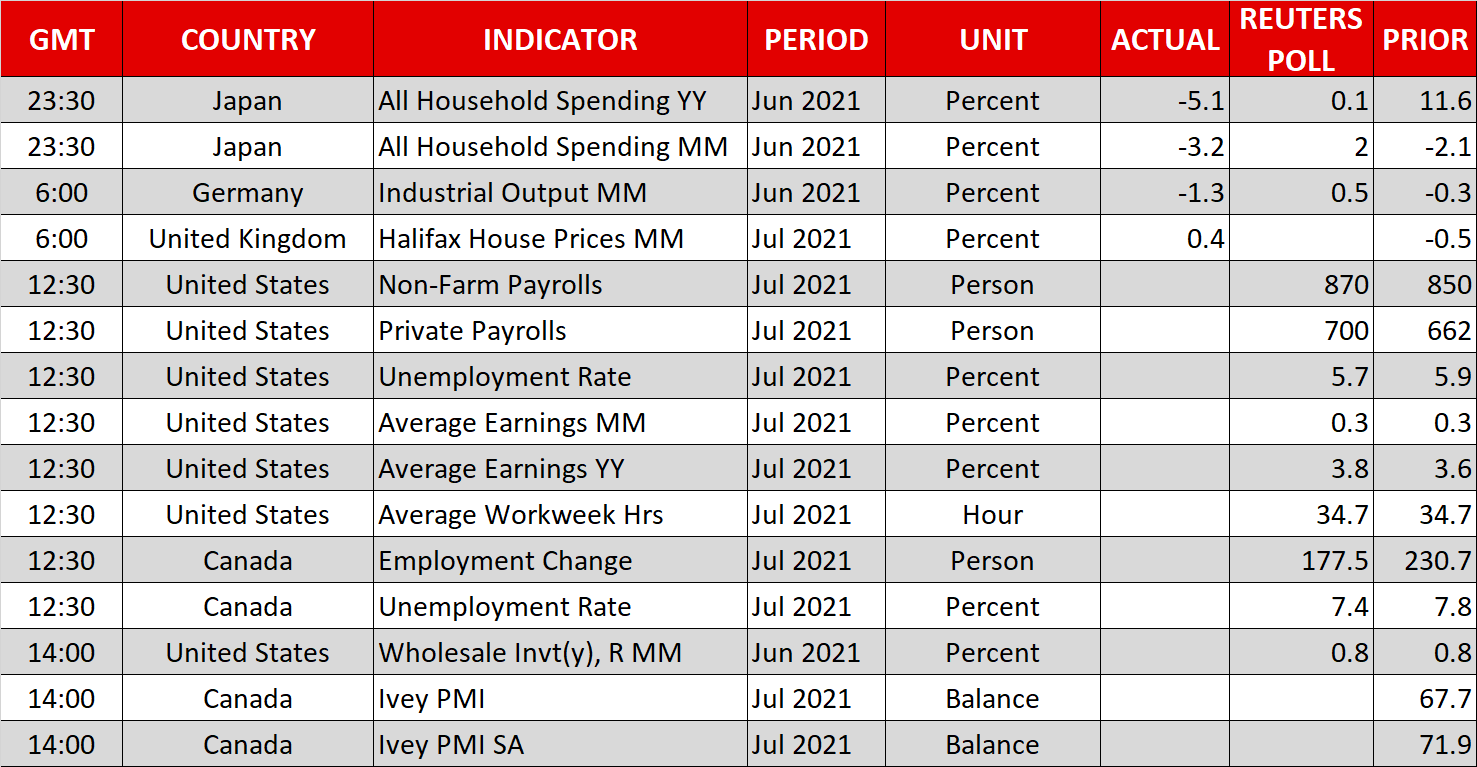
Analysts Evaluate US Labor Market Data And Financial Statements Of Major Companies
Initial jobless claims in the US decreased by 14,000 to 385,000. The number of layoffs fell to its lowest level in more than 21 years. It indicates that companies are holding on to their workers by any possible means amid a labor shortage. Today, the investors' attention will be focused on the Nonfarm Payrolls data and the unemployment rate in the USA. The good labor data might raise concerns that the Fed will start cutting its QE program soon. Negative labor market data will cause questions about the economic recovery but will add confidence that the soft monetary policy will remain unchanged. The S&P 500 and Nasdaq indices closed at record highs on Thursday as optimism over strong corporate reporting, as well as progress on the infrastructure bill and expectations for a strong monthly jobs report on Friday, supported investor sentiment. 340 companies in the S&P 500 index have already reported for the past quarter. 87.6% improved their earnings estimates. The White House considers the option to oblige foreigners to vaccinate from COVID-19 before traveling to the United States.
European stock indices mostly increased on Thursday. Germany's DAX added 0.33%, France's CAC 40 jumped by 0.52%, but the British FTSE 100 decreased by 0.05%. The Bank of England expectedly kept interest rates unchanged but indicated that some moderate tightening of monetary policy would likely take place shortly to keep inflation under control. The Bank's inflation forecast is 4% by the end of the year, but the period of high inflation will be temporary. Economists expect the first UK interest rate hike next year, which means the Bank of England will begin to normalize monetary policy faster than the European Central Bank and the US Federal Reserve.
Oil prices increased by more than 1% yesterday. The situation in the oil market remains uncertain. On the one hand, OPEC+ countries are increasing oil production now to meet demand. On the other hand, the spread of the Delta strain is putting pressure on oil price growth. The third factor is tensions in the Middle East, which contributes to the increase in fuel prices. Analysts believe that oil will strive for $85 per barrel shortly.
Good macroeconomic data supports the dollar index, which leads to growth of US Treasury bond yields and a drop in prices of gold and other precious metals (inverse correlation). But fundamentally, soft monetary policy always contributes to the rise in prices for precious metals.
Asian stock indices are traded without a single dynamics and can't follow the rising US indices. Only Japan's Nikkei index increased by 0.11% due to the growth in shares of such companies as Fujikura (+15.6%), Nikon Corp. (+8.9%), and Konami Holdings Corp. (+7.4%). The spread of Delta continues to strengthen concerns about a rapid economic recovery in Asia. Thailand, Malaysia, and Australia (Sydney) reported record daily cases of the disease on Thursday. China is imposing new travel and movement restrictions across the country, including in Beijing, as the outbreak caused by Delta has grown to more than 500 cases within the past 2 weeks. It should be noted that 61% of China's adult population is vaccinated.
Main market quotes:
- S&P 500 (F) 4,429.10 +26.44 (+0.60%)
- Dow Jones 35,064.25 +271.58 (+0.78%)
- DAX 15,744.67 +52.54 (+0.33%)
- FTSE 100 7,120.43 -3.43 (-0.05%)
- USD Index 92.27 0.00 (0.00%)
Important events for today:
- Australia RBA Governor Philip Lowe’s Speech at 02:00 (GMT+3);
- Australia RBA Monetary Policy Statement (m/m) at 04:30 (GMT+3);
- UK BoE MPC Member Broadbent’s Speech at 14:15 (GMT+3);
- US Nonfarm Payrolls (m/m) at 15:30 (GMT+3);
- US Unemployment Rate (m/m) at 15:30 (GMT+3);
- Canada Unemployment Rate (m/m) at 15:30 (GMT+3);
- Canada Ivey PMI (m/m) at 17:00 (GMT+3).
US Job Growth Will Give The Dollar A New Flourishing
For markets, today is employment day. The US publishes its monthly jobs growth estimate. This indicator could regain its lost glory this month as the economic indicator that provokes the most volatility in the markets. Strong data this time will confirm an imminent tightening of the Fed's monetary policy, then risk triggering a significant reassessment of the value and prospects on the financial markets.
Average forecasts suggest employment growth for July near 900k against 850k a month earlier and a drop in the unemployment rate to 5.7% from 5.9%. Such an increase would be the largest since last August due to a return to the old normal.
The degree of uncertainty rose this week due to conflicting labour market signals from other indicators. The ADP estimated private-sector employment growth of only 330K for July, putting the entire economy at over 400k new jobs.
However, such weak estimates didn't get confirmation by other indicators. The Non-manufacturing ISM rose to 64.1 last month, the highest reading in the index's history since 2008. Not least of all, the increase in the index was attributable to employment.
The weekly jobless claims performed well. Their dynamics we consider as the closest to the official monthly employment figures. Initial claims fell to 385K following a jump in the previous two weeks, and the number of continued claims fell by 366K over the week to 2.93 million - a new low since the pandemic's start. There has been an acceleration in the recovery, rather than a plateau as in previous months.
The service sector is speeding up the recovery. And that is good news as services represent up to 80% of the US GDP.
The big question for the markets is whether these changes are positive. We can expect relatively calm markets if employment growth is in the 100-150k range to the forecast. This will spur speculation that the Fed will reduce the monthly volume of asset purchases on its balance sheet someday before the end of the year.
If the job growth is much greater than 1 million, the reaction of the world and especially the US markets could be much more chaotic. The expectation is that tapering will start in September will become mainstream, which will lead to a boost in the Dollar and an increase in medium-term interest rates. And this promises to be the trigger for a correction in the stock markets.
For the Dollar, it will be a new high. It could not only return to growth and break the resistance of its sideways range, but it could launch a powerful multi-month rally, sweeping away the weakest competitors, starting with emerging market currencies and many commodities.