Sample Category Title
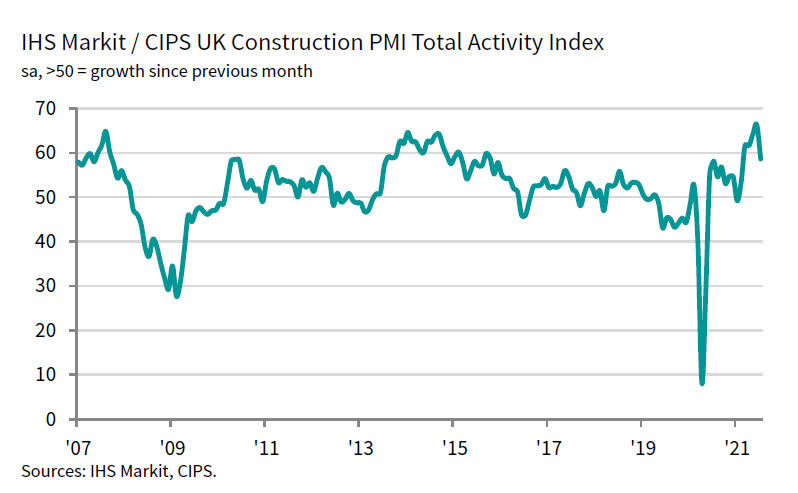
UK PMI construction dropped to 58.7, widespread supply shortages and constrained capacity
UK PMI Construction dropped to 58.7 in July, down sharply from June's 24-year high of 66.3. House building remained best-performing category. Supply shortages led to another rapid rise in input prices.
Tim Moore, Economics Director at IHS Markit:
"July data marked the first real slowdown in the construction recovery since the lockdown at the start of this year. It was unsurprising that UK construction companies were unable to maintain output growth at the 24-year high seen in June, especially with widespread supply shortages and constrained capacity to take on additional orders...
"Long lead times for materials and shrinking sub-contractor availability were cited as factors holding back work on site... Another rapid increase in purchasing costs was linked to global supply and demand imbalances, but many firms also noted that local issues had amplified inflationary pressures. These included a severe lack of haulage availability, continued reports of Brexit trade frictions, and greater shortages of contractors due to exceptionally strong demand."
Gold Converging At The Vortex Of The Triangle
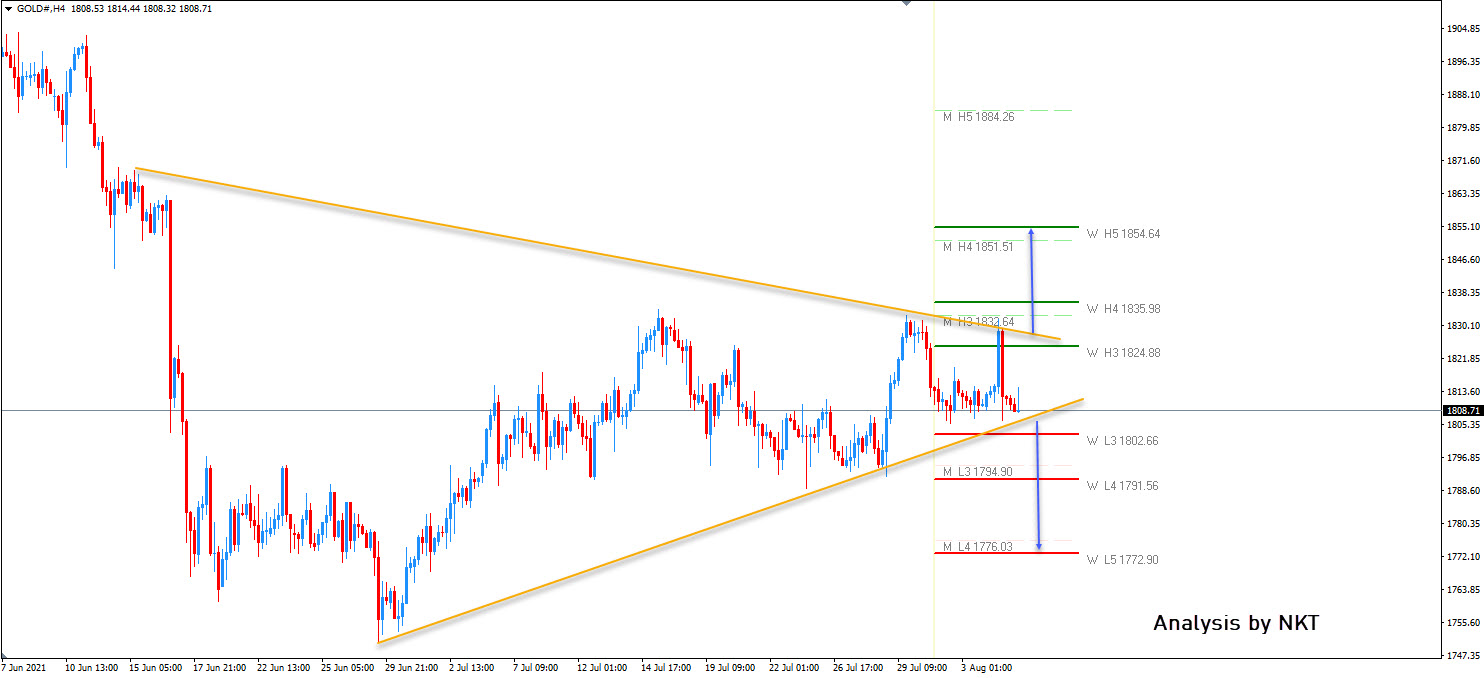
Gold is converging at the top of the vortex pinnacle. We could see a move after a breakout.
1825 is the long breakout point for GOLD. If we see a move up, 1835 and 1854 are targets. If the price breaks below 1800 we should see 1790 and 1772. Today is the BOE decision, tomorrow is the NFP. Be careful about the risk you place. Watch for a GOLD breakout during the volatility period.
Investors Still Focus On The Quarterly Earnings Season In Europe And The United States, As Well As The Covid-19...
The US stock market declined yesterday but closed the day without a single trend. The fall was observed in almost all sectors of the economy. Only some industries stayed in the green zone (semiconductor and software companies). Oil & gas, healthcare, industrials, and consumer cyclical sectors showed the biggest declines. At the end of the day, the S&P 500 index decreased by 0.46%, the Dow Jones index lost 0.92%, while the Nasdaq index added 0.13%. The leaders of the decline among S&P 500 components were General Motors stock (-8.95%) and Lumen Technologies stock (-8.86%). Shares of Robinhood Markets jumped by 50.4% as interest from the famous Kathy Wood fund, and the popularity of the service set investors and traders up to buy. Because of the growing spread of the COVID-19 Delta strain, traders and investors are also actively buying Moderna and Pfizer stocks.
Meanwhile, the dollar index jumped yesterday due to the Fed's hint of an early cutting of the QE program. A lot will depend on Friday's non-farm payrolls data. ADP private sector employment change was 330,000 in July. It’s below expectations but still an improvement for the labor market.
European stock markets increased by the end of the day, confirming that there is no unified correlation between the US and European indices for now. The British FTSE 100 increased by 0.3%, the German DAX increased by 0.9%, and the French CAC 40 added 0.3%. The Eurozone Services PMI Index was revised lower yesterday. In general, the dynamics of economic growth in Europe are maintained, but there is a slight slowdown. In Germany, 10-year bond yields fell to -0.51%, the lowest level since early February. Today the Bank of England will report on its interest rate and further plans on monetary policy. According to economists, the Bank of England will not change the main parameters of its monetary policy despite some appeals to tighten it.
According to the US Energy Information Administration (EIA), crude oil inventories unexpectedly increased by 3.6 million barrels last week. The situation in the oil market is becoming uncertain now. On the one hand, OPEC+ countries are increasing oil production now. On the other hand, the spread of Delta strain is putting pressure on oil price growth. The growing tension between Iran and world leader countries over the drone attacks on oil tankers has also added to the uncertainty. Iran denies any involvement. But global banks still expect oil prices to rise to $85 per barrel by the fourth quarter since the oil demand is strongly ahead of the growth of supply.
Asian stock indices were mostly higher yesterday. The broadest index of Asia-Pacific stocks outside of Japan, the MSCI, increased by 0.22%, and Japan's Nikkei added 0.32%. Australia's index added 0.18%, while China's blue-chip CSI 300 decreased by 0.28%, and Hong Kong's index fell by 0.45%. In China, mass testing of the population continues after the spread of the Delta strain made many businesses close and also forced Beijing to close routes to 20 provinces in China. New Zealand's unemployment rate fell to its lowest level in a year (4%), the number of unemployed decreased by 12.4%, the largest quarterly decline since the first survey in 1986.
Main market quotes:
- S&P 500 (F) 4,402.66 -20.49 (-0.46%)
- Dow Jones 34,792.67 -323.73 (-0.92%)
- DAX 15,692.13 +137.05 (+0.88%)
- FTSE 100 7,123.86 +18.14 (+0.26%)
- USD Index 92.28 +0.19 (+0.21%)
Important events for today:
- UK Construction PMI (m/m) at 11:30 (GMT+3);
- UK BoE Interest Rate Decision (m/m) at 14:00 (GMT+3);
- UK BoE Monetary Policy Report at 14:00 (GMT+3);
- US Initial Jobless Claims at 15:30 (GMT+3);
- US Natural Gas Storage (w/w) at 17:30 (GMT+3).
Dollar Shines After Clarida, BoE In The Spotlight
- Dollar climbs as Clarida beats the rate hike drums, ISM hits record
- Bank of England meets today, sterling reaction hangs on QE votes
- Meme stocks return, gold takes a rollercoaster ride, oil slides
Fed vice chief talks rate hikes
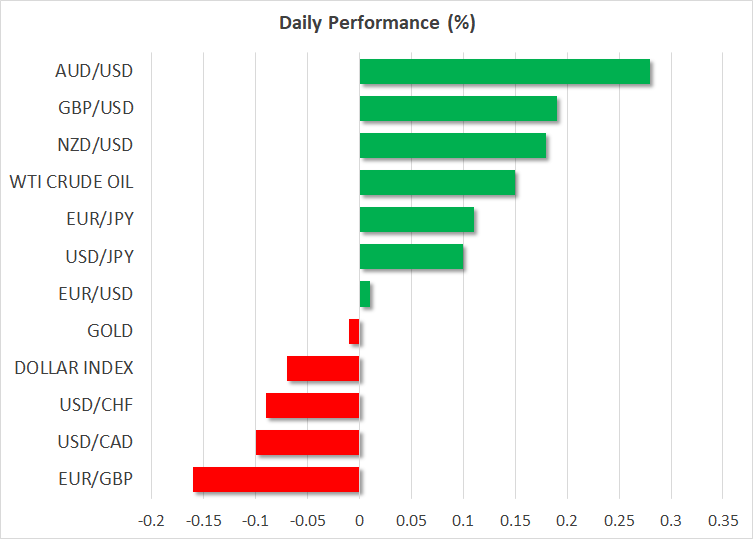
It was a wild session in financial markets. The dollar took a hit early on after the ADP jobs report disappointed, only to stage a massive comeback after the Fed's vice chief talked about rate increases and the ISM services survey hit a new record high.
The Fed's second in command - Richard Clarida - said that the conditions for raising interest rates could be met by late 2022. He also stressed that the economy has made progress towards the goals required for tapering asset purchases, foreshadowing a potential announcement in the coming months.
Make no mistake, Clarida's views are tremendously important. He is both a member of the Fed's inner core and a true centrist, so when he throws his weight behind something, that is typically the consensus view within the FOMC. Indeed, the San Francisco Fed president soon echoed his remarks.
As for the dollar, this is great news. The Fed is slowly but surely setting the stage for dialing back stimulus. For now, everything hangs on tomorrow's nonfarm payrolls. The labor market needs to come back in spectacular fashion for the Fed to take the next step soon.
But in the bigger picture, it doesn't really matter whether tapering is announced in September or December. What matters is that the Fed is years ahead of the ECB and the BoJ in the normalization game. Ultimately, this argues for a stronger dollar against the euro and the yen. That said, for real US yields to recover from depressed levels and the dollar to shine, actual tapering might be needed, not just talk.
BoE neutral, with a touch of optimism
The main event today will be the Bank of England decision. The UK economy is humming along nicely and a couple of BoE officials have recently called for withdrawing some stimulus, but it is probably too early for that.
Most policymakers don't share this view. They believe that withdrawing stimulus too early would be an even bigger risk as it could hamstring the recovery, especially now that the government is also phasing out its jobs programs.
The reaction in sterling today will depend on the votes around QE and the updated economic forecasts. The most likely conclusion is a 6-2 split vote, where most members favor keeping their asset purchase program intact but Saunders and Ramsden dissent, calling for an immediate end.
Coupled with some rosy macroeconomic forecasts, that might be enough to lift the pound. When two members vote for an immediate withdrawal of stimulus, it shows which way the wind is blowing. Otherwise, if the vote is 7-1, the pound could slide.
Meme stocks, gold, and oil
Meanwhile, the meme stock madness has returned for another round. This time it was Robinhood, whose stock soared 50% yesterday. This was the first day when options on the stock traded. Massively skewed towards calls. Just another reminder that options drive stock markets these days.
In the commodity sphere, gold went for a rollercoaster ride. Bullion soared initially as the ADP report disappointed and the dollar got hammered, before surrendering those gains once Clarida spoke. The fundamental picture doesn't seem attractive with the Fed preparing to take its foot off the accelerator, something also endorsed by the chart, which is ready to post a ‘death cross'.
Finally, oil prices took another beating yesterday after a surprising build in US crude inventories compounded fears over a slowdown in demand, as the Delta variant threatens to kneecap consumption in developing economies.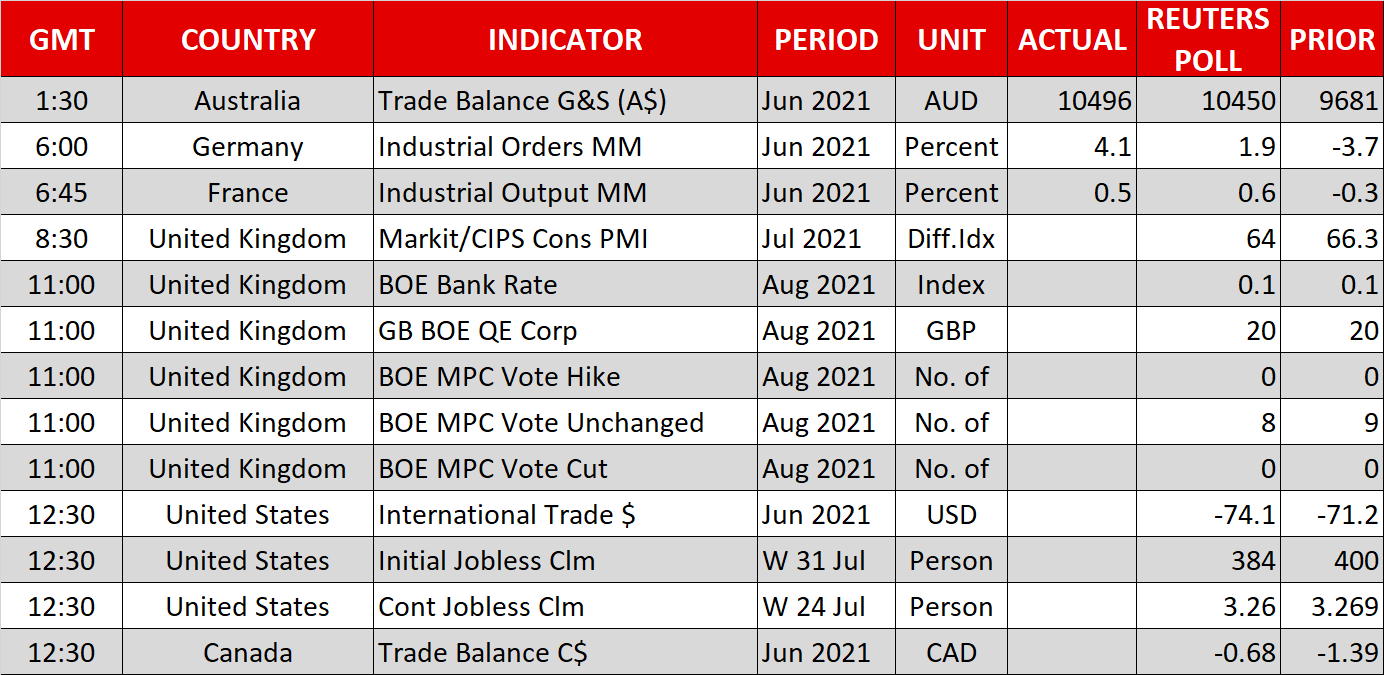
GBP/JPY Daily Outlook
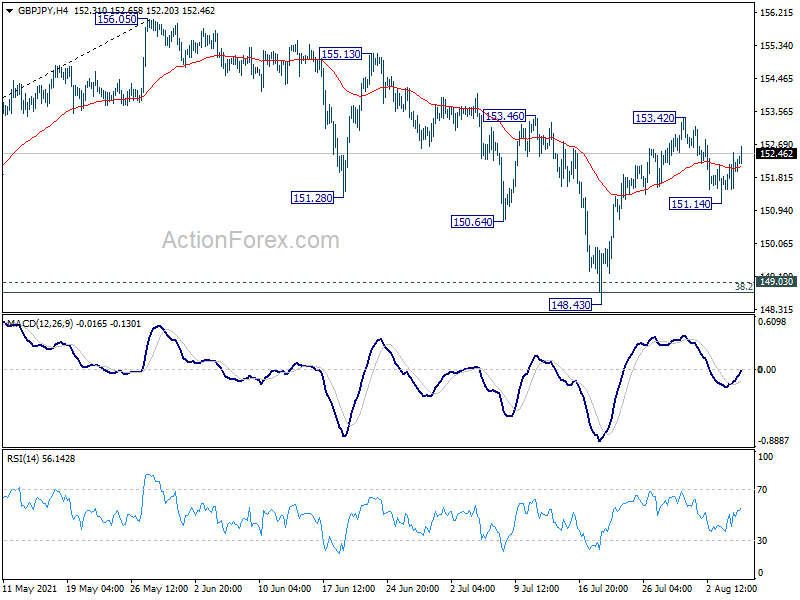
Daily Pivots: (S1) 151.56; (P) 152.04; (R1) 152.54; More...
Intraday bias in GBP/JPY remains neutral for the moment. On the downside, below 151.14 will bring deeper fall back to retest 148.43. On the upside, though, break of 153.42 resistance will resume the rebound from 148.43 to retest 156.05 high.
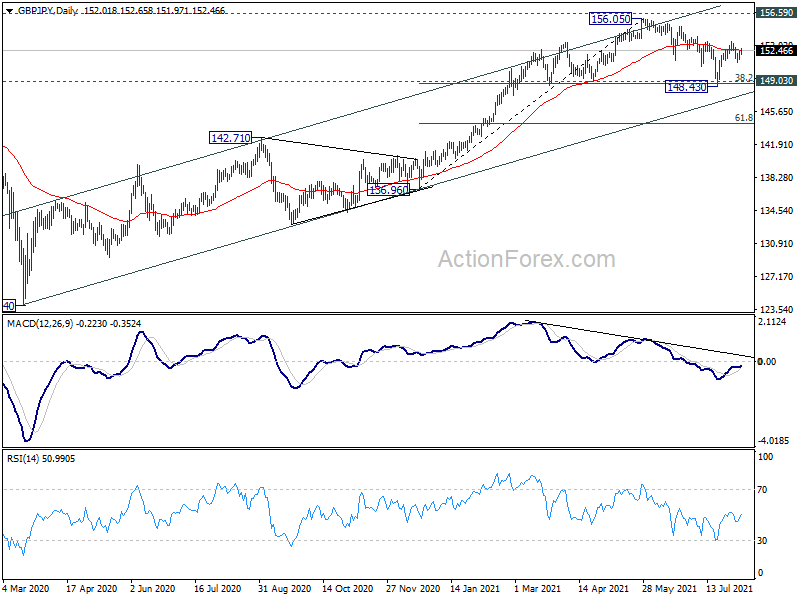
In the bigger picture, rise from 123.94 is seen as the third leg of the pattern from 122.75 (2016 low). Focus remains on 156.59 resistance (2018 high). Sustained break there should confirm long term bullish trend reversal. Next target is 61.8% retracement of 195.86 (2015 high) to 122.75 at 167.93. On the downside, sustained break of 149.03 support, however, will argue that rise from 123.94 has completed. Further break of 142.71 would open up the bearish case for retesting 122.75 low.
The Analytical Overview Of The Main Currency Pairs
The EUR/USD currency pair
Technical indicators of the currency pair:
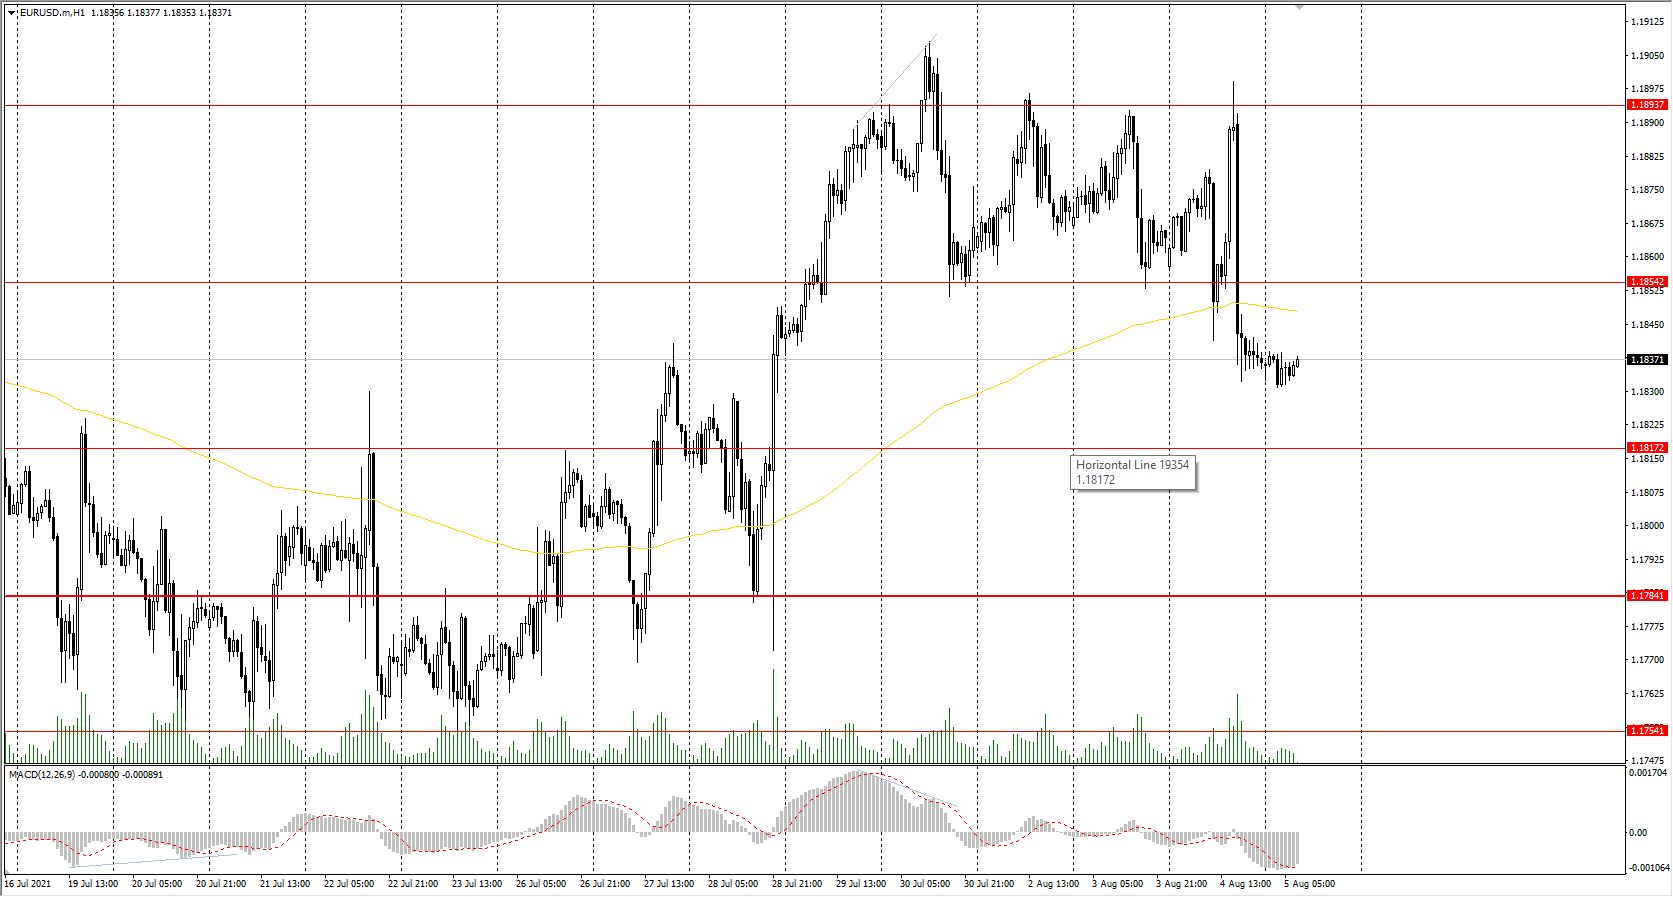
Prev Open: 1.1858
Prev Close: 1.1836
% chg. over the last day: -0.19%
The Eurozone Services PMI Index decreased yesterday. In general, the dynamics of economic growth in Europe is preserved, but there is a slight slowdown. In Germany, 10-year bond yields fell to -0.51% - the lowest level since early February. Negative government bond yields mean that investors are willing to pay for the opportunity to borrow their money. The fall in the yield of bonds, as a rule, negatively affects the national currency.
Trading recommendations
Support levels: 1.1817, 1.1784, 1.1754, 1.1609
Resistance levels: 1.1854, 1.1894, 1.1934, 1.1969
From a technical point of view, the general trend of the EUR/USD currency pair remains bullish. The price fell below the moving average; the MACD has moved into the oversold zone. Under such market conditions, it’s better to consider intraday trading. Buy positions should be considered from the nearest support levels. Sell deals should be considered from the resistance levels, but only throughout the day and with short targets.
Alternative scenario: if the price breaks through the 1.1784 support level and fixes below, the mid-term uptrend is likely to be broken.
News feed for 2021.08.05:
- US Initial Jobless Claims at 15:30 (GMT+3).
The GBP/USD currency pair
Technical indicators of the currency pair:
Prev Open: 1.3912
Prev Close: 1.3887
% chg. over the last day: -0.18%
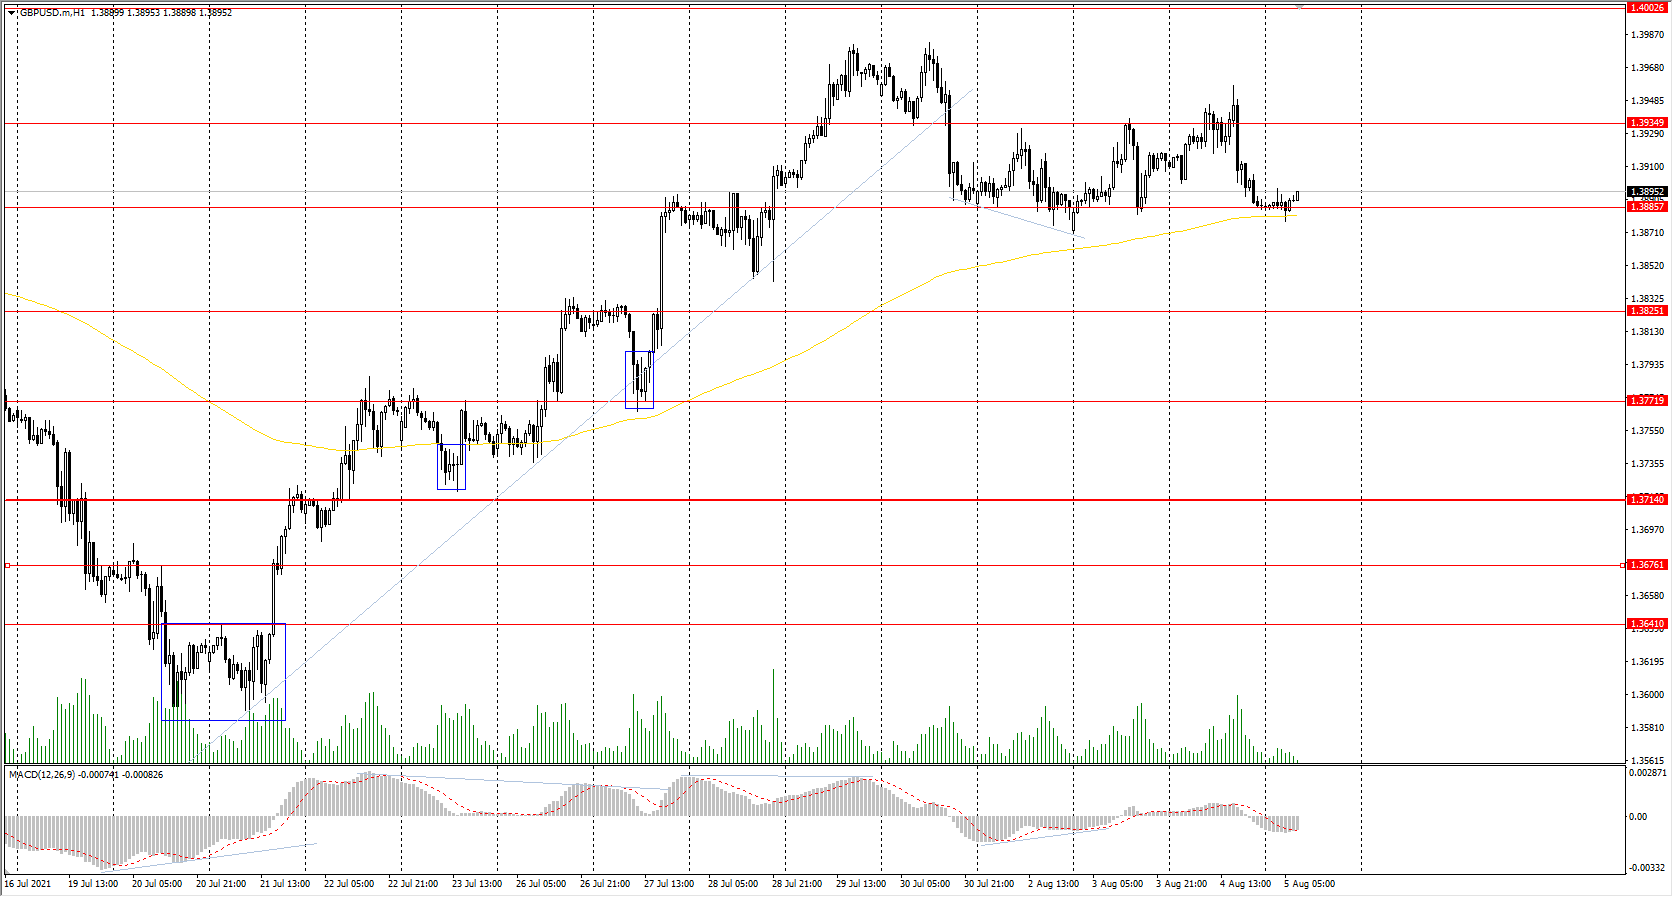
The GBP/USD currency pair decreased by 0.18% amid the decline of the dollar index. But unlike the euro, the British pound has gained a more confident position. Despite the decline, the price has not broken through the trading range. Today, the Bank of England will report about the interest rate and announce further plans regarding monetary policy. Economists do not expect any changes, but volatility on currency pairs with the pound will be high today.
Trading recommendations
Support levels: 1.3886, 1.3825, 1.3772, 1.3714, 1.3676 ,1.3641, 1.3614, 1.3525
Resistance levels: 1.3935, 1.4002, 1.4075, 1.4101
On the hour timeframe, the trend of the GBP/USD currency pair is bullish. The MACD indicator has become negative; the price is still inside of a corridor. Under such market conditions, traders are better to look for buy trades after buyers show initiative. There are no optimal points for sell positions right now.
Alternative scenario: if the price breaks through the 1.3714 support level and consolidates below, the bearish scenario is likely to resume.
News feed for 2021.08.05:
- UK Construction PMI (m/m) at 11:30 (GMT+3);
- UK BoE Interest Rate Decision (m/m) at 14:00 (GMT+3);
- UK BoE Monetary Policy Report at 14:00 (GMT+3).
The USD/JPY currency pair
Technical indicators of the currency pair:
Prev Open: 109.02
Prev Close: 109.48
% chg. over the last day: +0.42%
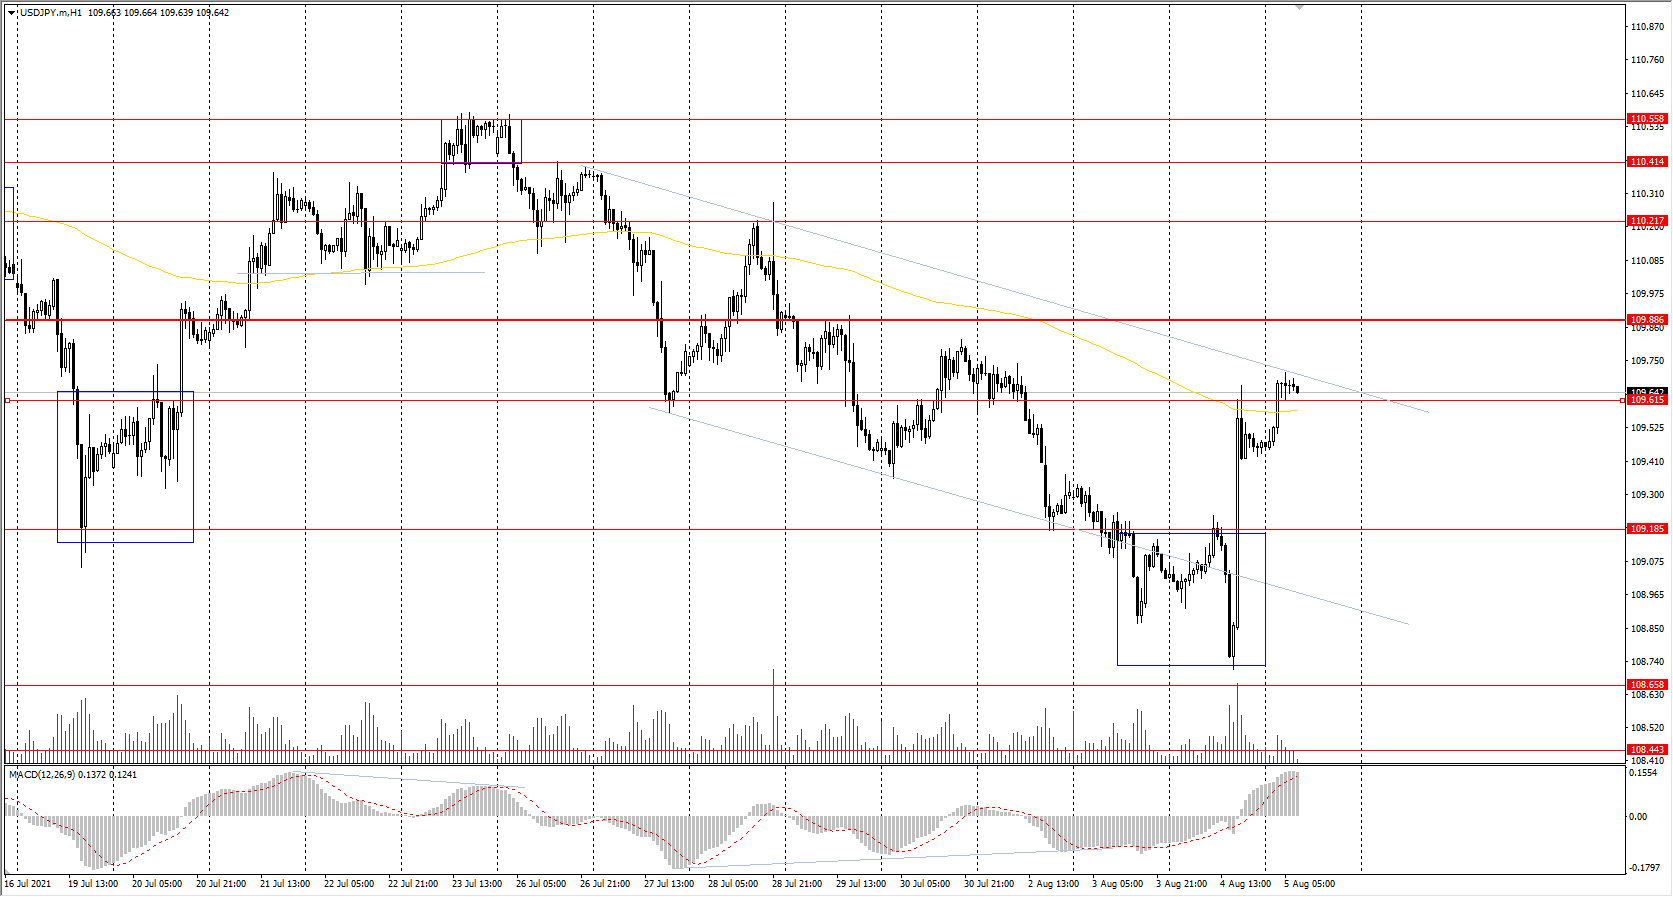
The USD/JPY currency pair, which strongly correlates with the dynamics of the US currency, sharply increased by 0.42% amid a rise in the dollar index. Japan's 10-year bond yields fell below zero this week for the first time since December. The fall in the yield of bonds, as a rule, negatively affects the national currency.
Trading recommendations
Support levels: 109.61,109.19, 108.65
Resistance levels: 109.88, 110.22, 110.41, 110.56
The main trend of the USD/JPY currency pair is bearish. The price is trading at the level of the moving average now. The MACD indicator has become positive. Under such market conditions, it is better for traders to look for sell positions from the resistance levels. Buy trades should be considered only after the price pulls back to the buyers' initiative zone.
Alternative scenario: if the price rises above 109.88, the uptrend is likely to be resumed.
The USD/CAD currency pair
Technical indicators of the currency pair:
Prev Open: 1.2533
Prev Close: 1.2541
% chg. over the last day: +0.06%
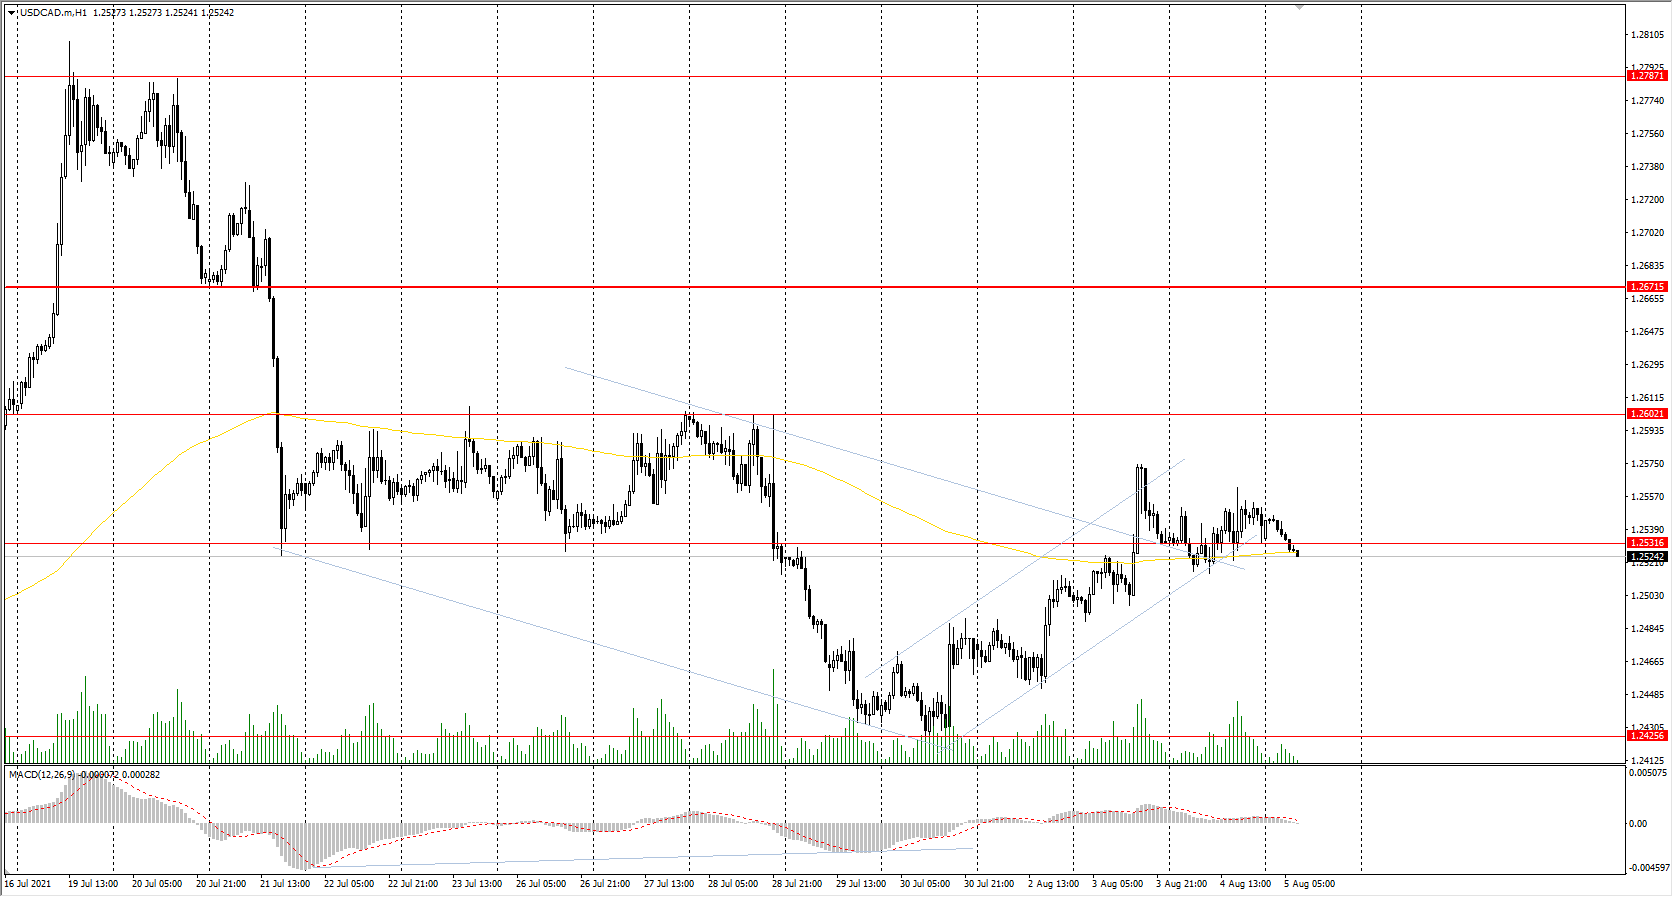
The Canadian dollar is highly dependent on the dollar index and the oil price dynamics. The dollar index jumped sharply yesterday, while oil prices continued to fall. Logic suggests that the USD/CAD rate should have jumped up with such a situation, but it did not happen. This means that the investors are expected to stabilize oil prices.
Trading recommendations
Support levels: 1.2531, 1.2425, 1.2370, 1.2312
Resistance levels: 1.2602, 1.2671, 1.2787, 1,2951
Considering technical analysis, the USD/CAD trend is bearish. The MACD indicator is inactive. Under such market conditions, traders should look for sell positions from the resistance levels after sellers show initiative. There are no optimal points for buy positions right now.
Alternative scenario: if the price breaks through the 1.2671 resistance level and fixes above, the uptrend is likely to be resumed.
EUR/JPY Daily Outlook
Daily Pivots: (S1) 129.22; (P) 129.52; (R1) 129.90; More....
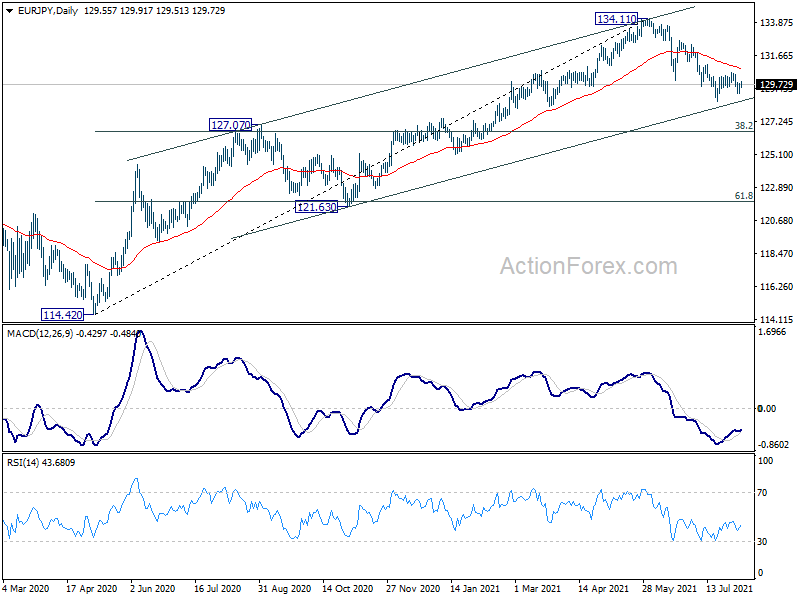
EUR/JPY is staying in consolidation from 128.58 and intraday bias remains neutral first. With 131.07 resistance intact, deeper fall remains mildly in favor. On the downside, break of 128.85 will resume the fall from 134.11 to 127.07 resistance turned support next. On the upside, break of 131.07 resistance will argue that choppy fall from 134.11 has completed. Intraday bias will be turned back to the upside for 132.68 resistance first.
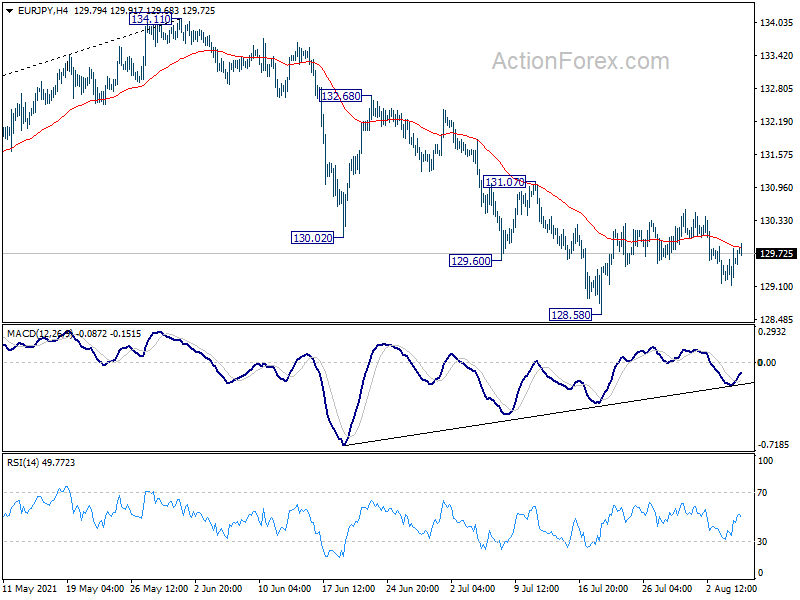
In the bigger picture, rise from 114.42 is seen as a medium term rising leg inside a long term sideway pattern. As long as 127.07 resistance turned support holds, further rise is still expected to retest 137.49 (2018 high). However, firm break of 127.07 will argue that the medium term trend has reversed, and open up the case for retesting 114.42.
EUR/GBP Daily Outlook
Daily Pivots: (S1) 0.8508; (P) 0.8520; (R1) 0.8536; More...
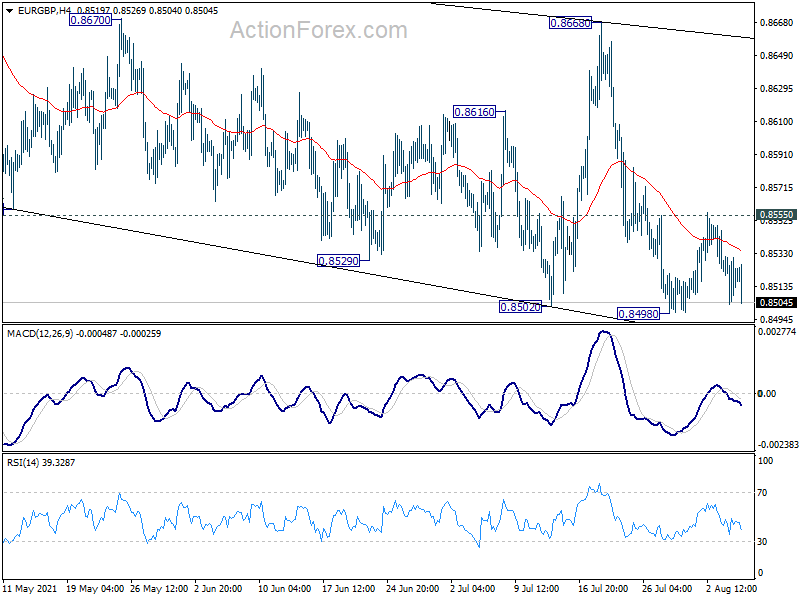
Range trading continues in EUR/GBP and intraday bias remains neutral first. On the downside, break of 0.8498 support will resume the choppy corrective fall from 0.8718 towards 0.8470 low. On the upside, break of 0.8555 minor resistance will turn bias back to the upside for 0.8668 resistance instead.
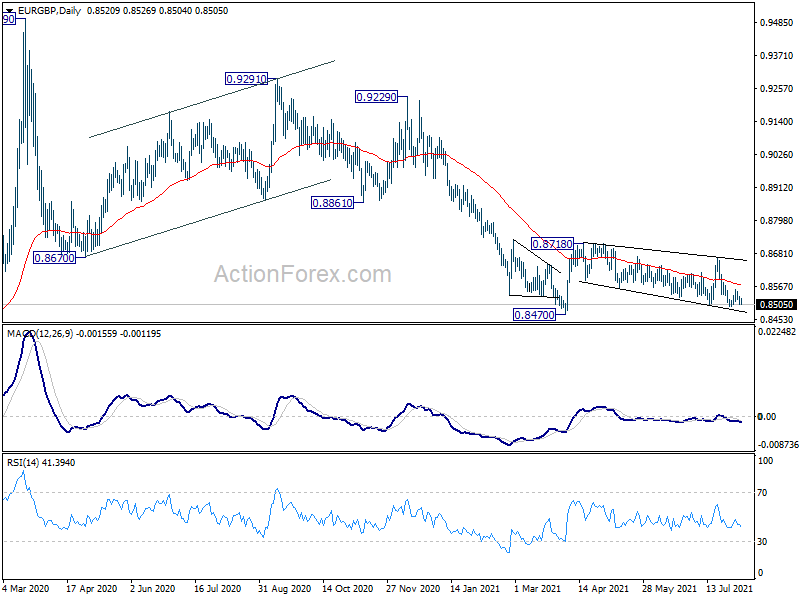
In the bigger picture, price actions from 0.9499 are still seen as developing into a corrective pattern. Deeper fall could be seen as long as 0.8718 resistance holds. However, firm break of 0.8717 would argue that a medium term bottom was already formed. Stronger rise would be seen to 0.8861 support turned resistance to confirm completion of the corrective pattern.
EUR/AUD Daily Outlook
Daily Pivots: (S1) 1.5983; (P) 1.6022; (R1) 1.6075; More...
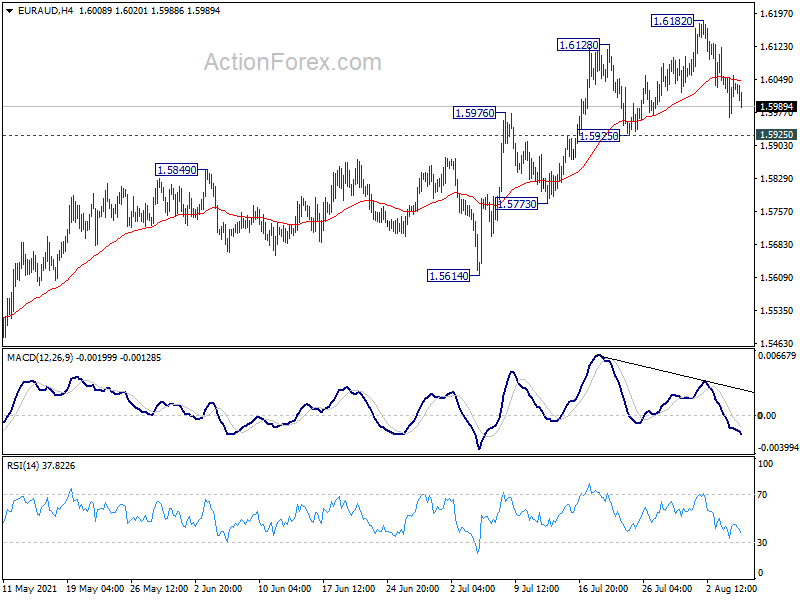
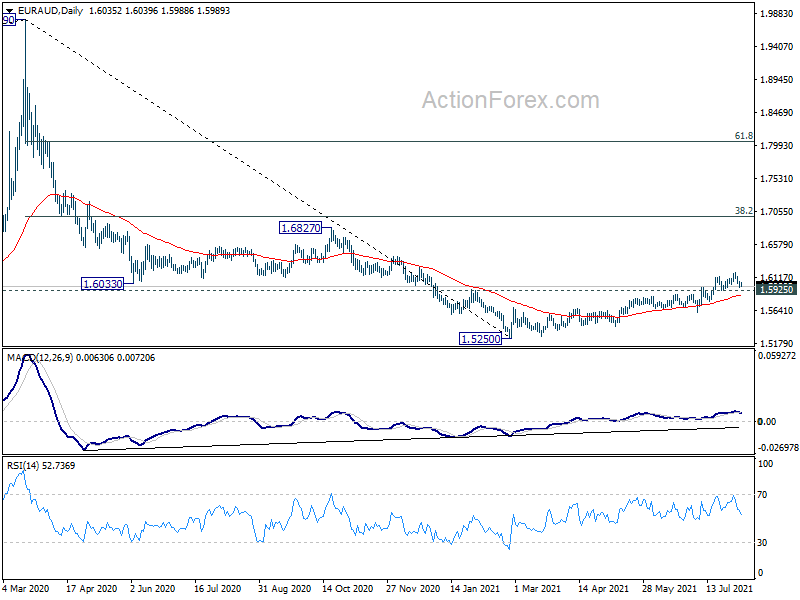
Intraday bias in EUR/AUD remains neutral as consolidation continues. Near term outlook stays bullish as long as 1.5925 support holds. On the upside, break of 1.6182 will resume the rise from 1.5250 to 1.6827 resistance next. However, firm break of 1.5925 will bring deeper fall back to 1.5614 structural support instead.
In the bigger picture, a medium term bottom was formed at 1.5250, on bullish convergence condition in daily MACD. Rise from 1.5250 is currently seen as a correction to the down trend from 1.9799 first. Stronger rise would be seen to 38.2% retracement of 1.9799 to 1.5250 at 1.6988 next. We'd tentatively expect strong resistance from there to limit upside, at least on first attempt.
EUR/CHF Daily Outlook
Daily Pivots: (S1) 1.0722; (P) 1.0731; (R1) 1.0740; More....
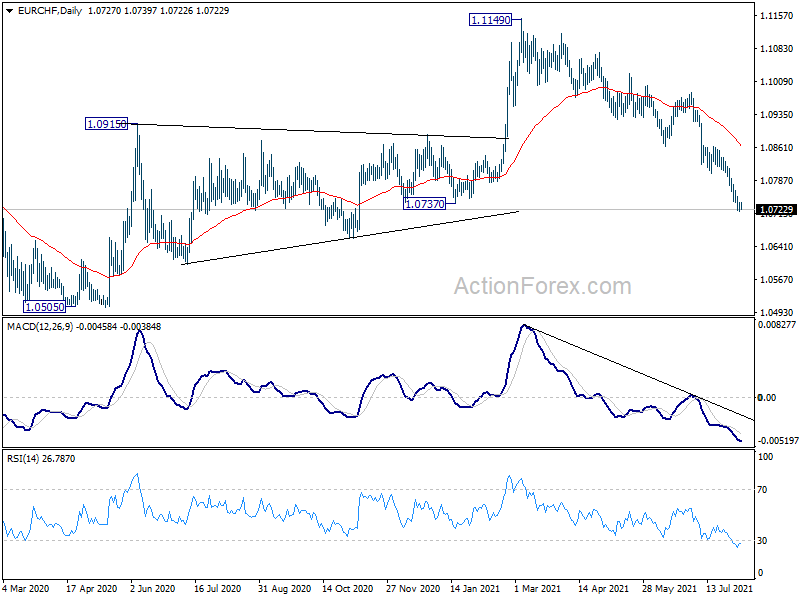
EUR/CHF is losing some downside momentum as seen in 4 hour MACD, but there is no sign of bottoming yet. Intraday bias stays on the downside. Current decline from 1.1149 would target a retest on 1.0505 low. On the upside, 1.0802 support turned resistance is needed to indicate short term bottoming. Otherwise, outlook will stay bearish in case of recovery.
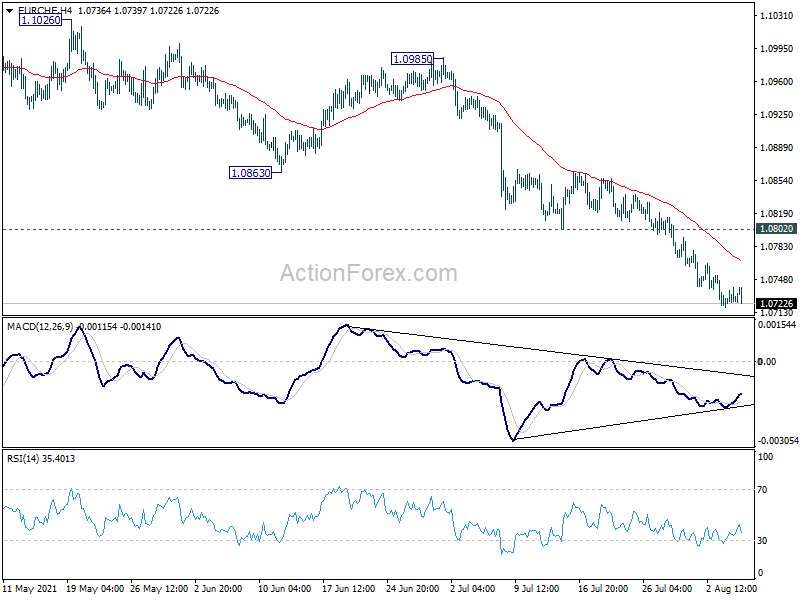
In the bigger picture, rebound from 1.0505 (2020 low) should have completed at 1.1149 already. The three wave corrective structure argues that the downtrend from 1.2004 (2018 high) is not over yet. Medium term outlook will now stay bearish as long as 1.1149 resistance holds. Break of 1.0505 low would be seen at a later stage.