Sample Category Title
EUR/USD Daily Outlook
Daily Pivots: (S1) 1.1813; (P) 1.1857; (R1) 1.1880; More...
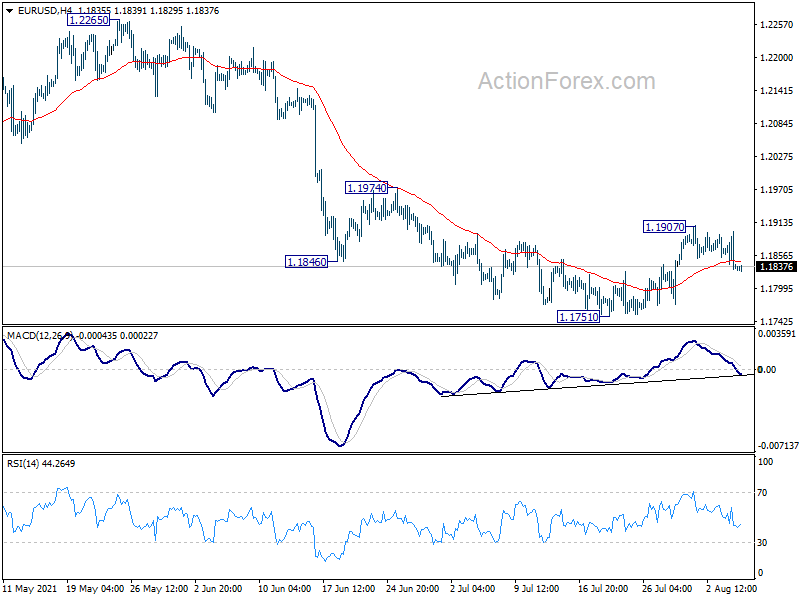
Range trading continues in EUR/USD above 1.1751 short term bottom. On the upside, above 1.1907 will resume the rebound to 1.1974 resistance first. Firm break there should argue that whole corrective pattern from 1.2348 has completed. On the downside, however, break of 1.1751 will resume the fall from 1.2265 to 1.1703 support instead.
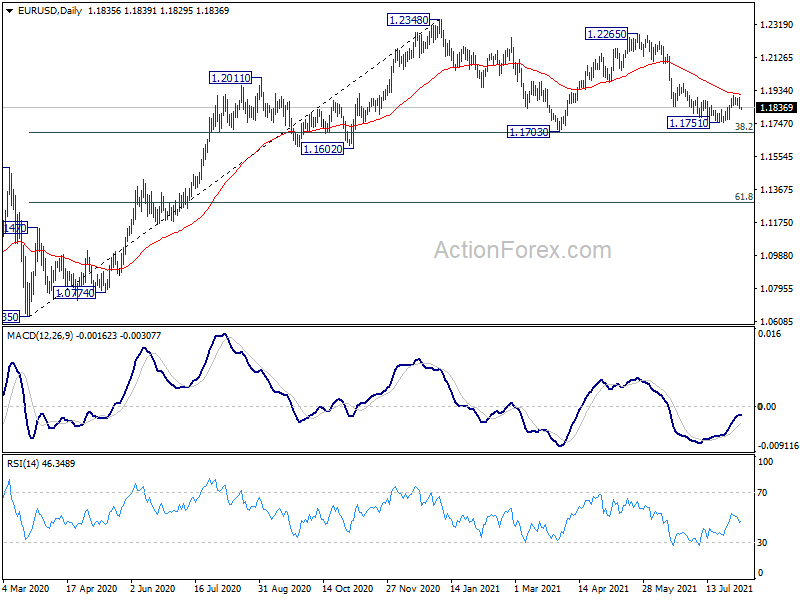
In the bigger picture, rise from 1.0635 is seen as the third leg of the pattern from 1.0339 (2017 low). Further rally could be seen to cluster resistance at 1.2555 next, (38.2% retracement of 1.6039 to 1.0339 at 1.2516). This will remain the favored case as long as 1.1602 support holds. Reaction from 1.2555 should reveal underlying long term momentum in the pair. However sustained break of 1.1602 will argue that the rise from 1.0635 is over, and turn medium term outlook bearish again.
EUR/USD Breaks Channel Pattern
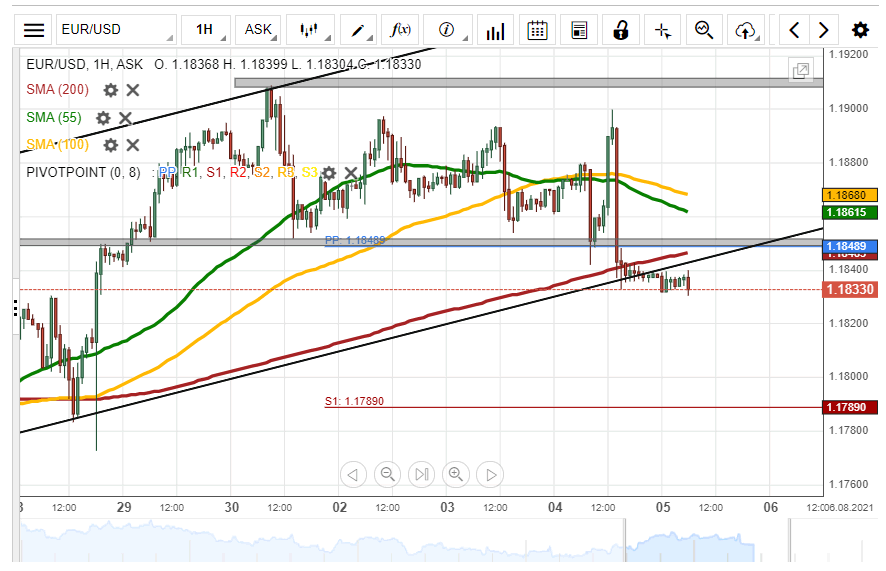
During the first half of Wednesday's trading session, the Eurozone single currency surged by 53 pips or 0.45% against the US Dollar. But, the EUR/USD pair surrendered the earlier gains by the end of Wednesday's session.
Given that the exchange rate has breached the lower line of an ascending channel pattern, bearish traders could continue to drive the price lower during the following trading session.
However, the currency exchange rate might reverse from the current price level at 1.1833 and target yesterday's high at 1.1900 within this session.
GBP/USD Daily Outlook
Daily Pivots: (S1) 1.3865; (P) 1.3911; (R1) 1.3937; More....
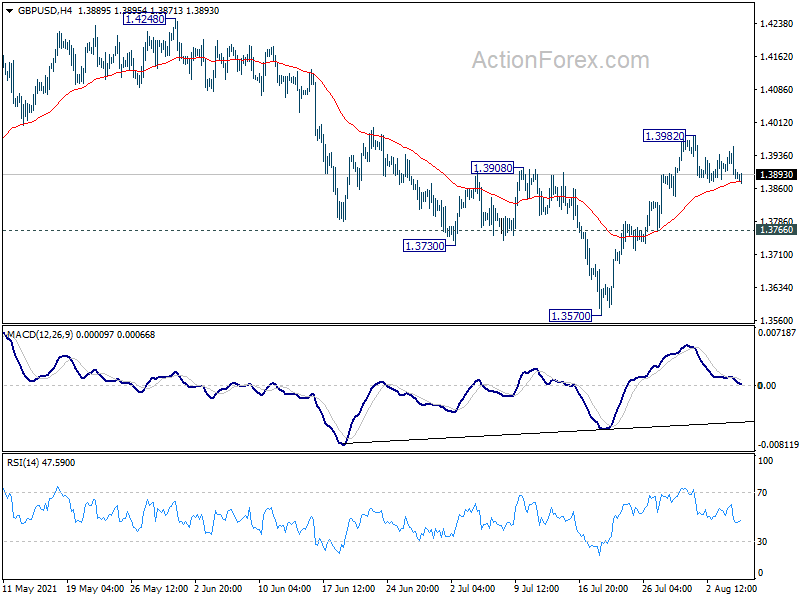
GBP/USD is staying in consolidation from 1.3982 and intraday bias remains neutral first. Outlook is unchanged that corrective pattern from 1.4240 could have completed with three waves down to 1.3570. Further rise is expected as long as 1.3766 support holds. On the upside, break of 1.3982 will resume the rise from 1.3570 to retest 1.4248 high. However, break of 1.3766 support will dampen this bullish view and bring retest of 1.3570.
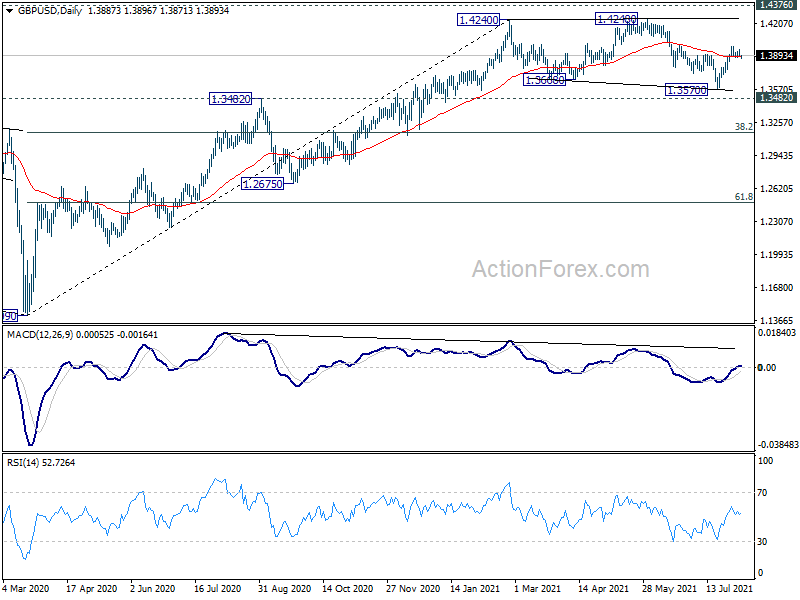
In the bigger picture, as long as 1.3482 resistance turned support holds, up trend from 1.1409 should still continue. Decisive break of 1.4376 resistance will carry larger bullish implications. However, firm break of 1.3482 support will argue that the rise from 1.1409 has completed. GBP/USD would then be seen in another leg of long term range pattern between 1.1409 and 1.4376. Deeper fall could then be seen to 61.8% retracement of 1.1409 to 1.4248 at 1.2493, and even below.
GBP/USD Breakout Occurs
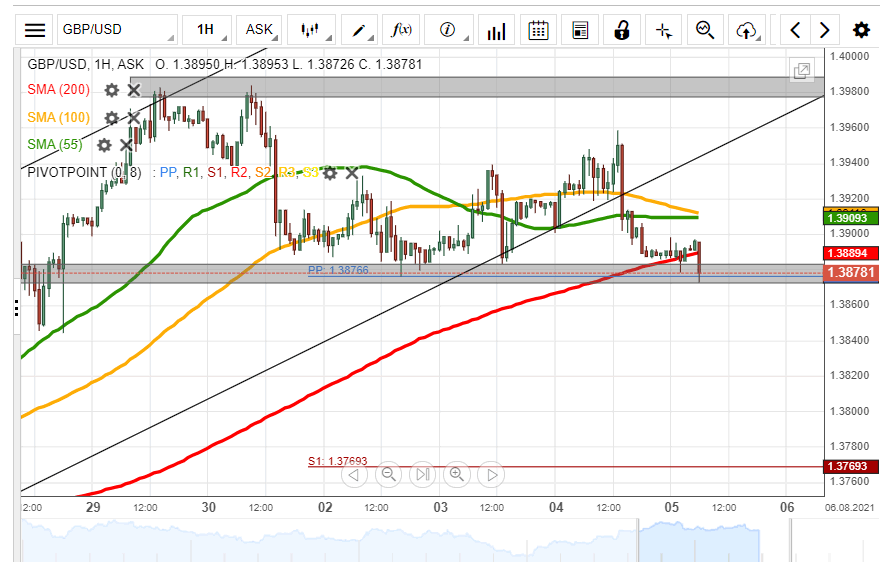
The British Pound declined by 63 pips or 0.45% against the US Dollar on Wednesday. A breakout occurred through the lower boundary of an ascending channel pattern during Wednesday's trading session.
Given that a breakout has occurred, sellers are likely to continue to pressure the currency pair lower during the following trading session. The potential target for bearish traders will be near the 1.3820 area.
However, the 200– hour simple moving average at 1.3886 could provide support for the GBP/USD currency exchange rate within this session.
USD/JPY Tests 200– Hour SMA
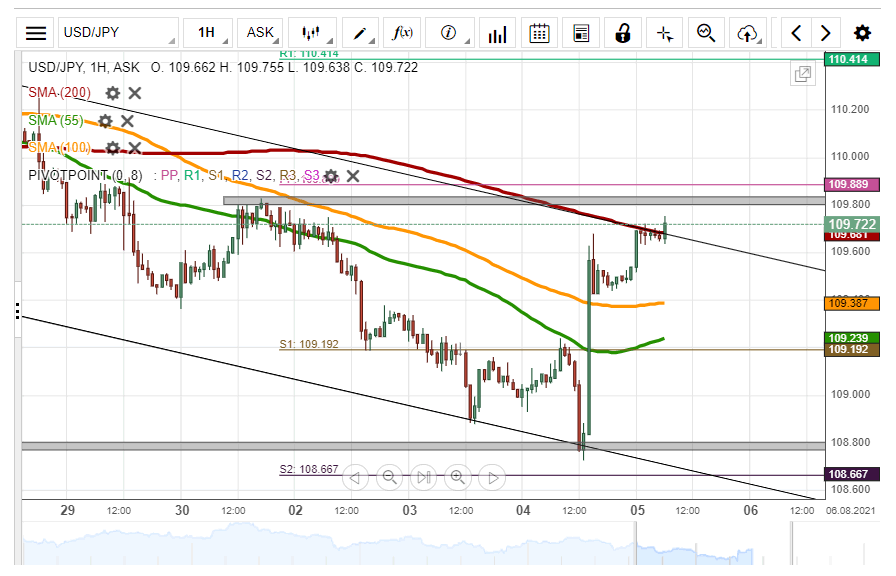
The USD/JPY pair bounced off the lower boundary of a descending channel pattern at 108.80 on Wednesday. As a result, the US Dollar edged higher by 83 pips or 0.77% against the Japanese Yen during Wednesday's trading session.
The exchange rate was trading near the upper line of the channel pattern during the Asian session on Thursday. If the descending channel holds, a decline towards the weekly S1 at 108.66 could be expected today.
However, if the currency exchange rate breaks the resistance level, the next target for buyers will be near the 110.00 level.
XAU/USD Decline Likely To Continue
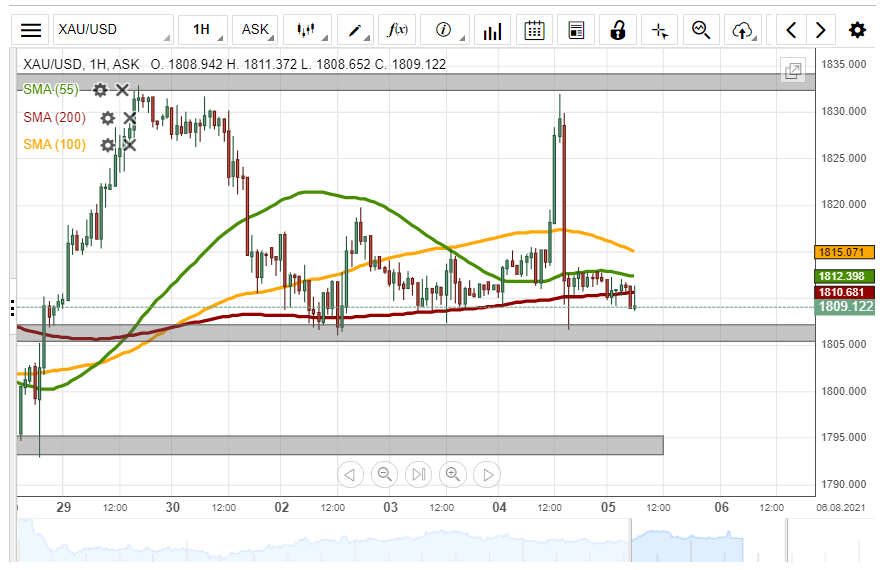
The yellow metal's price tested the 1830.00 level on Wednesday. However, the XAU/USD exchange rate surrendered the earlier gains at the end of Wednesday's trading session.
The commodity is likely to continue to edge lower during the following trading session. The possible target for gold short traders would be near the 1795 level.
However, the 200– hour simple moving average at 1810.1 could probably provide support for the exchange rate within this session.
USD/CHF Daily Outlook
Daily Pivots: (S1) 0.9030; (P) 0.9053; (R1) 0.9087; More....
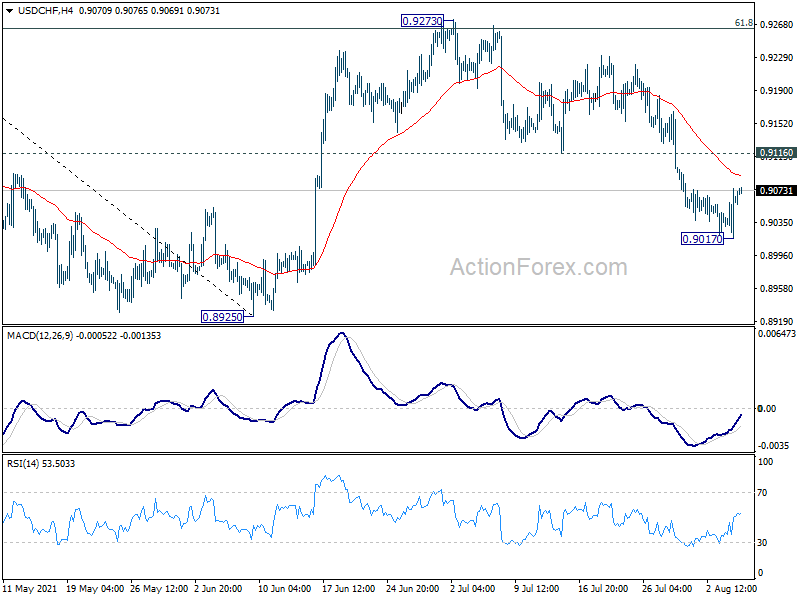
Intraday bias in USD/CHF is turned neutral for some consolidations above 0.9017. Still, further fall is expected as long as 0.9116 support turned resistance holds. Break of 0.9017 will resume the decline from 0.9273 to retest 0.8925 low. Nevertheless, sustained break of 0.9116 will turn bias back to the upside for retesting 0.9273 instead.
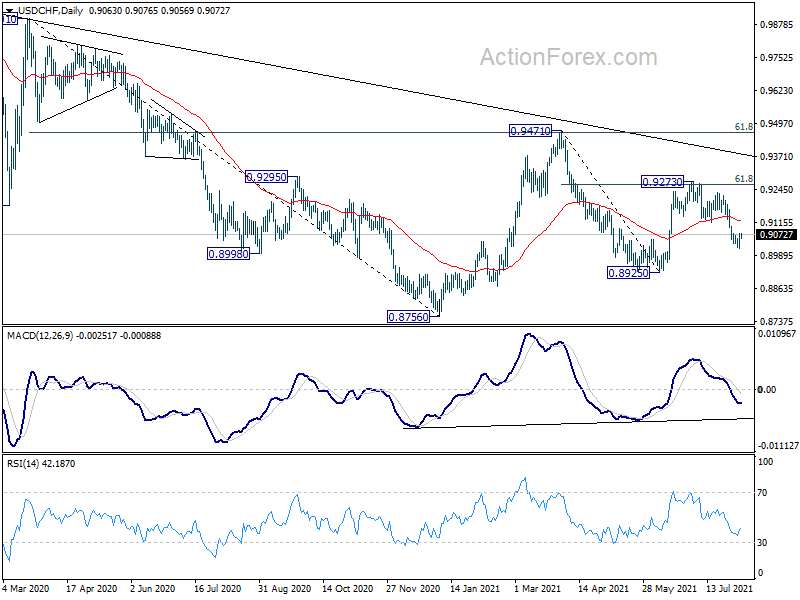
In the bigger picture, failure to sustain above 55 week EMA (now at 0.9183) affirms medium term bearish in USD/CHF. Break of 0.8925 support should resume the whole decline form 1.0342 (2016 high) through 0.8756 low. For now, risk will stay on the downside as long as 0.9273 resistance holds, in case of rebound.
EURUSD Breaks Key Support After Weak ADP US Jobs Data
US stocks declined sharply on Wednesday as investors continued to watch reports about the Delta variant. The Dow Jones shed 323 points while the S&P 500 fell by 20 points. The Nasdaq 100 index rose by about 20 points. The decline happened after a relatively weak report by ADP that showed that the American economy added just 330k jobs in July, lower than the median estimate of more than 665k. The report cited the ongoing bottlenecks in hiring, that continued to hold back the labour market.
The key movers in the US were firms like Robinhood and Uber. Robinhood shares jumped by more than 50%, valuing the broker at more than $58 billion. It has jumped by more than 85% from its IPO. Uber shares declined by more than 4% in the futures market even after the firm published strong quarterly results. It warned of the rising driver shortage and the impact of the pandemic. The firm made an adjusted loss excluding taxes of $509 million from 837 million in the previous quarter. On Tuesday, Lyft said that it turned a profit in the second quarter.
The British pound remained in a tight range as investors waited for the Bank of England decision. The bank is expected to leave interest rates unchanged. It is also expected to leave its quantitative easing policies unchanged as uncertainties over the Delta variant spread. Traders will be watching the bank’s statement on inflation. In May, the members said that it would rise above 2% only briefly. But the rate has overshot the target in the past three months and there are worries that it will rise to more than 4% this year. The BOE will also publish its updated assessment of the economy.
EURUSD
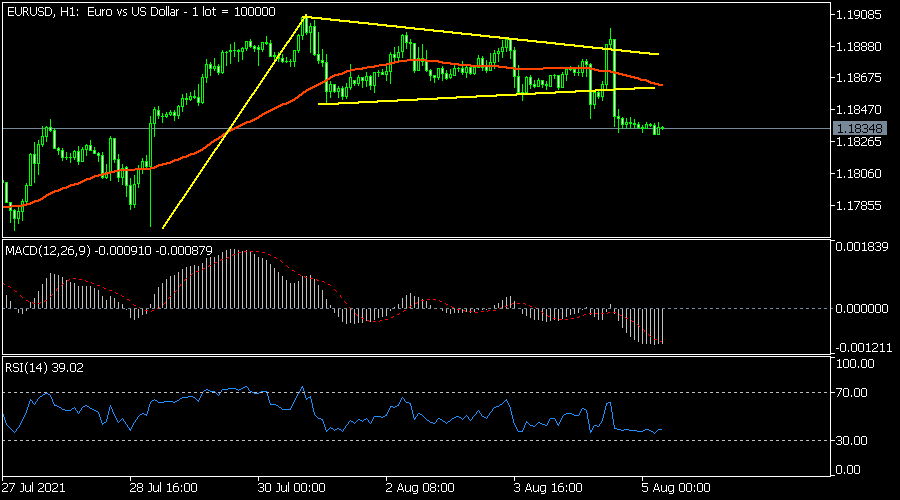
The EURUSD pair broke out lower during the overnight session. The pair declined to a low of 1.1835, which was the lowest level since July 28. On the hourly chart, it managed to move below the bullish pennant pattern. It also declined below the 25-day moving average while the MACD has moved below the neutral level. The RSI has also declined close to the oversold level. Therefore, the pair may continue the downward trend as traders target the next key support at 1.1800.
USDCHF
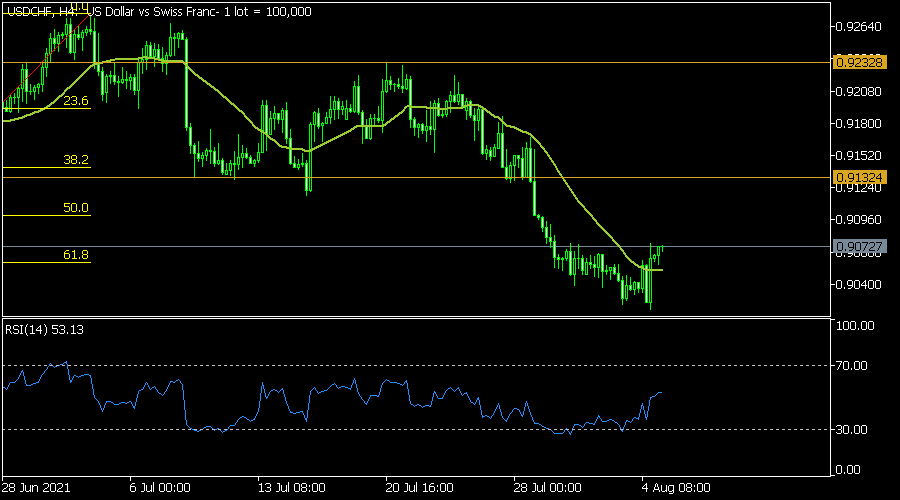
The USDCHF pair rose to a high of 0.9072 after relatively weak US jobs data. On the four-hour chart, the pair rose above the 61.8% Fibonacci retracement level. The Relative Strength Index (RSI) has moved from the oversold level to the current 53. It has also moved above the 25-day moving averages. It remains below the important resistance level at 0.9132, which was the neckline of the head and shoulders pattern. The pair may keep holding steady as traders wait for the latest NFP data.
AUDNZD
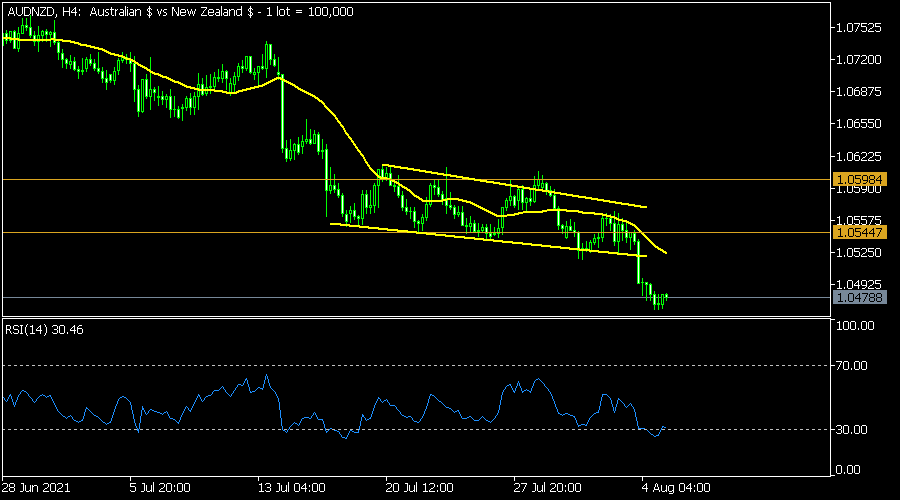
The AUDNZD maintained the downward momentum as investors reacted to the latest strong New Zealand jobs data. Earlier today, the Australian statistics agency also published relatively strong trade numbers. On the four-hour chart, the pair moved below the previous descending channel. It also moved below the 25-day moving average while the RSI moved below the oversold level. Therefore, the pair may keep falling as investors target the next key support at 1.0350.
USDCHF Still Bearish
Technical analysis
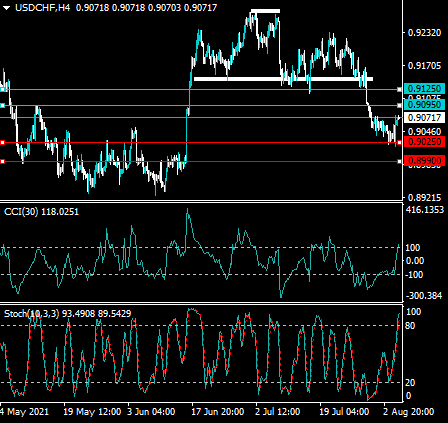
The USDCHF pair remains under pressure as a large head and shoulders pattern on the four-hour time frame continues to play out to the downside.
According to the CCI and Stochastic indicator the trend on the four-hour time frame the USDCHF pair is trading in overbought trading conditions.
What the possible outcomes are
In our most likely scenario, the USDCHF pair will start to decline back towards the 0.9025 support level from current levels as the bearish price trend in the pair remains strong.
Alternatively, the USDCHF pair will stage one final corrective move higher towards the 0.9095 resistance level before staging a decisive move under the 0.9000 support level.
Key levels
Support 0.9025 0.8990
Resistance 0.9095 0.9120
GBPJPY Bullish Bias
Technical analysis
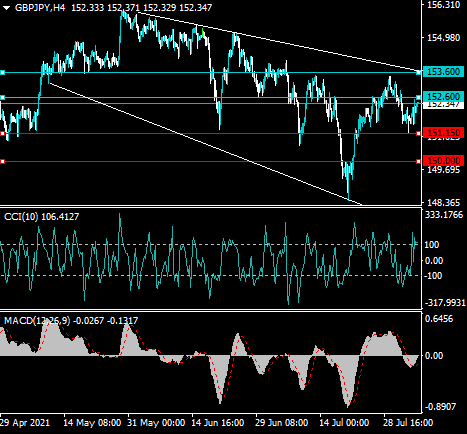
The GPJPY pair has found strong dip buying interest and could be preparing to test towards the top a large descending broadening wedge pattern, around the 153.60 level.
The MACD and the Commodity Channel Index indicator on the four-hour time frame are both starting to issue buy signals.
What the possible outcomes are
In our most likely scenario, the GBPJPY pair will rally from current levels towards the top of a large descending broadening wedge pattern, around the 153.60 level.
Alternatively, the GBPJPY pair may stage one final large price pullback towards the 150.00 level before rally towards the 153.60 level.
Key levels
Support 151.15 150.00
Resistance 152.60 153.60