Sample Category Title
Fed Daly ready for tapering by the end of the year or early next
San Francisco Fed President Mary Daly said in a PBS interview, she didn't expect the Delta variant to "derail recovery" in the US. nevertheless, "it's already very seriously interrupting the recoveries in the global economy," which is a "headwind on US growth.
She's looking for "continued progress in the labor market, continued putting COVID behind us, rising vaccination rates, the things that are so fundamental to us saying that the economy has achieved that metric of substantial further progress."
Right now, her modal outlook is that "we will achieve that metric later this year or early next". And, "we will do something on the asset front, asset purchase tapering, by the end of this year or early next."
Fed Kaplan wants tapering soon, but not aggressive on rate
Dallas Fed President Robert Kaplan told Reuters that, "as long as we continue to make progress in July numbers and in August jobs numbers, I think we'd be better off to start adjusting these purchases soon," referring to the QE program.
He added that tapering over a time frame of "plus or minus" about eight months would help give the Fed " as much flexibility as possible to be patient and be flexible on the Fed funds rate."
He emphasized it's "important to divorce discussion of the Fed funds rate from discussion of our purchases." His comments on purchases are not intended to suggest I want to take more aggressive action on the Fed funds rate."
Elliott Wave View: Dow Futures (YM) Short Term Support Area
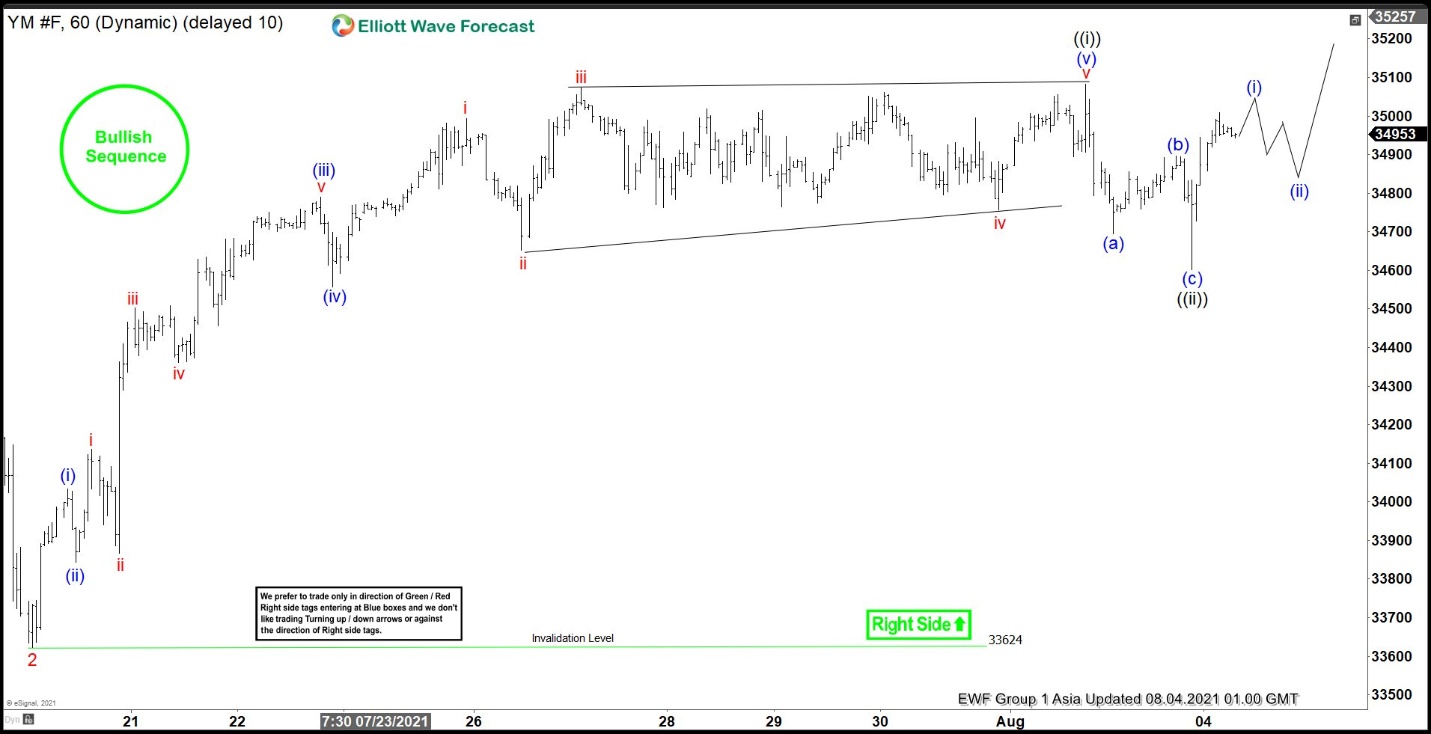
Short Term Elliott Wave view in Dow Futures (YM) suggests the rally from June 21 low is unfolding as a 5 waves impulse Elliott Wave structure. Up from June 21 low, wave 1 ended at 34975 and pullback in wave 2 ended at 33624. Index has resumed higher in wave 3 with internal subdivision as another 5 waves impulse in lesser degree. Up from wave 2, wave (i) ended at 34034 and pullback in wave (ii) ended at 33843. Index resumes higher again in wave (iii) towards 34789 and dips in wave (iv) ended at 34557. Final leg higher wave (v) of ((i)) ended at 35082.
Wave ((ii)) pullback is unfolding as a double three Elliott Wave structure. Down from wave ((i)), wave (w) ended at 34602 and rally in wave (x) ended at 35009. Expect wave (y) to end at 100% – 161.8% Fibonacci extension of wave (w) towards 34217 – 34521 blue box area. Index should then find buyers at the blue box area for further upside or 3 waves rally at least. Near term, as far as wave 2 pivot on July 20 low at 33624 stays intact, expect dips to find support in 3, 7, or 11 swing for further upside.
Dow Futures (YM) 60 Minutes Elliott Wave Chart
Market Morning Briefing: EURJPY Has Bounced From Levels Just Above Support At 129
STOCKS
Sensex and Nifty retain their momentum and are bullish while others are yet to make a convincing breakout of their ranges. As mentioned yesterday, Sensex and Nifty will be outperformers. Dow has come-off below 35000 again and has chances to dip to 34250-34000 within its sideways range. DAX continues to look mixed and unclear within its 15200-15800 range. Nikkei is holding above the range support but needs to rise past 2800 to negate the danger of breaking the range on the downside. Shanghai has room to rise in the near-term.
Dow (34792.67, −323.73, -0.92%) has failed to sustain above 3500 and has come-off sharply. This keeps alive the chances of seeing a fall to 34250-34000 which will keep the broader 33000-35250 range intact. That in turn will delay the expected break above 35250 and the rise to 36000 that we have been expecting.
DAX (15692.13, +137.05, +0.88%) continue to hover around 15600. The immediate outlook is mixed and the chances are equal to see either side within the 15200-15800 range for now. From a bigger picture we retain our bullish view to see an upside break above 15800 and a rise to 16000-16200 eventually.
Nikkei (27648.10, +64.02, +0.23%) remains stable and continues to hold above 27500. A break above 28000 from here will ease the danger of seeing a break below 27000 and the fall to 26000 that we had cautioned earlier. For now the 27000-29500 range remains intact.
Shanghai (3478.42, +1.20, +0.04%) has risen above 3460 and keeps intact our view of seeing a rise to 3500-3550 in the near term. As mentioned yesterday, a sustained break above 3550 will bring back the earlier bullish view of seeing 3700-3800 on the upside over the medium-term. It will also negate the danger of seeing 3200 on the downside.
Sensex (54369.77, +546.41, +1.02%) has moved up to 54000 as mentioned yesterday and indeed has risen above that level as well. The outlook is bullish and a further rise to 56000 and even higher in the coming days. 53500-53000 will now be a strong support zone.
Nifty (16258.80, +128.05, +0.79%) has risen well above 16200 and is bullish to see 16500-16600 levels on the upside now. 16000-15900 will be a good support now that can limit the downside.
COMMODITIES
Crude prices have fallen as expected and Brent and WTI can rise from supports near 70 and 68 respectively. Gold, Silver and Copper trades lower and looks bearish for now while Dollar Index trades strong.
Brent (70.71) and WTI (68.50) trades lower as expected. It is needed to see if Brent falls below 70 or manages to bounce back in the near term. WTI too has support near 68 which is likely to hold on first testing.
Gold (1812.90) has fallen after testing 1831.71 yesterday. The spike yesterday was aided by the US jobs data but later in the US session, after the FED vice chair, Richar Clarida announced a possible taper by end of the year, US Dollar strengthened sharply dragging down Gold to lower levels. Gold can be stuck within 1840-1800 for the near term before any sharp movement on either side is seen from there. A re-test of 1800 on the downside cannot be negated.
Silver (25.41) tested 26 before coming down from there. It can now test 25 before again bouncing back to higher levels. Overall range of 24.50-26 may hold for now.
Copper (4.3420) trades below 4.40 and could test 4.30 soon. Thereafter, a break below 4.30 may take it further down to 4.20. Immediate view is bearish on Copper.
FOREX
Dollar Index trades strong after the announcements of a possible taper by end of the year as Euro fell sharply back to levels below 1.1850 and can fall to 1.18 or lower in the near term. Aussie and Pound have turned bearish. USDJPY is again headed towards 110-110.50 while EURJPY can head towards 130.50 in the near term. USDCNY has fallen and could bounce back from 6.45 while USDINR needs to hold below 74.25 else it can bounce back sharply towards 74.40/60 soon.
Dollar Index (92.317) has held well above 91.75 which has now pushed the index back to levels above 92.25 mentioned yesterday. While above 92.25, view of a fall back towards 91.75 or lower seems less and instead the index can rise further to test 92.50 or higher now. The rise was boosted by the FED’s new policy strategy that stated that the conditions for raising interest rates could be met by end of 2022. The FED’s vice chairman, Richard Clarida added that he could certainly see the FED announcing a reduction in its $120bln/month asset purchase program later this year, given the surprising pace of economic recovery from the pandemic. Immediate view is bullish on the Dollar Index.
Euro (1.1832) fell sharply, back below 1.1850 after a brief test of 1.19+ levels earlier this week. A fall towards 1.18 cannot be negated in the next few sessions before any bounce is seen again in the next couple of weeks. Euro seems bearish for the near term.
EURJPY (129.79) has bounced from levels just above support at 129 and while that holds, we may expect a slow and steady rise towards 130.50. A break above 130.50, if seen in the next few sessions would be strongly bullish.
Dollar-Yen (109.67) bounced back sharply from 108.72, pulled up by the rise in Dollar Index after statements by the FED vice chairman. If the rise sustains, we may expect a move back towards 110-110.50 soon.
Aussie (0.7386) seems to be rising slowly. Crucial resistance is seen near 0.7450-0.75 which if holds could push back Aussie sharply to lower levels of 0.73-0.72 in the medium term. Watch for an immediate rise towards mentioned resistance.
Pound (1.3880) is trading lower too, ready for a sharp fall below 1.3875. Such a break if seen is bearish for the near term and could take Pound down to 1.3850 initially and then towards 1.38. View is bearish while below 1.39.
USDCNY (6.4647) is holding below 6.47 now and could fall towards 6.46/45 again before attempting to bounce higher towards 6.48 in the near term.
USDINR (74.1850) is likely to hold above 74 but it needs a close watch to see if the rise in Dollar Index and sharp fall in Euro can pull up USDINR above immediate resistance of 74.20/25 or let it remain ranged for now. A break above 74.25 would indicate a rise back towards 74.40/60 again in the near term. Watch price action near 74.20/25 today. On the downside 74 is an immediate support to watch.
INTEREST RATES
The US Treasury yields have moved up yesterday following the comments from the Fed Vice Chairman Richard Clarida that the economic targets will be attained by next year end and the Fed will begin rate hikes in 2023. We retain our view of seeing a corrective bounce in the coming weeks before the overall downtrend resumes again. We will have to wait and see if the non-farm payroll data release on Friday can provide further trigger for this corrective rally to happen. The German yields have limited room on the downside and can reverse higher from here. The 10Yr GoI is at a resistance and can fall from here on muted trades. The 5Yr GoI can also fall from current levels while it remains below 5.74%. The Reserve Bank of India’s monetary policy decision is due tomorrow.
The US 2Yr (0.19%), 5Yr (0.69%) and 10Yr (1.20%) Treasury yields have risen from levels seen in the Asian session yesterday while the 30Yr (1.85%) remains stable. We see supports at 1.1% on the 10Yr and 1.8% on the 30Yr that can pause the current downtrend. A corrective rise to 1.45%-1.5% (10Yr) and 2.1%-2.2% (30Yr) can be seen in the coming weeks. Thereafter the overall downtrend can resume.
The German 2Yr (-0.79%), 5Yr (-0.77%), 10Yr (-0.50%) and 30Yr (-0.04%) yields have come down to test their key supports as expected. -0.5% (10Yr) and-0.05% (30Yr) are the key levels that we have been mentioning. We expect the yields to reverse higher either from here itself or after another 5 bps dip and see a corrective bounce to -0.30%/-0.25% (10Yr) and 0.10% (30Yr). Thereafter the broader downtrend can resume again.
The 10Yr GoI (6.3055%)remains stable around 6.3% with muted trading. We retain our view of seeing a fall back to 6.2%-6.1% from here. The 5Yr GoI (5.7102%) seems to lack strength to break above 5.74% and rise to 5.76% that we have been expecting. Inability to breach 5.74% can drag the 5Yr yield to 5.70%-5.68% in the near-term.
AUD/USD Shows Positive Signs, Key Resistance Nearby
Key Highlights
- AUD/USD recovered nicely above the 0.7350 resistance zone.
- It broke a major bearish trend line at 0.7380 on the 4-hours chart.
- The ISM Services PMI increased from 60.1 to 64.1 in July 2021.
- The US Initial Jobless Claims could decline from 400K to 384K in the week ending July 31, 2021.
AUD/USD Technical Analysis
The Aussie Dollar formed a base above the 0.7300 zone against the US Dollar. AUD/USD started a decent increase and it broke the key 0.7350 resistance.
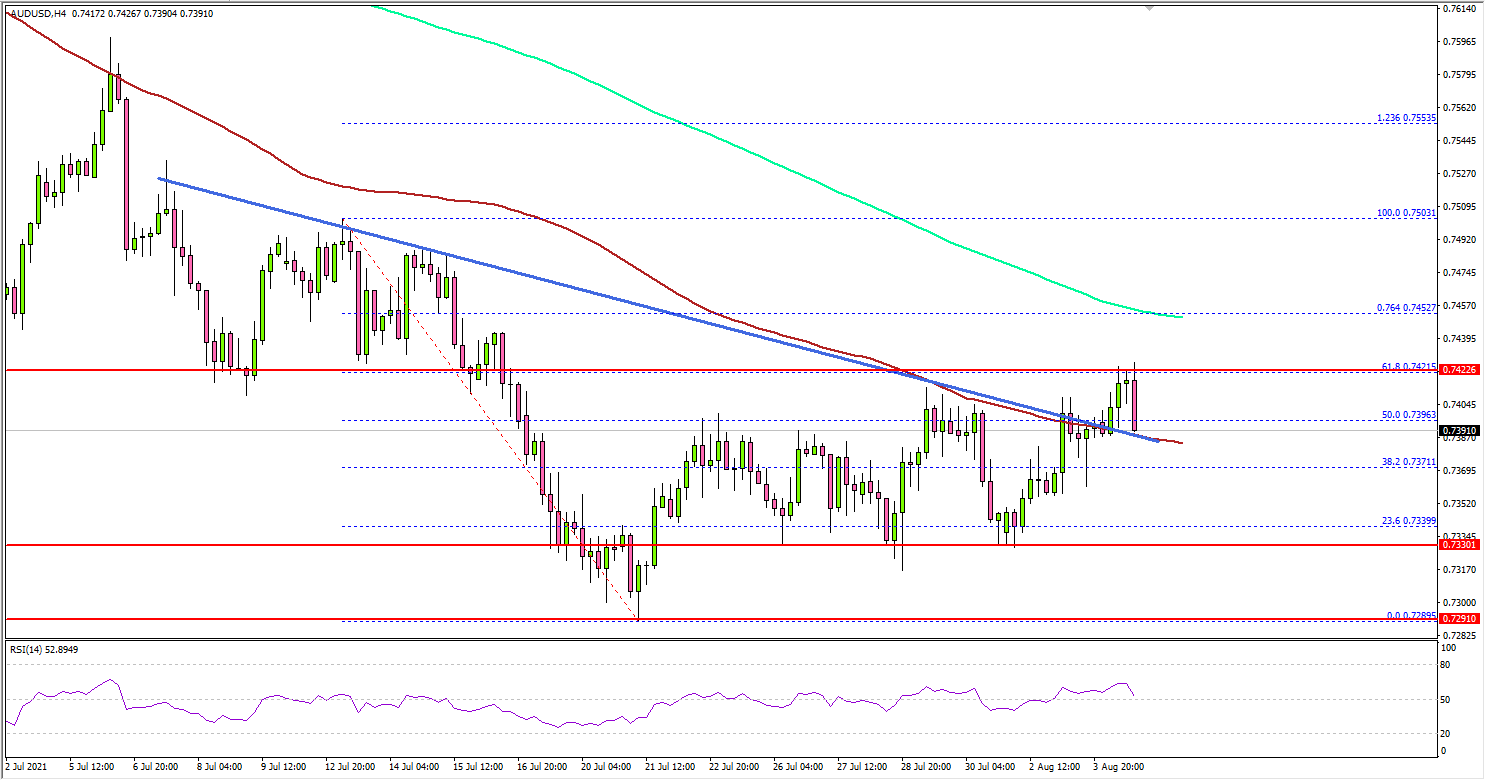
Looking at the 4-hours chart, the pair gained pace above the 50% Fib retracement level of the key decline from the 0.7503 swing high to 0.7289 low.
There was also a break above a major bearish trend line at 0.7380. The pair settled above the 0.7350 level and the 100 simple moving average (red, 4-hours). However, it is facing resistance near the 0.7420 level.
The 61.8% Fib retracement level of the key decline from the 0.7503 swing high to 0.7289 low is also near 0.7420. The next major resistance is near 0.7450 and the 200 simple moving average (green, 4-hours).
A clear break above 0.7420 and 0.7450 could set the pace for more gains. On the downside, the first major support is near the 0.7380 level. The main support is forming near 0.7330 level, below which AUD/USD is likely to resume its decline towards 0.7250.
Fundamentally, the US ISM Non-Manufacturing Index for July 2021 was released yesterday by the Institute for Supply Management (ISM). The market was looking for an increase from 60.1 to 60.4.
The actual result was better than the forecast, as the US ISM Non-Manufacturing Index increased to 64.1, which indicates the 14th straight month of growth for the services sector.
Looking at EUR/USD, the pair spiked higher, but it failed to surpass 1.1900. Besides, GBP/USD may soon attempt an upside break above the 1.4000 resistance zone.
Economic Releases
- BoE Interest Rate Decision - Forecast 0.1%, versus 0.1% previous.
- US Initial Jobless Claims - Forecast 384K, versus 400K previous.
Eco Data 8/5/21
[php_everywhere instance="1"]
Aussie Shrugs Off Soft Retail Sales
Australian dollar extends rally
The Australian dollar continues to impress and is in positive territory for a third successive day. AUD/USD punched into 74-territory earlier in the day before retreating slightly.
Australian dollar shrugs off retail sales decline
The news wasn’t good from Australian Retail Sales, but the Aussie continued its upswing nevertheless. Retail Sales for Q2 came in at -1.8% for a second straight quarter. Investors didn’t wince, however, as the reading matched the forecast. The release looks better on an annualized basis, with a gain of 2.9% compared to Q2 of 2020, when consumer spending was depressed at the height of the Covid pandemic.
The US dollar isn’t getting much love at the moment, and sentiment towards the Aussie remains high after the RBA surprised the markets and announced that it was on track to taper bond purchases in September. There had been growing expectations that the RBA would walk back from its pledge in July to scale back bond purchases, but the Bank has decided to go ahead, despite the recent uptick in Covid in Australia which has resulted in extensive lockdowns.
RBA Governor Philip Lowe sounded positive about the economic outlook, and emphasized the resilience of the economy, which he expects to rebound despite the pandemic. Still, even with the surprise taper announcement, the RBA’s monetary policy remains dovish. The taper program will be reviewed in November, and Lowe reiterated that the Bank does not plan to raise rates prior to 2024.
The markets will continue to keep a close eye on the central bank for the remainder of the week. RBA Governor Philip Lowe testifies before lawmakers on Thursday and the RBA releases quarterly economic forecasts on Friday.
AUD/USD Technical
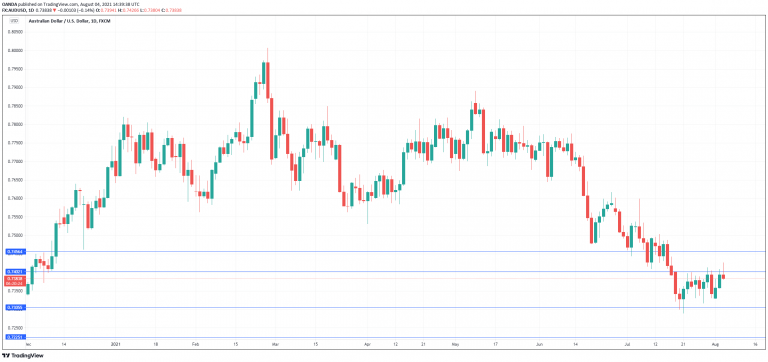
- AUD is testing resistance at 0.7402. This is followed by resistance at 0.7456
- AUD/USD has support at 0.7305. Below, there is support at 0.7262
U.S. Services Sector Remains Hot, Reaches a New High
- The July ISM services index accelerated to 64.1 from 60.1 of the previous month, well above market expectations for 60.5 and beating its own previous record of 64.0 in May.
- Demand remained strong with business activity expanding by 6.6 ppts to 67.0 and new orders growing by 1.6 ppts to 63.7. The new export orders sub-index recovered all of the last month's losses and more reaching 65.8 – a whopping 15.1 ppts increase.
- The supplier deliveries index increased by 3.7 ppts to 72 from 68.5 in June and inventories dropped by 0.7 ppts to 49.2 suggesting that supply chain disruptions remain persistent. At the same time, the backlog of orders index slowed from an all-time high, decelerating to 63.5 (a decline of 2.3 ppts).
- Employment activity recovered from contractionary territory to 53.8 (+4.5 ppts) from 49.3 in June.
- After a temporary slow-down in June, the price index jumped back up with a 2.8 ppt increase to 82.5. 17 industries reported an increase in prices.
- Seventeen out of 18 industries expanded in July.
Key Implications
- The services sector continues to grow at a strong pace with healthy gains in business activity, new orders and new export orders sub-indexes. While supply constraints and challenges in logistics remain pervasive across industries, a decline in the backlog of orders is the first sign of a narrowing gap in the supply-demand mismatches.
- The recovery in the employment sub-index is encouraging as an increase in hiring should help ease some labor supply pressures stemming from the rapid rebound in demand. Still, comments from purchasing managers indicate that constrained labor remains an issue.
- Today's report doesn’t reflect sentiment regarding the outbreak of the more infectious Delta variant, which now accounts for 92.5% of new cases (up from 54.6% at the end of June). The number of ICU patients increased a three-fold in the month of July, forcing several states announce renewed restrictions. The good news is that some new measures aim to encourage broad vaccination rather than restrict activity. We are hopeful that this strategy will avoid a severe outbreak, while keeping the services sector recovery going strong.
Gold reverses gains after record ISM services print
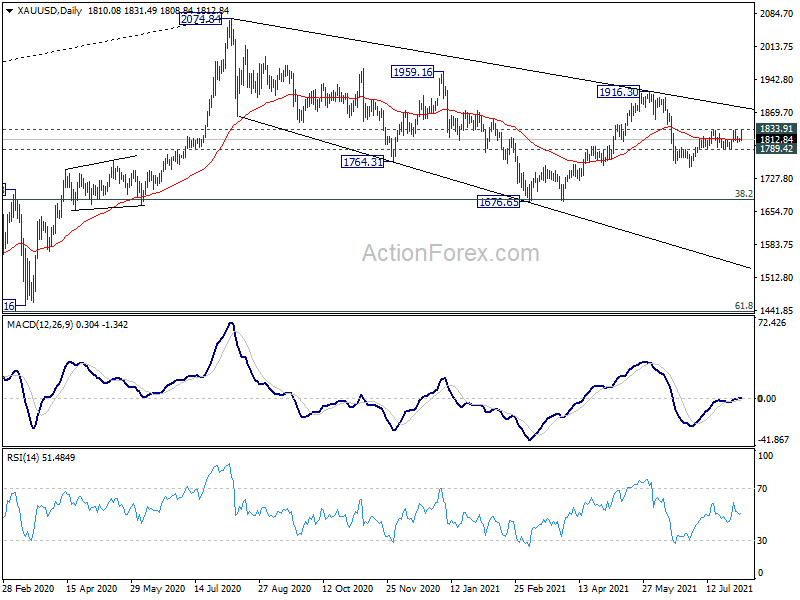
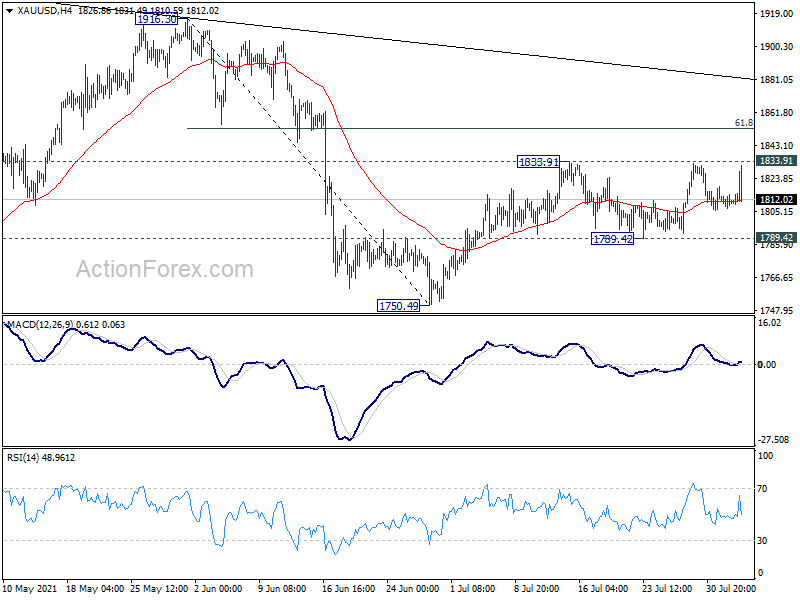
Gold failed to break through 1833.91 resistance again today. It reversed earlier gains in response to much stronger than expected ISM services data. The development suggests that consolidation pattern from 1833.91 is extending with another falling leg. Still for now, further rise is expected as long as 1789.42 support holds.
On the upside, firm break of 1833.91 will finally confirm resumption of rise from 1750.49, for 61.8% retracement of 1916.30 to 1750.39 at 1852.96.
Bitcoin – Patience to Pay Off?
Or pullback a cause for concern?
Should we be concerned that the bitcoin has stalled just as it appeared poised to take off?
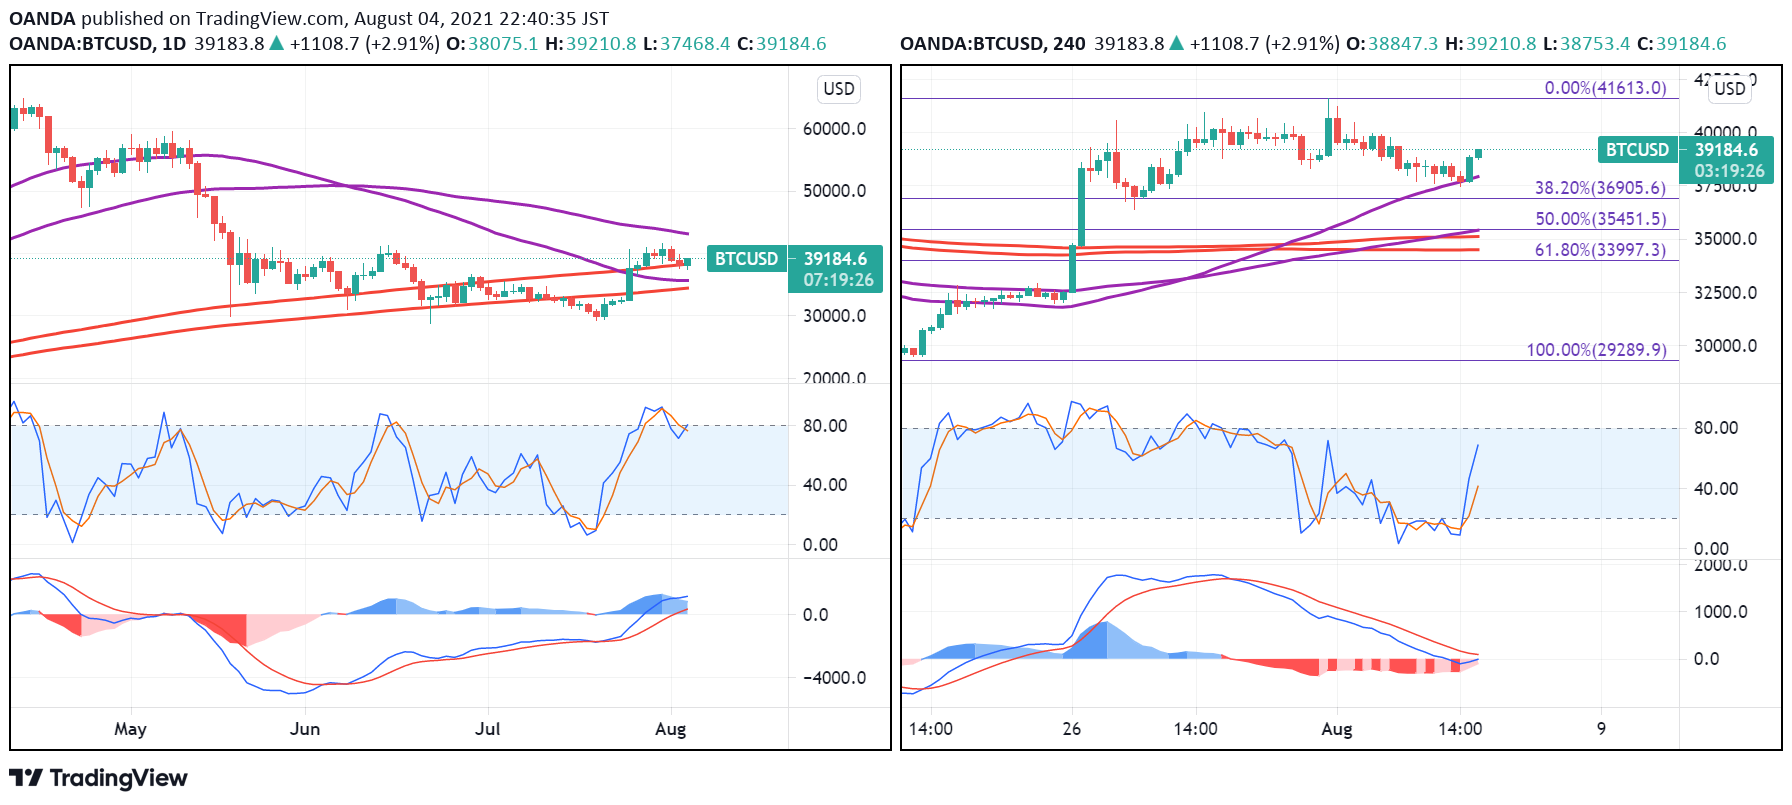
Bitcoin has pulled back in recent days, with the price falling from around $41,000 to roughly $37,500. The move came just as many were speculating that cryptos are back after their late spring /early summer slump. Should the short-lived rally be a source of concern or encouragement?
While arguably surprising, it strikes me as being far from concerning. The pullback hasn’t gathered much momentum and key levels remain below, levels that would recognise the moves as corrective rather than anything more significant.
The 50/61.8 fib zone strikes me as being a very important area that, should price get that far, could see significant support.
And we may not even get that far, with the crypto already seeing some interest around the upper end of the moving average bands.
With that in mind, bitcoin looks in a good position and only a move below those key fib levels would suggest otherwise.