

Sample Category Title
EUR/JPY Weekly Outlook
EUR/JPY stayed in range of 128.58/131.07 last week and outlook is unchanged. Initial bias remains neutral this week first and deeper fall is mildly in favor. On the downside, break of 128.85 will resume the fall from 134.11 to 127.07 resistance turned support next. On the upside, break of 131.07 resistance will argue that choppy fall from 134.11 has completed. Intraday bias will be turned back to the upside for 132.68 resistance first.
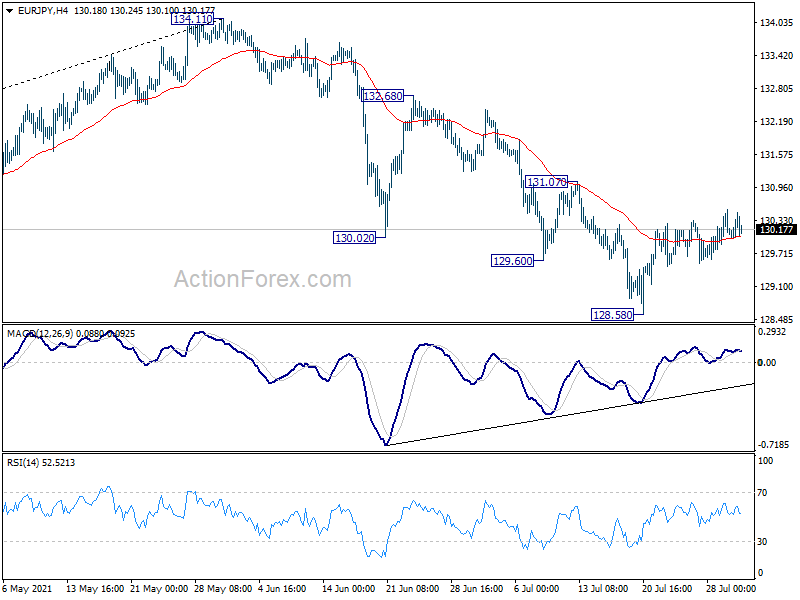
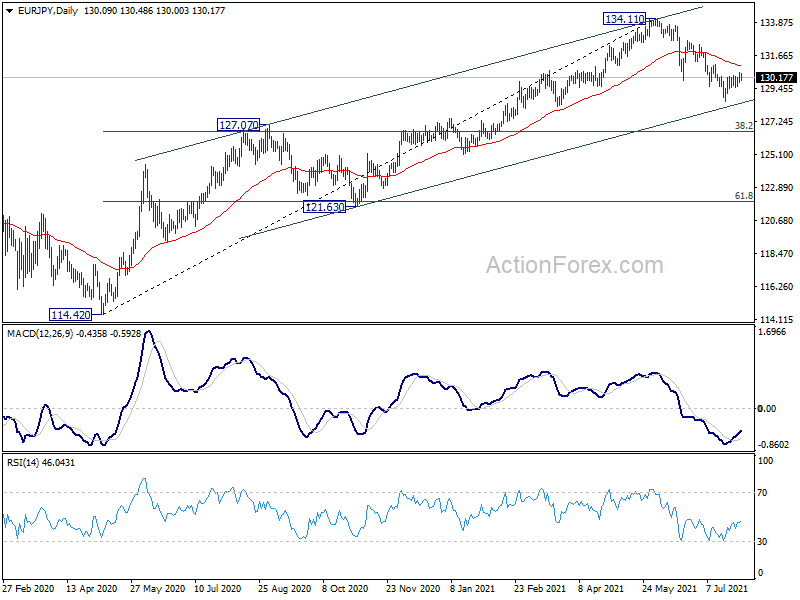
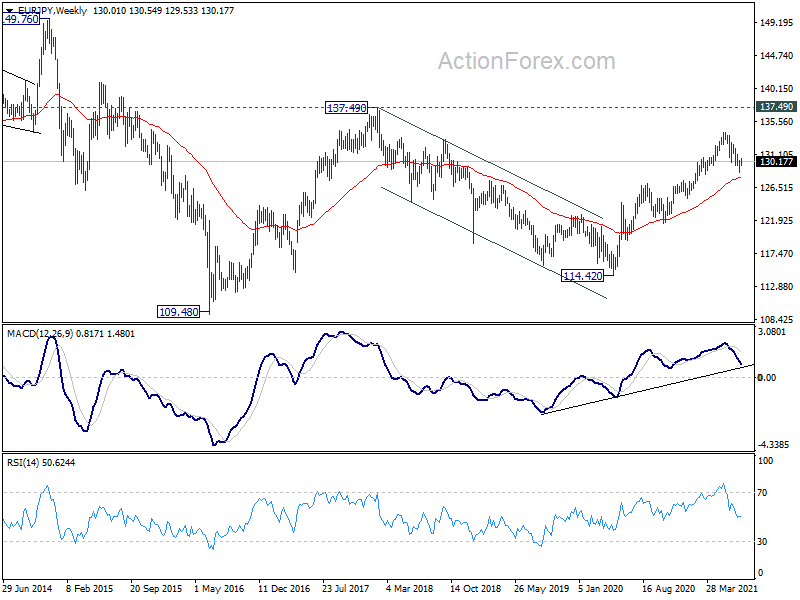
In the bigger picture, rise from 114.42 is seen as a medium term rising leg inside a long term sideway pattern. As long as 127.07 resistance turned support holds, further rise is still expected to retest 137.49 (2018 high). However, firm break of 127.07 will argue that the medium term trend has reversed, and open up the case for retesting 114.42.
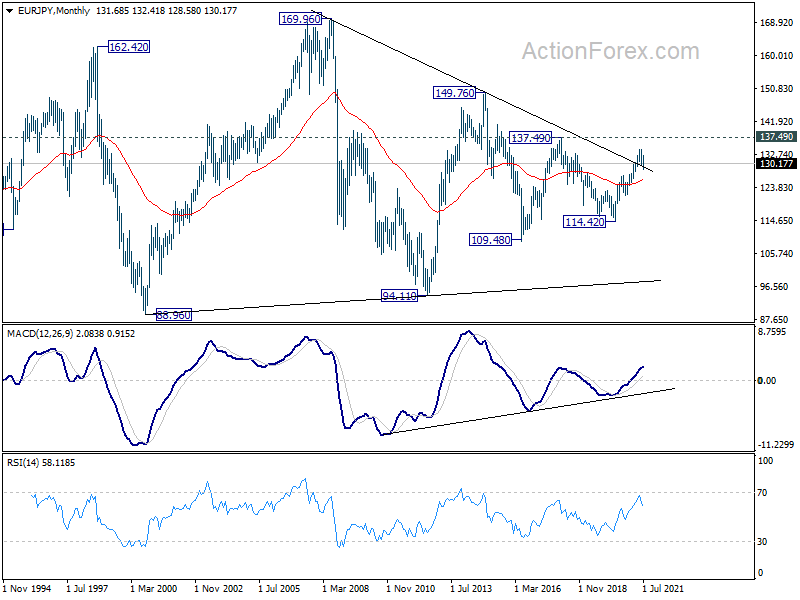
In the long term picture, EUR/JPY is staying in long term sideway pattern, established since 2000. Another rising leg in progress for 137.49 resistance and above.
EUR/GBP Weekly Outlook
EUR/GBP edged lower to 0.8498 last week but recovered since then. Initial bias remains neutral this week first. On the downside, break of 0.8498 support will resume the choppy corrective fall from 0.8718 towards 0.8470 low. On the upside, break of 0.8555 minor resistance will turn bias back to the upside for 0.8668 resistance instead.
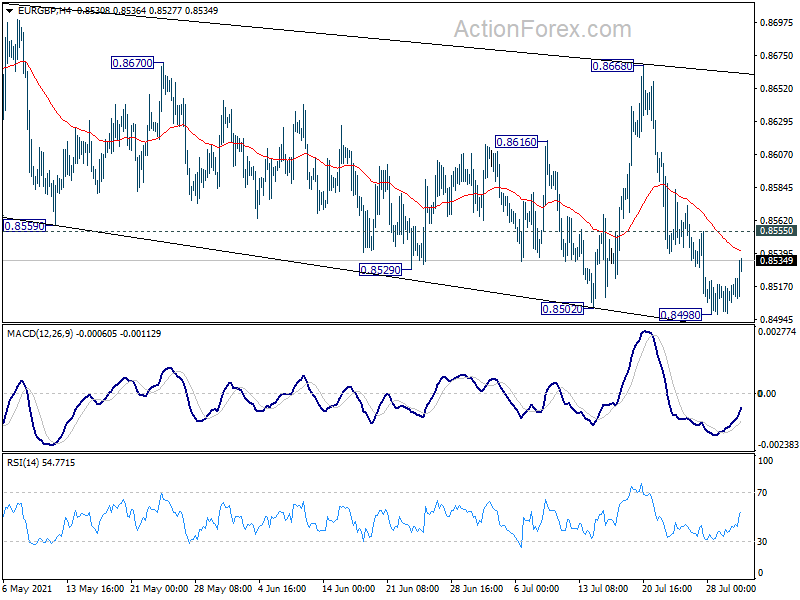
In the bigger picture, price actions from 0.9499 are still seen as developing into a corrective pattern. Deeper fall could be seen as long as 0.8718 resistance holds. However, firm break of 0.8717 would argue that a medium term bottom was already formed. Stronger rise would be seen to 0.8861 support turned resistance to confirm completion of the corrective pattern.
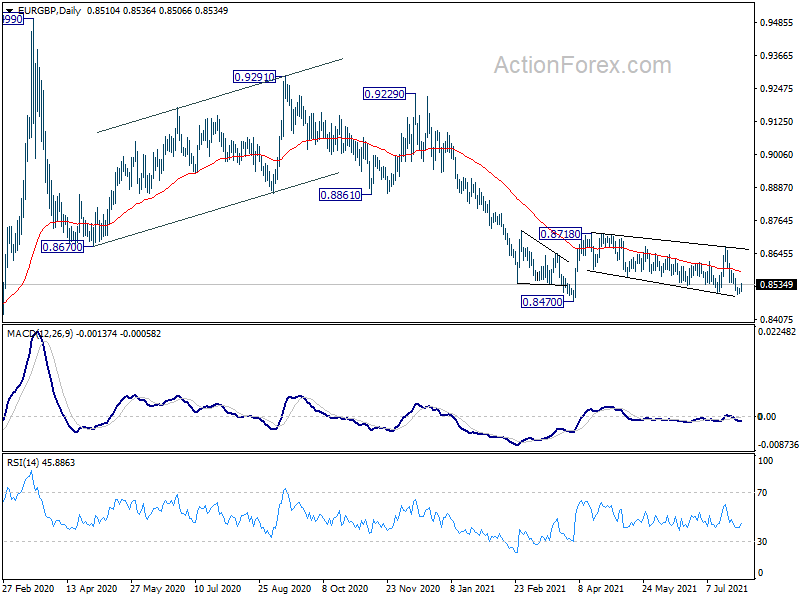
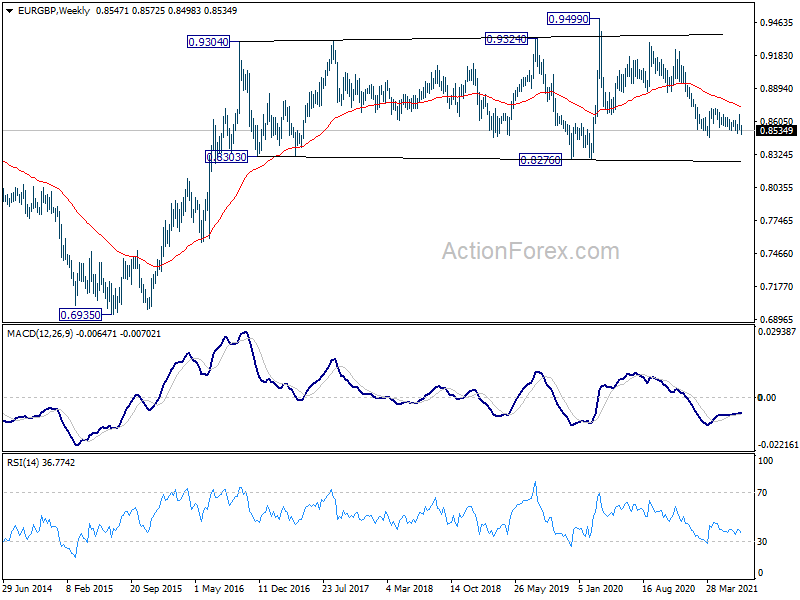
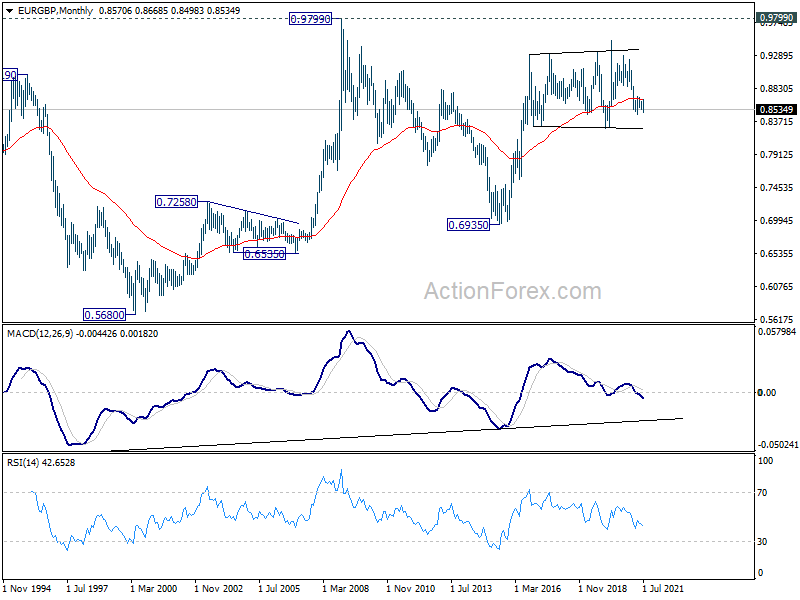
In the long term picture, outlook will stay bullish as long as 0.8276 support holds. Break of 0.9499 is in favor at a later stage, to resume the up trend from 0.6935 (2015 low).
EUR/AUD Weekly Outlook
EUR/AUD's rise from 1.5250 resumed last week and hit as high as 1.6174. Initial bias is now on the upside for 1.6827 resistance next. On the downside, break of 1.5925 support is needed to indicate short term topping. Otherwise, near term outlook will stay mildly bullish in case of retreat.
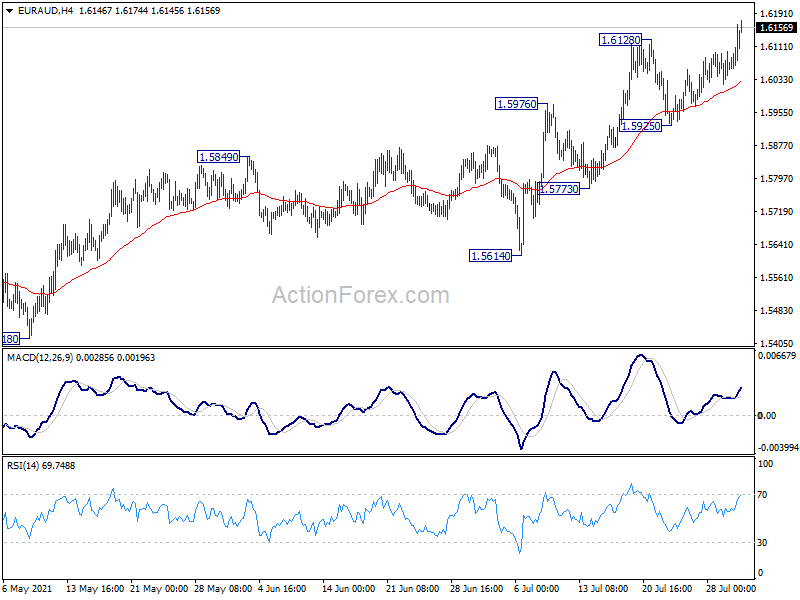
In the bigger picture, a medium term bottom was formed at 1.5250, on bullish convergence condition in daily MACD. Rise from 1.5250 is currently seen as a correction to the down trend from 1.9799 first. Stronger rise would be seen to 38.2% retracement of 1.9799 to 1.5250 at 1.6988 next. We'd tentatively expect strong resistance from there to limit upside, at least on first attempt.
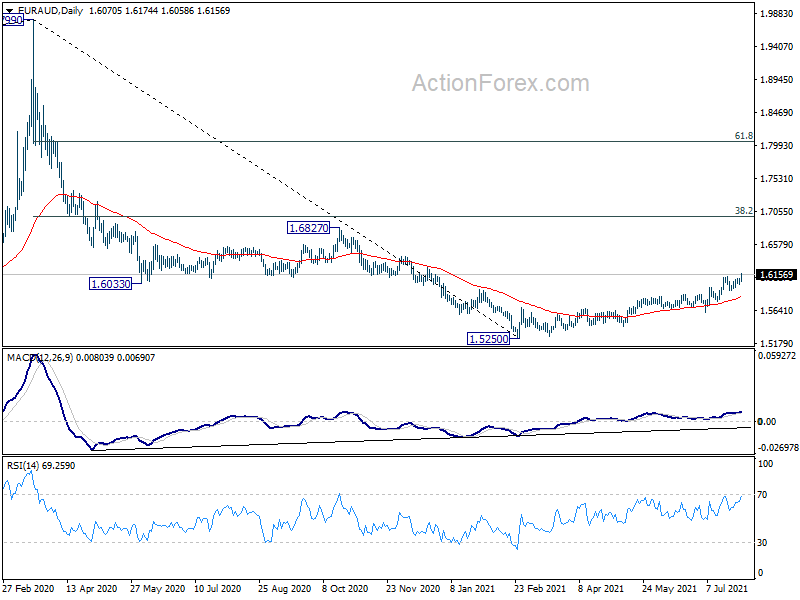
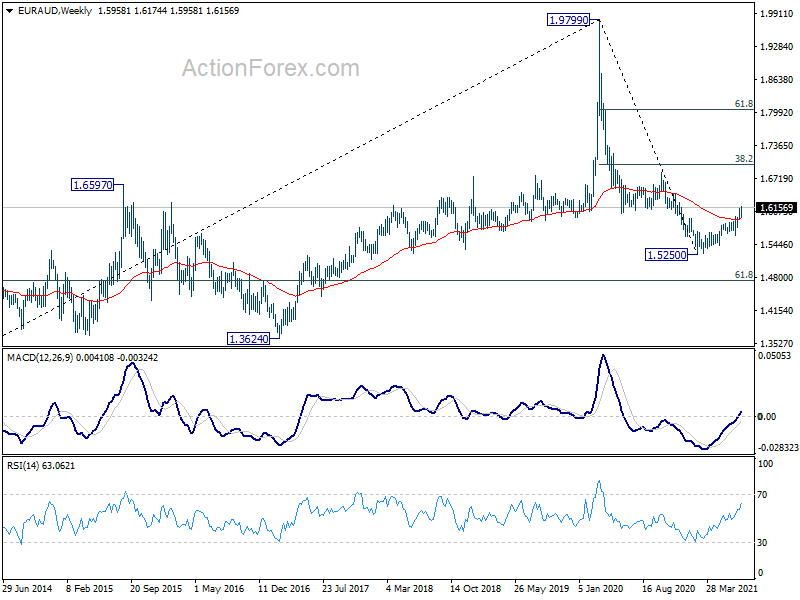
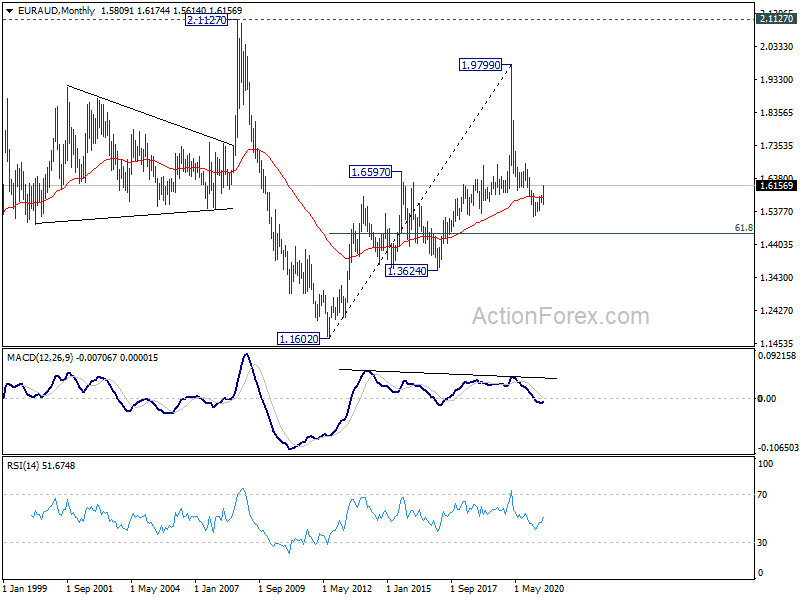
In the longer term picture, rise from 1.1602 (2012 low) should have already completed with three waves up to 1.9799 (2020 high). Fall from there is seen as a medium term to long term down leg as a long term down trend, or a sideway pattern. We'll assess the odds again at a later stage.
EUR/CHF Weekly Outlook
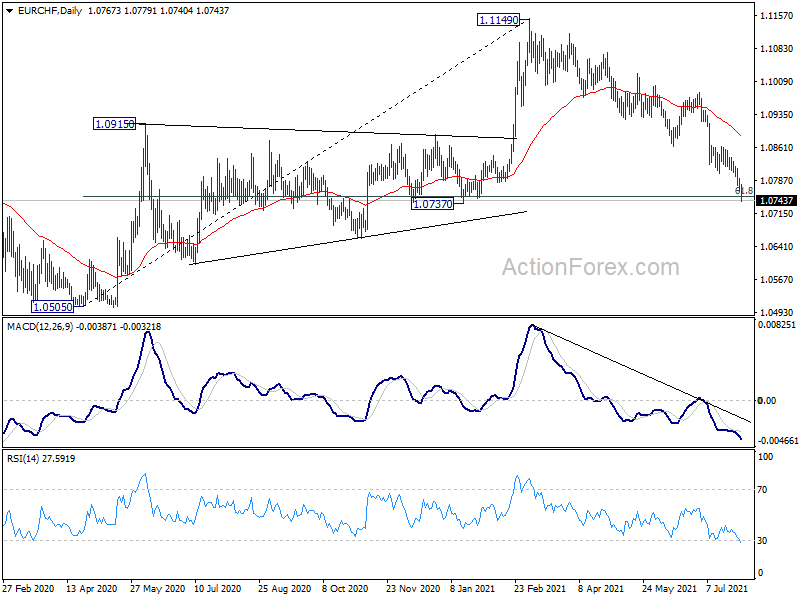
EUR/CHF's down trend from 1.1149 resumed last week and reached as low as 1.0740. Initial bias remains on the downside this week. Sustained trading below 1.0737/0751 support zone will pave the way to retest 1.0505 low. On the upside, break of 1.0802 support turned resistance is needed to indicate short term bottoming. Otherwise, outlook will stay bearish in case of recovery.
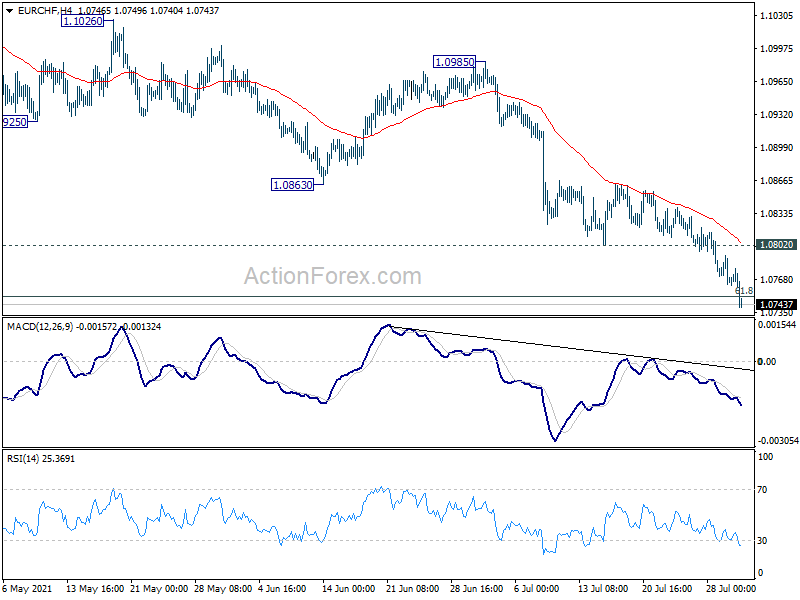
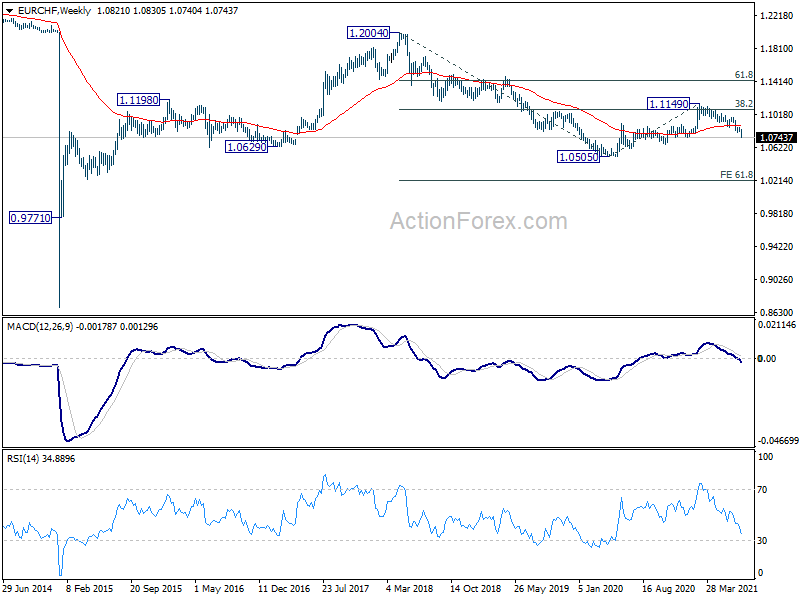
In the bigger picture, rebound from 1.0505 (2020 low) should have completed at 1.1149 already. The three wave corrective structure argues that the downtrend from 1.2004 (2018 high) is not over yet. Medium term outlook will now stay bearish as long as 1.1149 resistance holds. Break of 1.0505 low would be seen at a later stage.
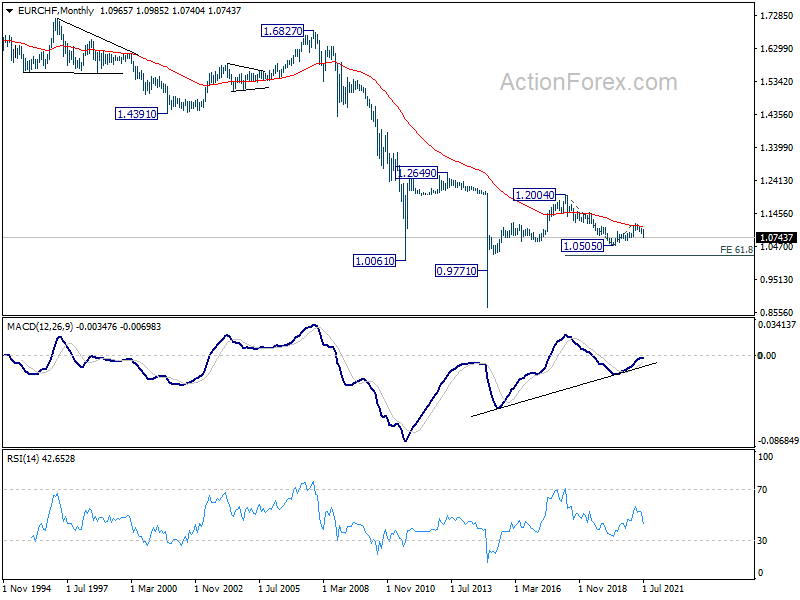
In the long term picture, rejection by 55 month EMA (now at 1.1068) retains long term bearishness. Break of 1.0505 low will resume down trend to 61.8% projection of 1.2004 to 1.0505 to 1.1149 at 1.0223.
More Downside for Dollar and Aussie, Swiss Franc Outperforms
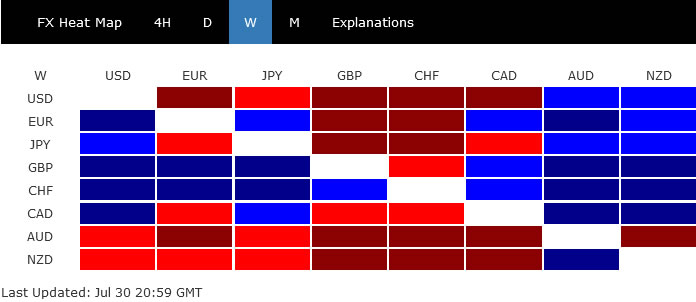
Dollar's selloff caught much attention last week, but slowed towards the end. Traders are holding their bets for now, awaiting the coming batch of July data. Indeed, Australian Dollar was the worst performer, mainly on RBA QE expectations, and partly on risk aversion in China and Hong Kong. New Zealand Dollar was the second worst, followed by the greenback.
Sterling was in the leading post much of the week on improving delta variant infection numbers. Though, Swiss Franc secured the top spot with a late dash. Euro was also firm, indicating that European majors are having an upper hand for now. Yen and Canadian Dollar ended mixed only.
We'd argue that there is prospect of more Dollar weakness ahead as the near term trend is reversing, even though not confirmed. But Aussie would be a currency to avoid in case of more Dollar decline. Swiss Franc is more likely a better option than not, considering it's relative strength against Euro and Sterling.
Dollar dropped notably but hesitated ahead of key data
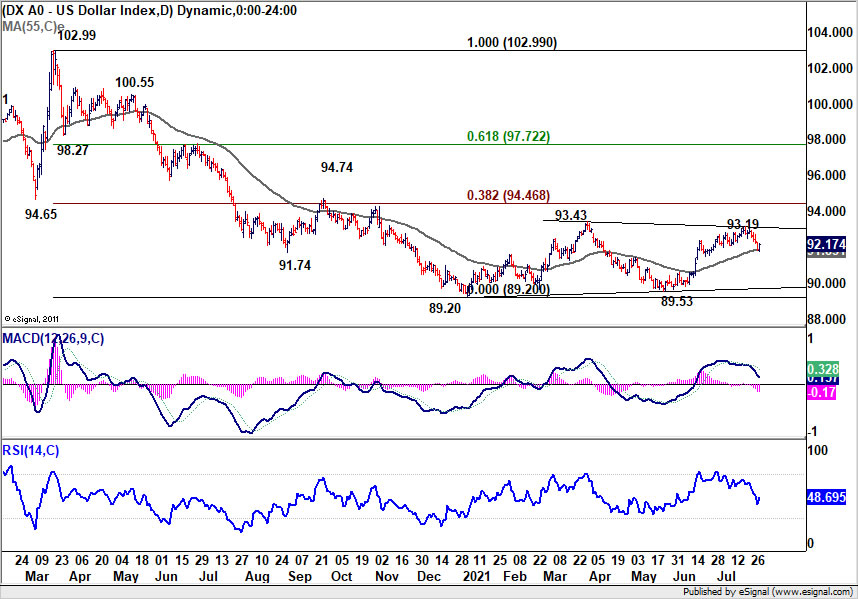
Dollar dropped notably last week but sellers seemed to hesitate towards the end. FOMC acknowledged that "the economy has made progress toward" the maximum employment and price stability goals. But chair Jerome Powell noted the job markets still had "some ground to cover" while rate hikes were "a ways away". There were ongoing discussions over tapering, without further hints on the timing of actually doing in. The greenback will look into the batch of key economic data like ISMs and non-farm payrolls this week for the next move.
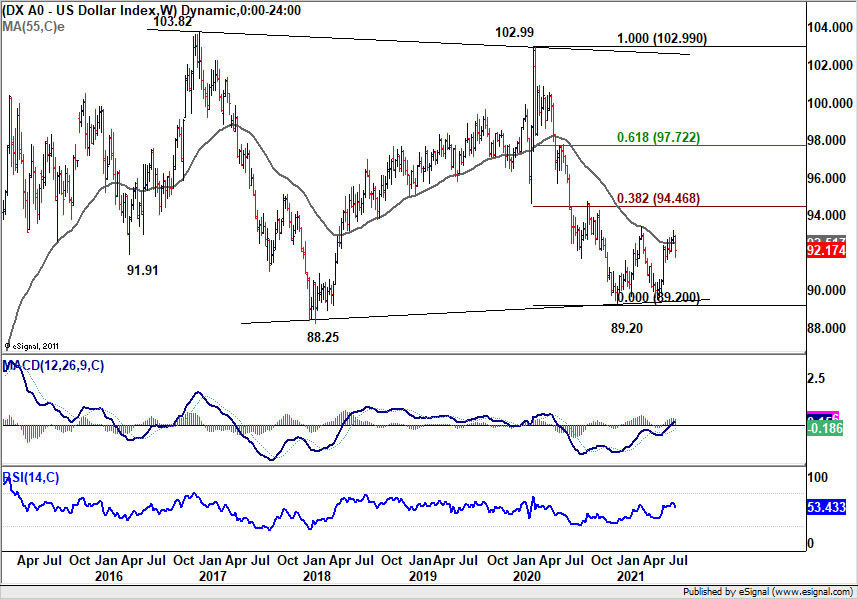
Dollar index's fall to 91.78 suggests short term topping 93.19. Immediate focus is now on 55 day EMA (now at 91.85) this week. Sustained trading below there should confirmation completion of the rise from 89.53. More importantly, the consolidation pattern from 89.20 could have completed in a three-wave structure too. Deeper decline would be seen back to retest 89.20/53 support zone.
On the other hand, rebound from current level could extend the consolidation pattern with another rise through 93.43 resistance. But even in this case, we'd expect strong resistance from 38.2% retracement of 102.99 to 89.20 at 94.46 to limit upside.
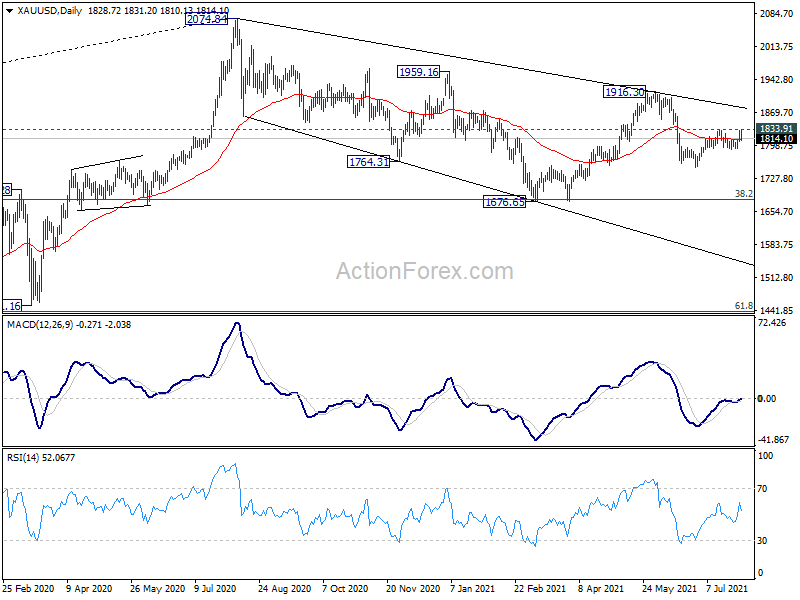
Gold failed 1833.91 resistance on first attempt
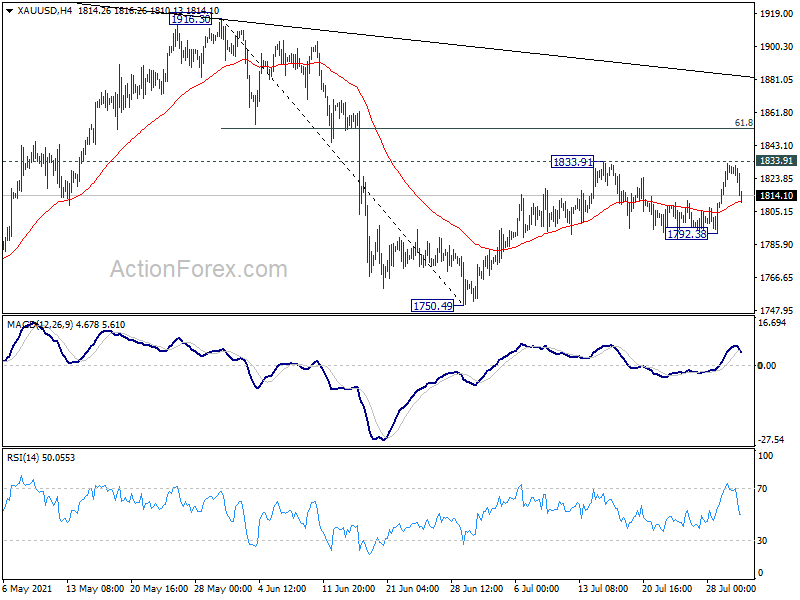
Gold failed the attempt to break through 1833.91 resistance last week and retreated notably before close. Some support could be seen around 4 hour 55 EMA (now at 1810.63). Strong rebound from current level, followed by break through 1833.91, would confirm resumption of whole rise from 1750.49. Next target is 61.8% retracement of 1916.30 to 1750.49 at 1852.96. Sustained break there would bring strong rise through 1916.30 resistance. Such development, if happens, would double confirm Dollar's near term bearishness.
Aussie to underperform as RBA would increase QE, rather than taper
In terms of buying against Dollar (should the selloff intensify), Aussie is likely a currency to avoid. Due to extended lockdown in New South Wales, there are increasing expectations that RBA would raise the weekly asset purchases to AUD 6B, instead of tapering. The announcement could come as early as this week.
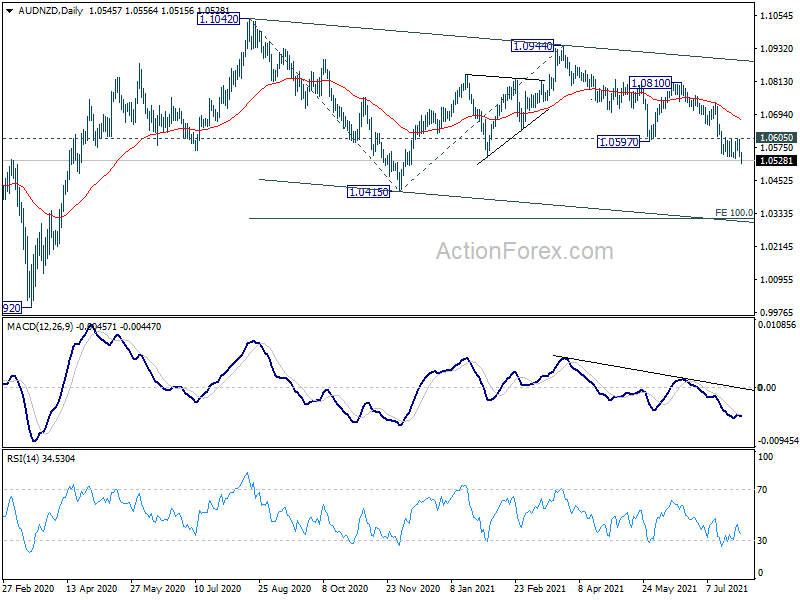
Aussie is clearly weaker against other commodity currencies, not to mention Europeans. AUD/NZD's decline resumed after some consolidations and hit as low as 1.0515 so far. Near term outlook will stay bearish as long as 1.0605 resistance holds. Fall from 1.0944 is seen as the third leg of the pattern from 1.1042. Deeper decline would be seen to 1.0415 support next.
If divergence between RBA and RBNZ continues, AUD/NZD could even fall further, in the medium term, to 100% projection of 1.1042 to 1.0415 from 1.0944 at 1.0317 before forming a bottom.
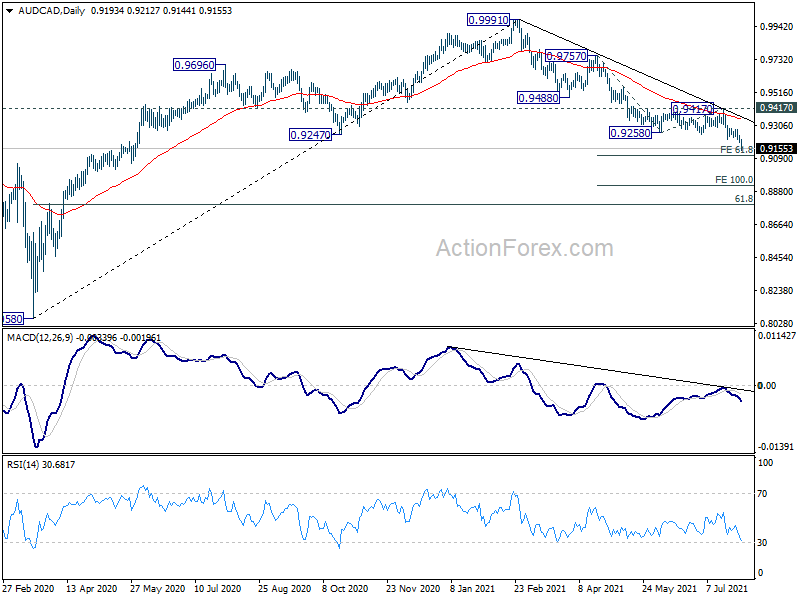
AUD/CAD finally broke with 0.9247 support decisively last week and hit as low as 0.9144. Rise from 0.8058 should have completed at 0.9991. For the near term, there might be some support from 61.8% projection of 0.9757 to 0.9258 from 0.9412 at 0.9109. But outlook will stay bearish as long as 0.9417 resistance holds. AUD/CAD could extend further to 61.8% retracement of 0.8058 to 0.9991 at 0.8796, in the medium term, before finding a bottom.
Swiss Franc buying came in ahead of August
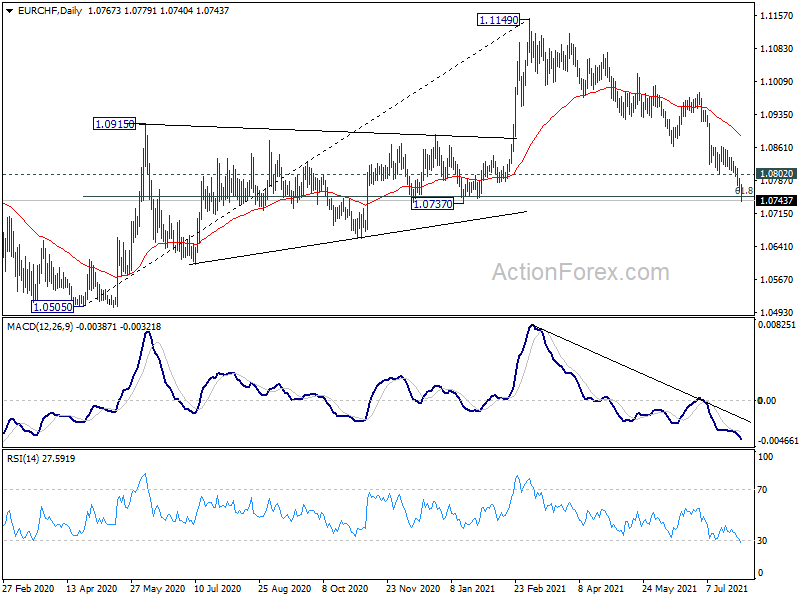
On the other hand, Swiss Franc appears to be strengthening ahead of the traditionally volatile August. EUR/CHF extended the decline from 1.1149 to as low as 1.0740. Oversold condition in daily RSI is not slowing it down, but daily MACD actually suggests downside acceleration.
Immediate focus is now on 1.0737 cluster support (61.8% retracement of 1.0505 to 1.1149 at 1.0751). Sustained trading below this level this week would pave the way back to retest 1.0505 low. And, in any case, near term outlook will stay bearish as long as 1.0802 support turned resistance holds.
GBP/CHF's outlook is less bearish then EUR/CHF. Yet the rejection by 55 day EMA (now at 1.2682) and the steep fall on Friday argues that it's resume to resume the decline from 1.3070. Near term focus will be on 1.2498 support. Break there will resume the fall from 1.3070 to 1.2259 resistance turned support, which is close to 38.2% retracement of 1.1107 to 1.3070 at 1.2320. We'll see if GBP/CHF would overcome this key support zone on next fall.

USD/CHF Weekly Outlook
USD/CHF's fall from 0.9273 resumed last week and reached as low as 0.9037. The development also affirm that rebound form 0.8925 has completed. Initial bias stays on the downside this week for retesting 0.8925 support. On the upside, above 0.9116 support turned resistance will mix up the near term outlook and turn intraday bias neutral first.
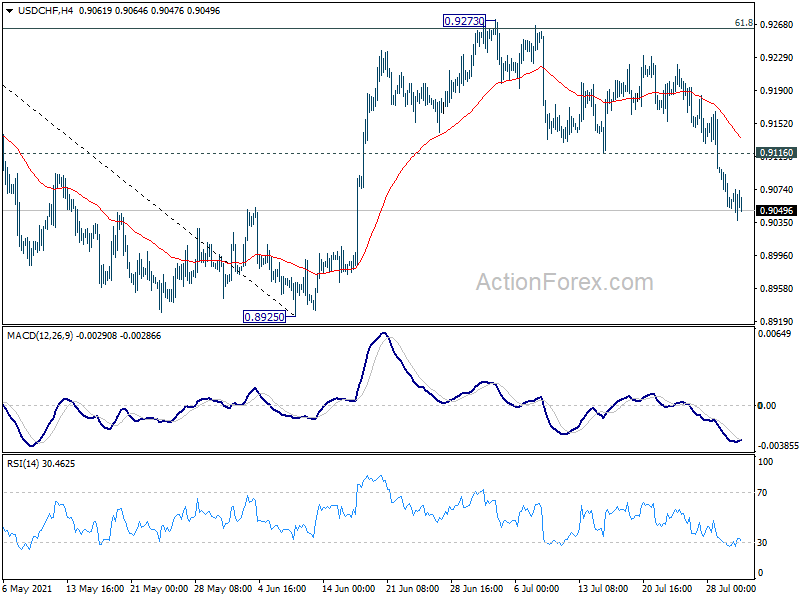
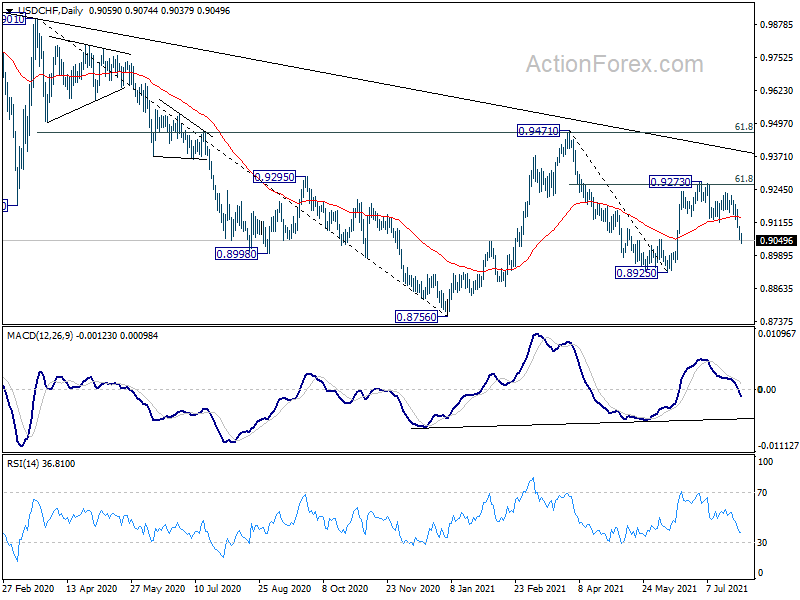
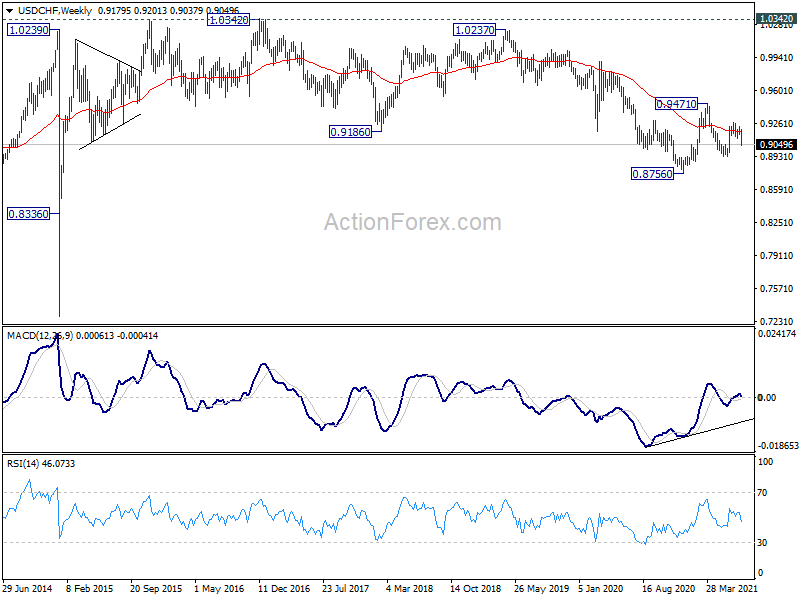
In the bigger picture, failure to sustain above 55 week EMA (now at 0..9183) affirms medium term bearish in USD/CHF. Break of 0.8925 support should resume the whole decline form 1.0342 (2016 high) through 0.8756 low. For now, risk will stay on the downside as long as 0.9273 resistance holds, in case of rebound.
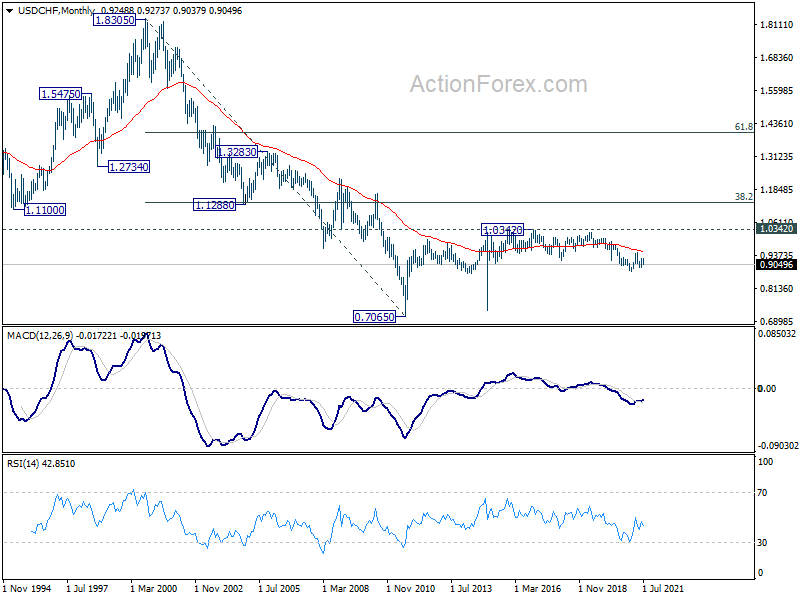
In the long term picture, price actions from 0.7065 (2011 low) are currently seen as developing into a long term corrective pattern, at least until a firm break of 1.0342 resistance.
Summary 8/2 – 8/6
Monday, Aug 2, 2021
[php_everywhere instance="1"]
Tuesday, Aug 3, 2021
[php_everywhere instance="2"]
Wednesday, Aug 4, 2021
[php_everywhere instance="3"]
Thursday, Aug 5, 2021
[php_everywhere instance="4"]
Friday, Aug 6, 2021
[php_everywhere instance="5"]
Weekly Economic & Financial Commentary: “Progress” Has Been Made, But Is It Enough To Taper?
Summary
United States: Demand Continuing to Outstrip Supply
- Although the headline rate of Q2 GDP came in softer than expectations, part of that was due to supply chain problems as businesses had to draw down inventories to meet demand, resulting in a drag on growth.
- Consumer spending exceeded expectations and the latest consumer confidence figures rose to a post-pandemic high.
- Next week: Construction Spending (Monday), ISM Manufacturing (Monday), Employment (Friday)
International: Eurozone Enjoying an Economic Recovery Sweet Spot
- Eurozone Q2 GDP rose more than expected, with particularly large gains for Italy and Spain, while confidence surveys suggest that momentum carried into at least the early part of the third quarter. Meanwhile, CPI inflation quickened only moderately in July, while core CPI actually slowed. Given this favorable growth and inflation mix, we expect the European Central Bank to maintain its accommodative monetary policy and, indeed, ease policy further by December.
- Next week: China PMIs (Saturday), Brazil monetary policy announcement (Wednesday), Bank of England policy announcement (Thursday)
Interest Rate Watch: "Progress" Has Been Made, But Is It Enough To Taper?
- The Federal Open Market Committee (FOMC) announced no major policy changes at the conclusion of its two-day meeting on July 28, leaving the target range for the federal funds rate unchanged at 0.00% to 0.25%, and maintaining its monthly purchase rate of Treasury securities and mortgage-backed securities at $80 billion and $40 billion, respectively.
Credit Market Insights: Millennial Market Makers
- Despite high home prices and elevated debt burdens, homeownership among younger cohorts is starting to pick up meaningfully in the post-pandemic economy.
Topic of the Week: Infrastructure Deal Is the Appetizer to the Fall Fiscal Feast
- This week, Congress took a major step toward enactment of the $559 billion bipartisan infrastructure deal. The Senate voted 67-32 in favor of clearing an important procedural hurdle to eventual passage.
U.S. Review
Demand Continuing to Outstrip Supply
Despite a few misses on the headline numbers, economic data this week highlighted a theme of demand continuing to outstrip supply and ongoing slack in the labor market. In a way, this is the opposite problem of the prior cycle, when policymakers scratched their heads over why inflation remained tepid even amid the lowest unemployment rate in decades. At the press conference following the latest Fed meeting, it was clear from the Fed chair’s comments that policymakers are conflicted that inflation is on a tear even as slack remains in the labor market. When it comes to the tapering of asset purchases, there were still “a range of views” among members of the FOMC.
The Phillips curve tells us that inflation and unemployment should have a stable and inverse relationship. It stands to reason that a faster-growing economy should stoke inflation, while leading to less unemployment. But the past decade or so has demonstrated that this is not always how it plays out in reality. The economic data this week continued to reflect the labor market’s slow progress and the ongoing challenges of soaring demand amid worsening supply chain constraints. Initial jobless claims are now higher than at the end of May, and the number of those receiving ongoing jobless benefits also rose in the latest figures.
New home sales fell to their pre-COVID pace. Our best read here is that some home builders are limiting sales in new communities due to ongoing supply shortages of building materials, HVAC equipment and appliances. That is not to lay all the blame on supply chain woes, as sky-high prices play a role here as well. The drop in sales is helping inventory ramp back up. At 6.3 months' worth of housing inventory, supply has almost doubled from a low of 3.5 months last summer. We look for sales and new home construction to rebound modestly from their current levels and for new home prices to moderate, as lower lumber prices allow builders to boost construction of more modestly priced homes.
Demand Strength Evident in This Week's Data
Durable goods orders came in weaker than expected in June with an overall gain of just 0.8%, well short of the 2.2% consensus forecast, but the fact that prior month figures were revised higher takes some sting out of the miss. This was particularly true for core capital goods orders, which came in closer to consensus estimates, rising 0.5% in June versus an expected 0.7% on the heels of an upward revision that lifted May's scant 0.1% gain to a respectable pickup of 0.5%. After having been beset by the combined challenges of aircraft safety concerns and the pandemic, which for a while sapped demand for travel, domestic manufacturing of aircraft is rebounding. Nondefense aircraft orders have risen by double digits in percentage terms in each of the past three months.
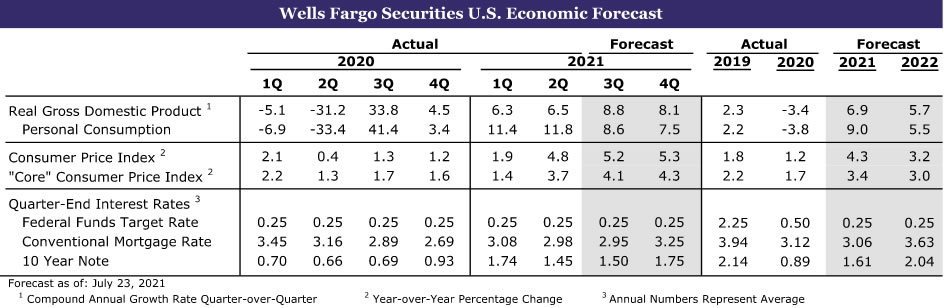
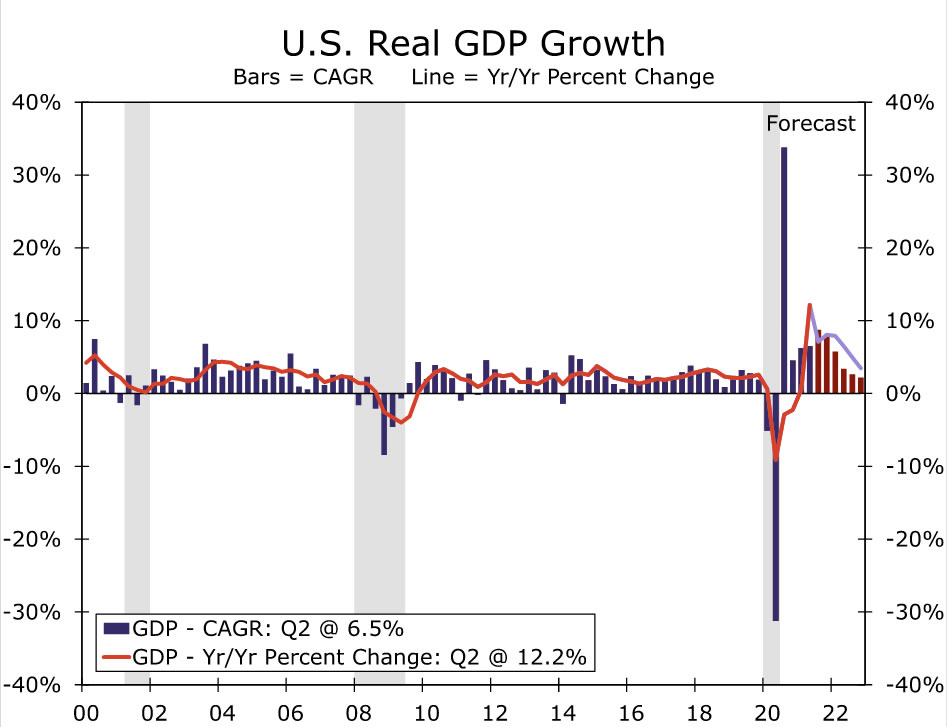
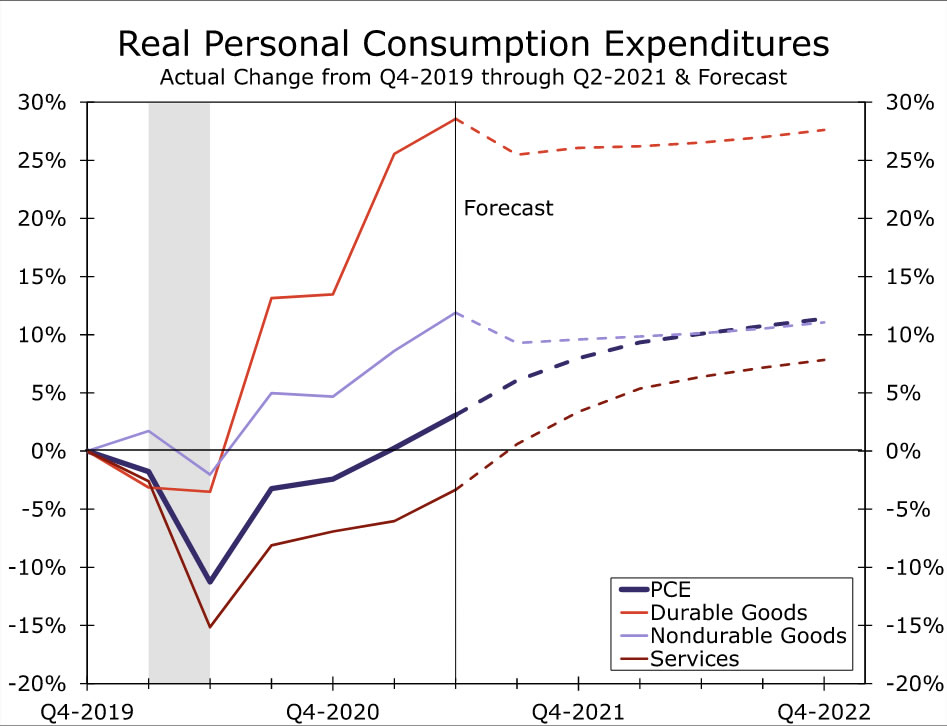
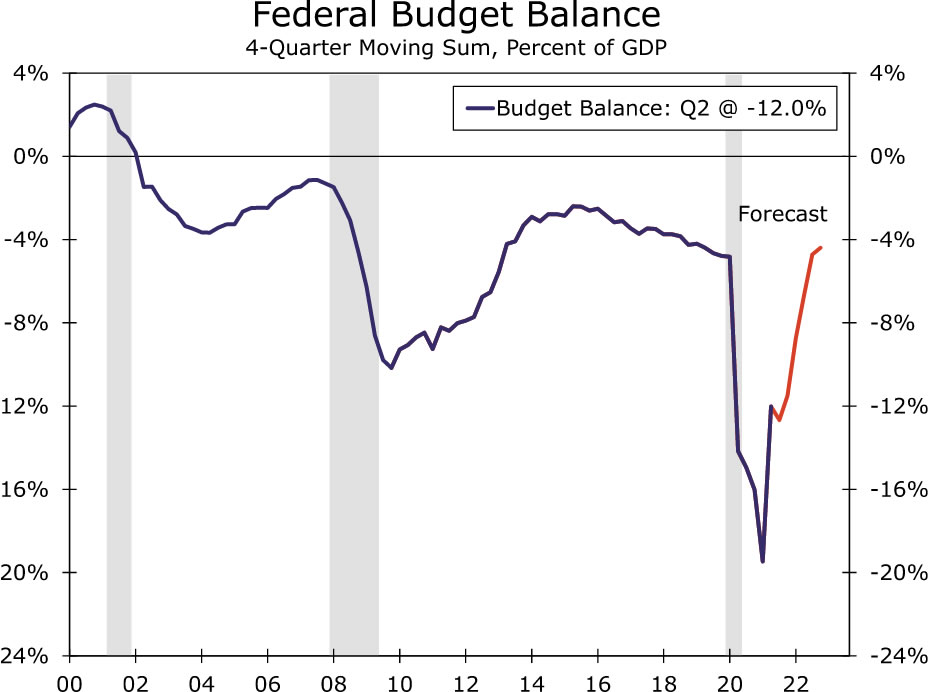
The orders' strength bodes well for equipment spending, which we learned in this week’s GDP report has now grown at a double-digit percentage pace in each of the past four quarters. Although the headline real GDP growth rate of 6.5% was short of expectations, the miss was largely attributable to drags from inventories and trade (see chart). Growth in the second quarter was driven largely by consumer spending. Real personal consumption expenditures (PCE) shot up 11.8%, which was stronger than most analysts had expected, and every major category of spending posted solid gains. Specifically, spending on durable goods rose 9.9%, non-durable goods jumped 12.6% and services surged 12.0%. This robust growth in real PCE reflects the reopening of the economy that occurred in the second quarter and the fiscal relief measures that put money in consumers' pockets (see chart).
Consumers are feeling more upbeat about their own short-term financial prospects as the share of those who expect their income to increase rose to 20.6%, the highest reading since the pandemic struck. These brighter income prospects may stem from a perception that labor market dynamics are improving. When asked about the labor market, the share of respondents seeing jobs as plentiful also rose to a new post-pandemic high of 54.9%, while the share of those who see jobs as hard-to-get remained at a very low 10.5%. As additional jobless benefits expire and kids return to school in coming months, these measures will offer early clues about how healthy job growth will be in the fall.
U.S. Outlook
Construction Spending • Monday
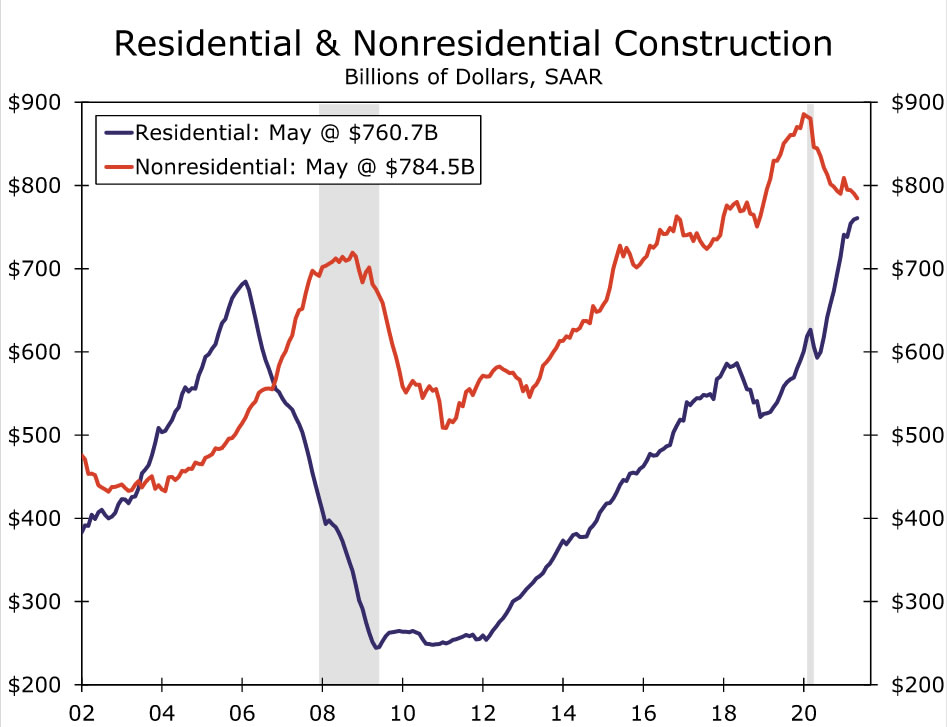
During May, total construction spending declined 0.3% amid a slip in nonresidential activity and modest improvement in the residential sector. The weakness seen on the nonresidential side of the ledger is not surprising considering the sector continues to absorb the impacts of the pandemic. Warehouse construction remains a bright spot, but office, retail, lodging and education projects are struggling to get back on track. Meanwhile, residential construction continues to grow at a fairly strong pace as home builders rush to meet robust demand for single-family homes. The rapid recovery in apartment leasing as workers return to offices has encouraged developers to move forward with multifamily projects.
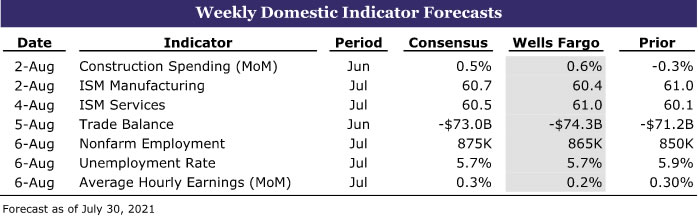
Looking ahead, overall construction spending looks set to climb higher in June despite the substantial headwinds of soaring building material costs and shortages of qualified labor. New nonresidential building starts have picked up in recent months, which is a harbinger for stronger spending in coming months. Residential activity appears poised for further improvement. Housing starts easily topped expectations and rose 6.3% to a 1.6 million-unit pace during June. Overall, we expect total construction outlays rose 0.6% during June.
ISM Manufacturing • Monday
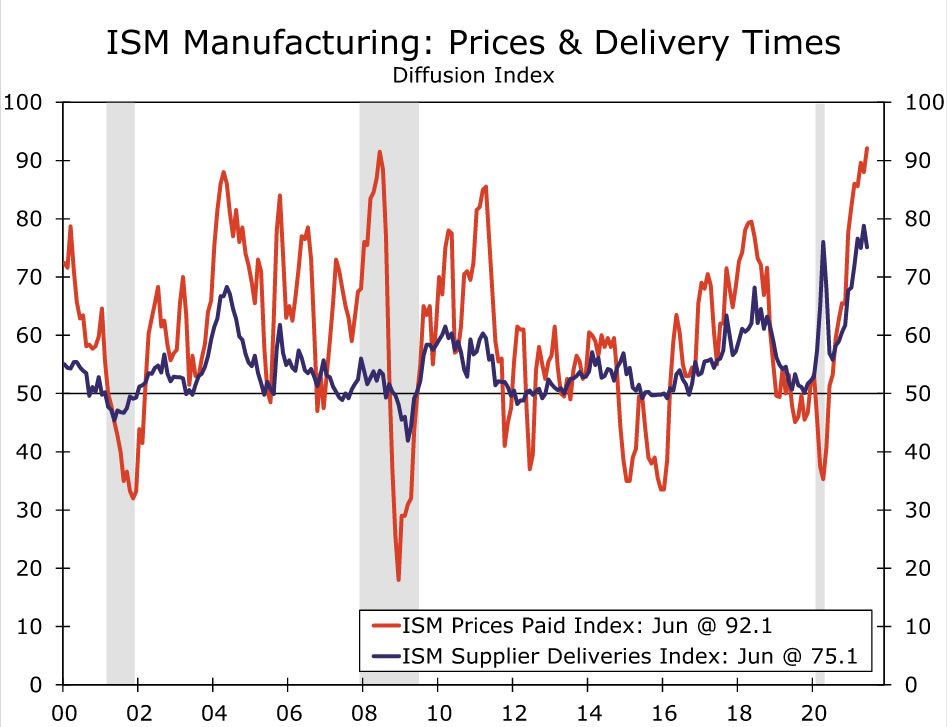
The ISM Manufacturing index slipped to a still-elevated reading of 60.6 during June. New orders and production both remain strong, but difficulties sourcing raw materials and finding workers have become massive constraints for producers. The employment component of the headline index fell into contraction territory during the month, which reflects just how pervasive labor shortages have become throughout the entire factory sector. What's more, supply chain bottlenecks have rapidly raised the cost of procuring key input materials. During June, the prices paid component jumped to the highest level since 1979.
Supply-side headwinds notwithstanding, demand remains robust, which should support manufacturing activity for the foreseeable future. The Fed's regional surveys of manufacturers generally came in strong during July, with the Empire, Kansas City and Richmond surveys beating consensus expectations.There are also tentative signs that some supply bottlenecks are starting to ease, as evidenced by the incremental improvement in wait times for supplier deliveries during June. Still, we expect a modest decline in the ISM for July, as hiring difficulties and supply chain bottlenecks continue to weigh on manufacturing activity.
Employment • Friday
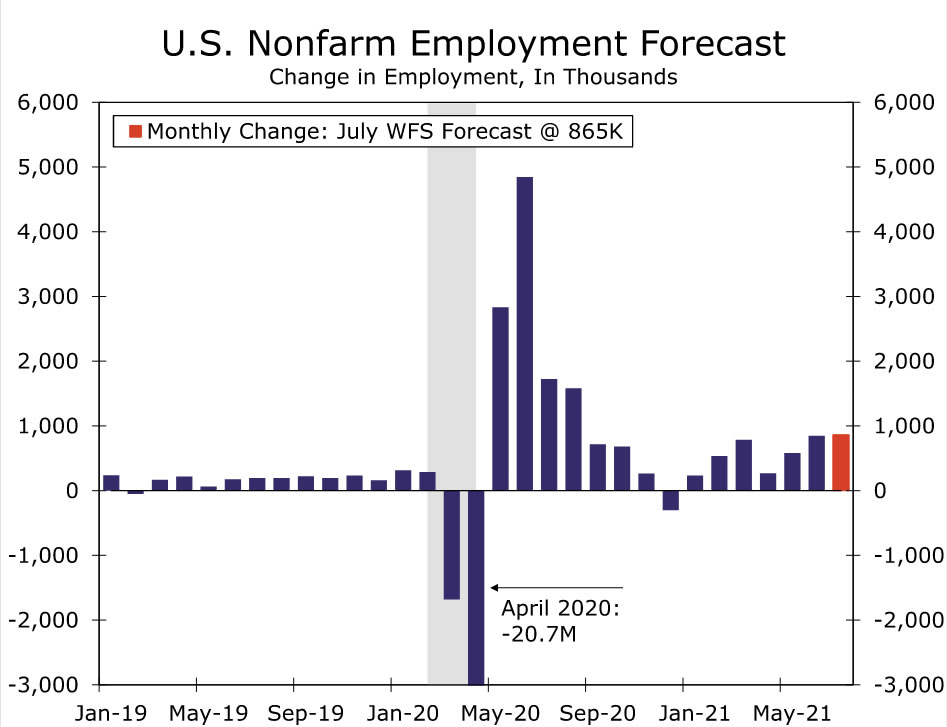
The labor market recovery is gaining momentum. Employers added 850,000 new jobs during June, the strongest gain since last August. Most major industries added to payrolls during the month, particularly in the leisure and hospitality, wholesale trade and transportation, retail and professional services industries. Hiring in the public sector also picked up notably. The unemployment rate edged up to 5.9%, but there was a jump in labor force participation among prime-age workers. The monthly jump in payrolls comes as many businesses are raising wages in order to attract and retain workers amid widespread labor shortages. Average hourly earnings rose 0.3% during June, with some of the largest gains occurring in lower-paying industries.
Worker shortages are clearly still holding back the pace of hiring, but those constraints should continue to ease over the next few months. The recent improvement in prime-age participation indicates that an abundance of job openings and rising wages are coaxing some workers off the sidelines. Even with the recent uptick in COVID case counts, schools appear set to reopen, which should lessen childcare issues. The extra $300 in federal unemployment benefits is scheduled to lapse in September, and many states have already withdrawn from the program. Bearing this is mind, we expect employers added 865,000 jobs in July.
International Review
Eurozone Enjoying an Economic Recovery Sweet Spot
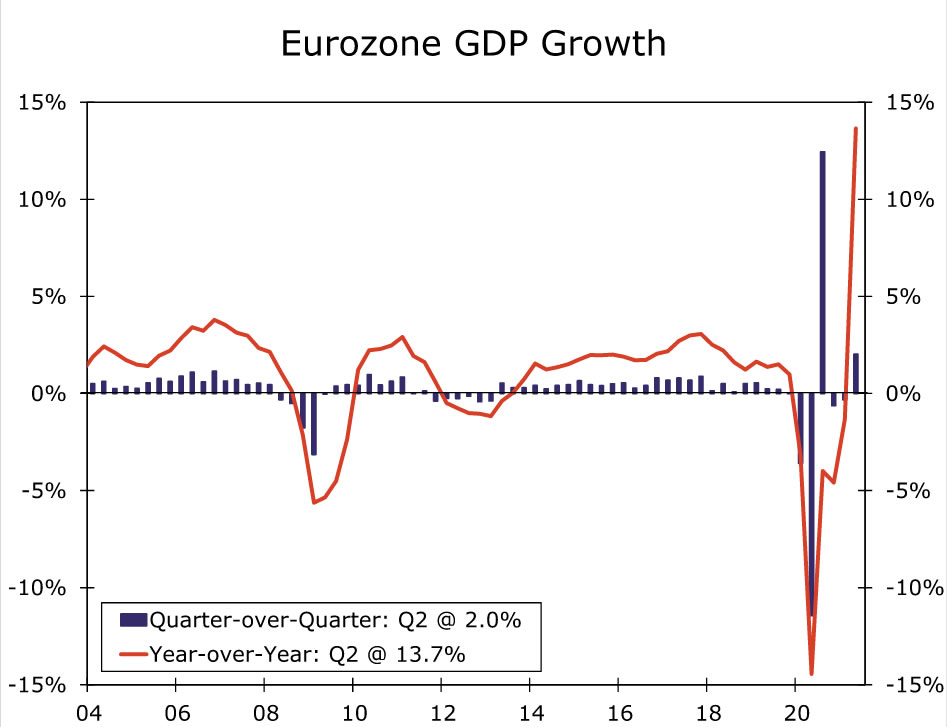
This week saw a trifecta of good news regarding the renewed Eurozone economic expansion. Eurozone Q2 GDP rose 2.0% quarter-over-quarter and jumped 13.7% year-over-year, the latter boosted by base effects. Not only was the outcome stronger than expected, but the sequential quarterly increase represented a return to growth after two straight quarters of contraction. Economic growth was also fairly broad-based across the region. With respect to the region's larger economies, German GDP rose 1.5% quarter-over-quarter, French GDP rose 0.9%, Italian GDP rose 2.7% and Spanish GDP rose 2.8%. In terms of the countries that released details on the breakdown of growth, France saw Q2 household consumption rise 0.9% quarter-over-quarter, while Spain's Q2 household consumption surged 6.6%.
In addition to the confirmation of strong growth in Q2, survey data suggest that activity remained firm at least during the early part of the third quarter. Eurozone July economic confidence rose more than expected to 119.0, a record high since the series began in 1985. The details showed both services confidence and industrial confidence rose, to 19.3 and 14.6, respectively. While the strong confidence surveys (along with last week's PMIs) are encouraging for the Q3 growth outlook, some caution remains regarding growth prospects given the renewed spread of COVID cases across the region. Accordingly, confidence surveys will continue to be watched closely in the months ahead for any hints of whether the latest wave of COVID cases is weighing on activity.
So far, stronger growth in the Eurozone has not been accompanied by significantly faster inflation, in contrast to the sharp uptick of inflation seen in the United States. The Eurozone July CPI firmed moderately to 2.2% year-over-year, while the core CPI slowed to 0.7%. Services inflation quickened slightly to 0.9% year-over-year, while inflation for non-energy industrial goods decelerated to 0.7%.
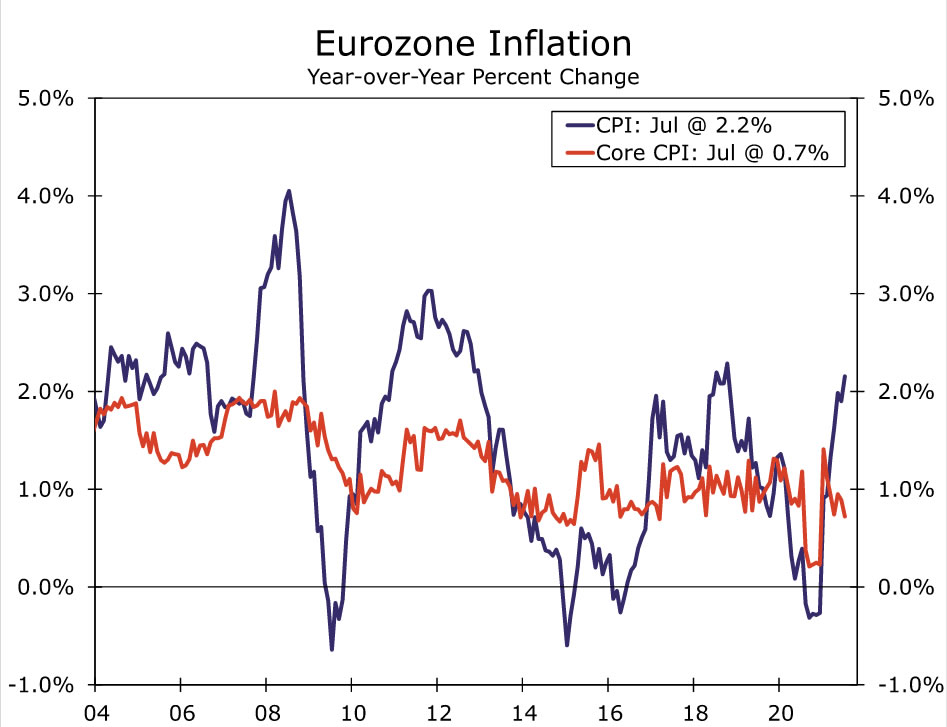
What are the potential implications of this growth and inflation mix for the European Central Bank's (ECB) monetary policy? The ECB will certainly welcome the improvement in growth, while the moderate inflation trends means there is no need for the central bank to move to less accommodative monetary policy any time soon. That is reinforced by recent changes by the ECB to its policy strategy, which included a shift to a symmetric 2% inflation target, and the dovish policy guidance from the ECB following its July monetary policy meeting. Given the latest COVID developments have added some element of near-term uncertainty, we now expect the ECB to refrain from tapering its bond purchases in September, and instead signal that Q4 buying for the Pandemic Emergency Purchase Program (PEPP) will continue to be conducted at a significantly higher pace than during the early months of this year.
In addition, if recent COVID developments do eventually have some influence on confidence and activity, and more importantly should underlying inflation trends fail to move meaningfully higher, we expect the ECB to announce a further increase in bond purchases. Our base case for the European Central Bank's December monetary policy announcement is for the central bank to announce a further €500 billion increase in PEPP purchases, taking the size of that program to €2.350 trillion, with purchases under the PEPP program to continue until at least September 2022.
Mixed Economic News From Japan and Canada
There was both good and bad economic news emanating from Japan and Canada this week. In Japan, June activity data were a pleasant surprise as retail sales rose 3.1% month-over-month, a bit more than expected, while June industrial output rose 6.2%, also an upside surprise. However, with the government imposing a renewed state of emergency for the Tokyo area in recent weeks, there are concerns about how sustainable that upswing might be. Indeed, those concerns are apparent in Japan's July PMI surveys, as the manufacturing PMI eased to 52.2 and the services PMI fell more noticeably, to 46.4.
In Canada, May GDP registered another small decline of 0.3% month-over-month, following a slightly larger fall in April. May service sector activity fell 0.2%, while industrial output rose 0.2%. More recently, however, new COVID cases have slowed and restrictions have been lifted. Against this backdrop, Statistics Canada's early estimate for June GDP is more encouraging. June GDP is expected to rise 0.7% month-over-month, which would mean an overall Q2 growth of around 0.6% quarter-over-quarter (not annualized). Canada's June inflation figures were also good news, at the margin. While still elevated, June CPI inflation slowed to 3.1% year-over-year, while the average of the core CPI measures was steady at 2.2% year-over-year.
International Outlook
China PMIs • Saturday
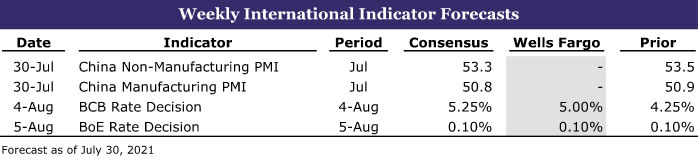
China's July manufacturing and services PMIs are due next week. These surveys will be closely scrutinized by market participants for signs of a stabilizing economy. China's Q2 GDP slowed a bit more than expected to 7.9% year over year, although June retail sales and industrial output both surprised to the upside, hinting at some resilience in the economy moving forward. The July PMIs may offer indications of whether that resilience is temporary or the beginning of a new trend.
The July official manufacturing PMI is forecast to ease further to 50.8, while the services PMI, which will probably be even more closely watched, is expected to fall to 53.3. In addition, the July Caixin manufacturing PMI is expected to fall to 51.0, while the Caixin services PMI should rise to 50.5. Overall, a more moderate fall in China's July PMIs would not be a surprise or a cause for concern. An unexpected increase in the July PMI would likely be taken as an encouraging sign and could boost broader sentiment for the global economy.
Brazil Monetary Policy Announcement • Wednesday
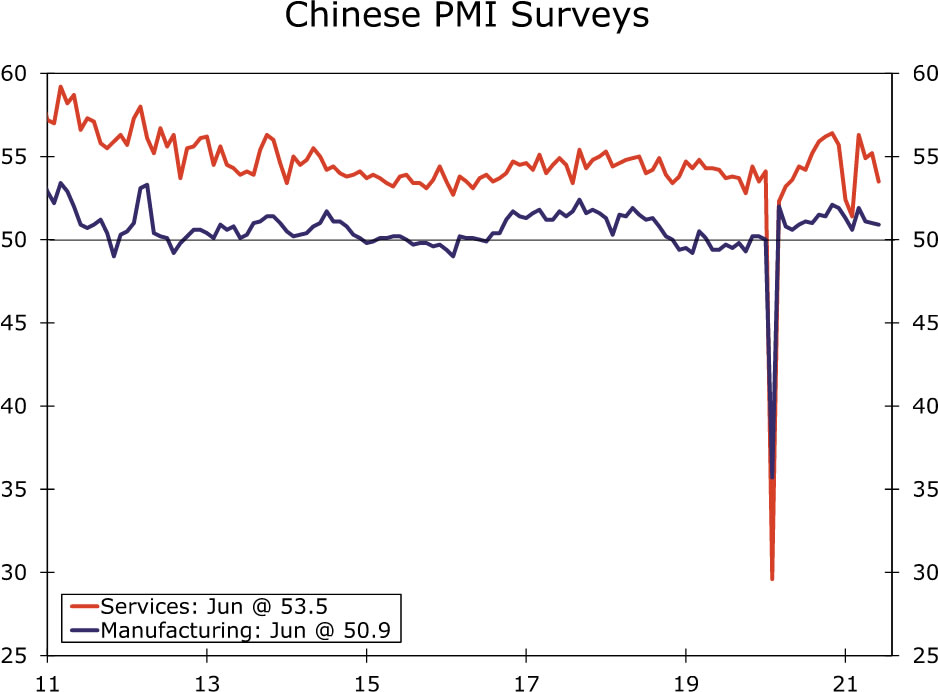
Brazil's central bank (BCB) announces its monetary policy decision next week and is expected to deliver a rate increase. The consensus forecast is for BCB to raise its Selic rate by 100 bps to 5.25%. We anticipate a slightly smaller, but still sizable, 75-bp hike, though we also believe the risks are tilted toward a larger hike.
The key driver of the central bank's tightening cycle is still elevated inflation, as June CPI inflation quickened to 8.35% year-over-year. Potentially adding to the rationale for monetary tightening has been some improvement in economic activity in recent months. For example, the manufacturing and services PMIs both increased in June, to 56.4 and 53.9, respectively, and next week's release of the July PMIs will also be closely watched. June industrial output is also forecast to rise 0.2% month-over-month. Regardless of the size of next week's rate increase, we expect a series of hikes over the balance of this year and forecast the Selic rate to finish 2021 at 7.50%.
Bank of England Policy Announcement • Thursday
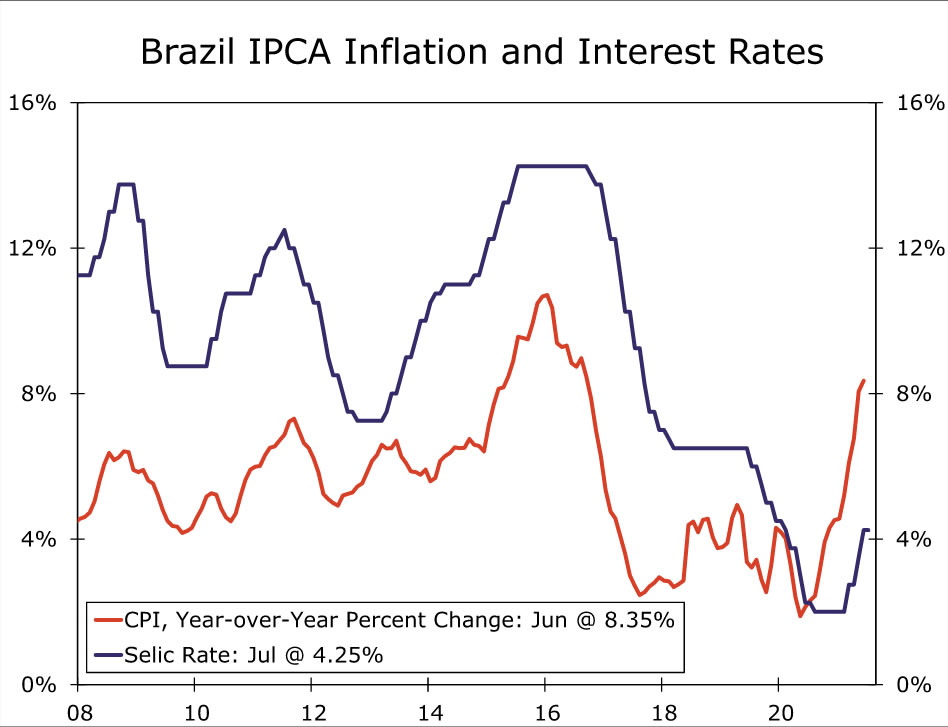
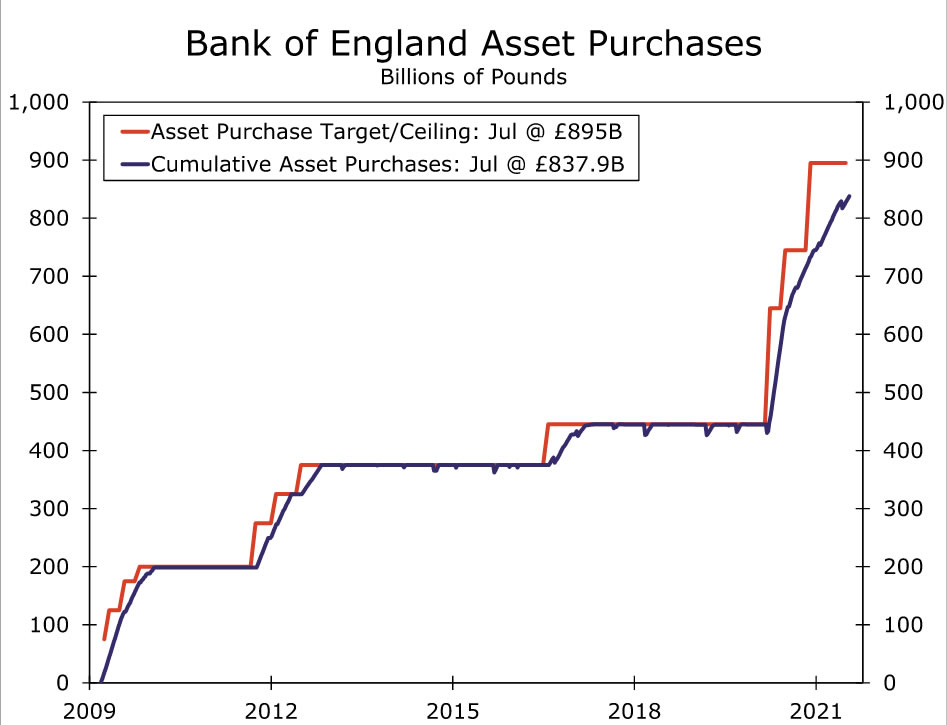
The Bank of England (BoE) makes its monetary policy announcement next week, and while no major changes are expected, we will be watching closely for whether the BoE offers any new hints on future policy moves. For next week's meeting, we expect the BoE to hold its policy rate at 0.10% and to keep its asset purchase target at £895 billion.
The U.K. economy has enjoyed steady, and at times quite strong, gains since early this year. However, a sharp spike in new COVID cases in recent weeks, which has since receded, has created some concern regarding the outlook. Comments from central bank policymakers have also been somewhat mixed. As a result, while it is a close call on whether the Bank of England will taper its bond purchases further, on balance we do expect the central bank to announce slowing in the pace of purchases by £1 billion per week to £2.44 billion per week. The central bank's updated forecasts in its August Inflation Report will also be scrutinized for indications of whether the BoE expects a significant hit to growth from the latest wave of COVID cases. If the central bank's GDP growth is only little changed from previously, it is possible that more market participants will expect an earlier Bank of England rate hike.
Interest Rate Watch
"Progress" Has Been Made, But Is It Enough To Taper?
As was widely expected, the Federal Open Market Committee (FOMC) announced no major policy changes at the conclusion of its two-day meeting on July 28. The FOMC left its target range for the federal funds rate unchanged at 0.00% to 0.25%, and it also decided to maintain its monthly purchase rate of Treasury securities and mortgage-backed securities at $80 billion and $40 billion, respectively. Both decisions were unanimously supported by all 11 voting members of the committee.
But, the FOMC did make an important tweak to the policy statement that it released at the conclusion of the meeting. The FOMC has been stating that "substantial further progress" needs to be made toward the committee's twin goals of maximum employment and price stability before a tapering of asset purchases is warranted. The statement that was released on Wednesday said that "the economy has made progress toward these goals" and that the committee "will continue to assess progress in coming meetings." In other words, progress has been made, but not quite enough to warrant a near-term commencement of "tapering." Note the reference to "coming meetings." It does not seem that the FOMC is in any hurry to taper, although the committee does seem to acknowledge that the time is drawing nearer.
As we discussed in our recent July Flashlight for the FOMC Blackout Period, we look for the FOMC to make a formal announcement regarding the tapering of its asset purchases at the December 14-15 meeting, and we expect the Fed to begin the process of winding down its purchases early next year. But, before that formal announcement is made, we suspect Fed officials will hint that tapering will be forthcoming. These hints could potentially come as early as next month when Chair Powell is expected to make a speech at the Jackson Hole Symposium or at the conclusion of the September 22 FOMC meeting. Long-term interest rates could begin to creep higher as expectations of Fed tapering ramp up.
Fed Establishes Standing Repo Facilities
The FOMC also made a policy change that was less noticed because it is largely technical in nature. Specifically, the committee established two standing repurchase agreement facilities, one for domestic financial institutions and one for foreign central banks. The Fed is establishing these facilities to "serve as backstops in money markets to support the effective implementation of monetary policy and smooth market functioning."
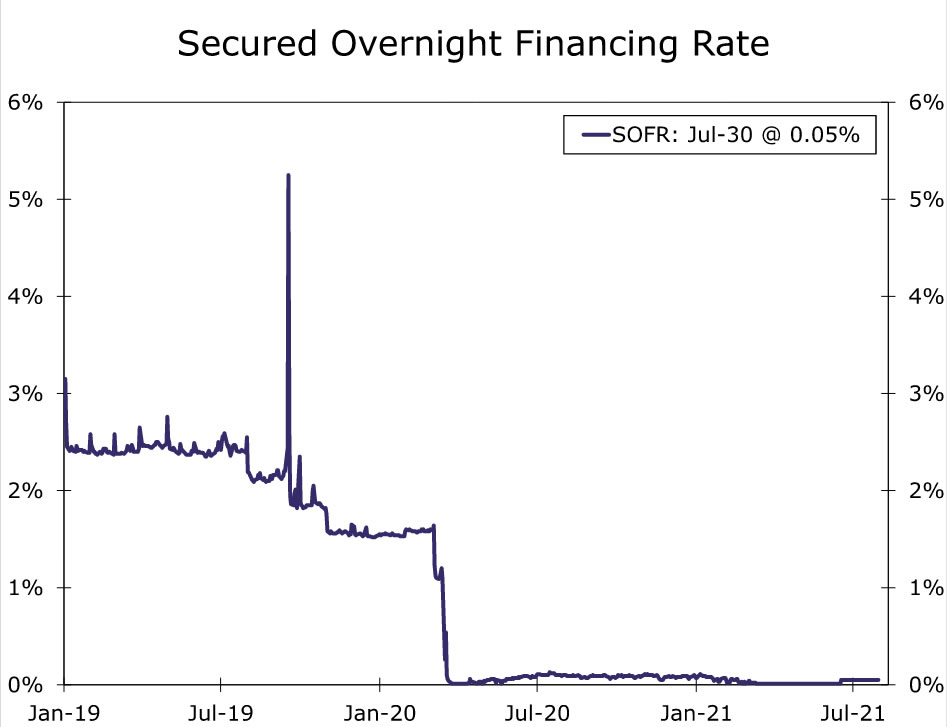
These standing repo facilities will help to provide liquidity to the financial system when it is needed. Previously, the Fed engaged in repos when stress appeared in the system. For example, the stress that appeared in the system in mid-September 2019 caused many short-term interest rates to spike at that time (see chart). The Fed eventually stepped in to provide liquidity, and rates subsequently receded.
The Fed plans to conduct overnight repo auctions every day. The maximum size of each auction will be $500 billion at a rate of 0.25%. Given that the financial system is currently awash in liquidity and that short-term interest rates are significantly less than 0.25%, the Fed likely will get very little interest in its repo facilities at this time. But, the facilities will already be operational when stresses appear, and financial institutions and foreign central banks will likely quickly turn to the Fed when liquidity gets tight. The upshot is that the Fed's standing repo facilities will likely help to mitigate spikes in short-term rates when financial market stresses inevitably appear.
Credit Market Insights
Millennial Market Makers
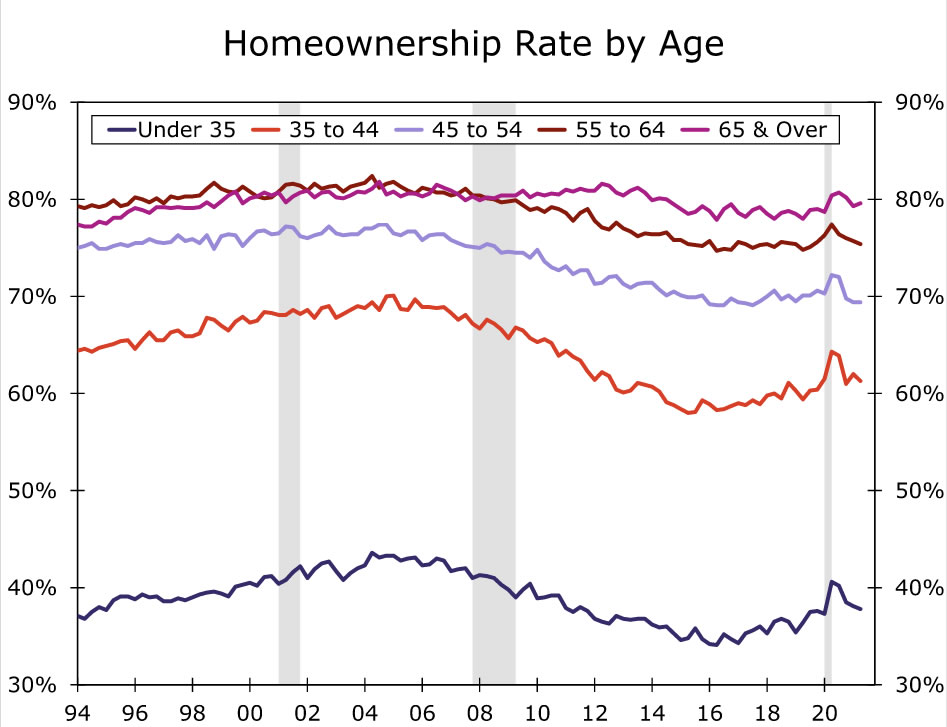
Prior to the pandemic, one of the concerns within the housing market was that millennials would not be buying homes. The percentage of 18- to 29-year-olds living with their parents had been trending up since the Great Recession. Those living on their own were opting to rent in the urban core relative to prior generations. Part of this shift was blamed on increasing debt, particularly from student loans. The amount of student debt held by those under 39 more than tripled between 2004 and 2017, according to the Federal Reserve Bank of New York. Despite this apparent shift in preferences and higher debt burdens, the nation’s largest generation has started to help prop up housing demand. Data released by the Census Bureau this week showed that the spike in the homeownership rate during the pandemic had more to it than just pandemic-related survey distortions. In the Q2, homeownership rates for those under 35 were up to 37.8%, a 1.4 percentage point increase from Q2-2019. Furthermore, homeownership rates for this age cohort during the pandemic have been the highest since Q3-2011. For 35- to 44-year-olds, homeownership was up to 61.3%, a 1.9 percentage point increase from two years ago.
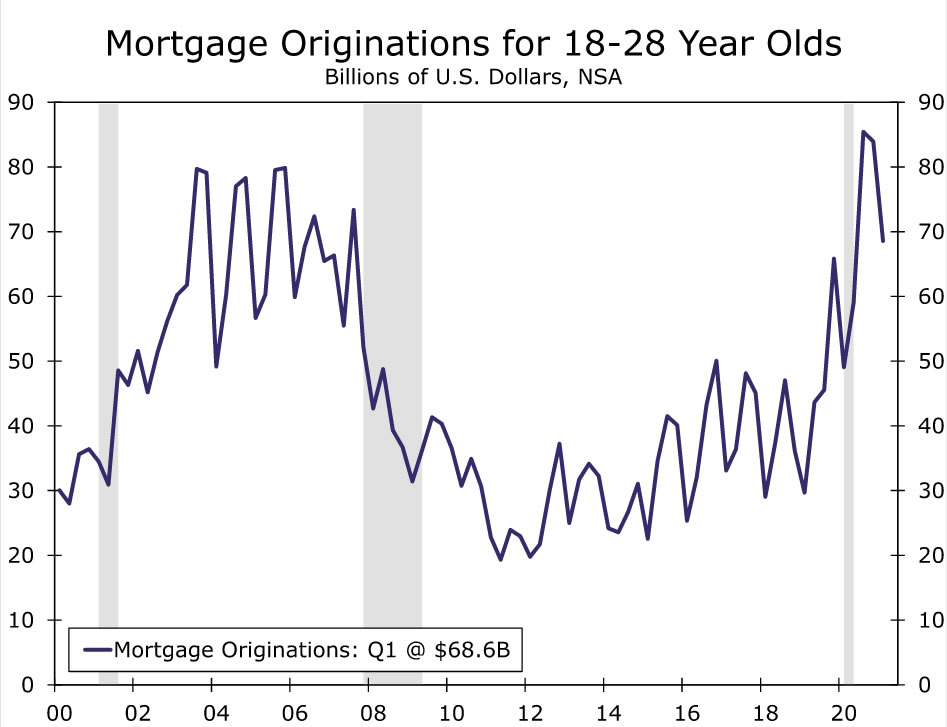
With their eyes set on becoming first-time home buyers, millennials have had to face a red-hot housing market, as the median existing home price increased 23.4% over the past year to $363,300 in June. A potential headwind for millennial housing demand stems from trying to finance housing purchases. Despite these high prices, millennials have still been able to capitalize off of the promising mortgage market. According to Freddie Mac, the current 30-year fixed mortgage rate sits at 2.8%, which is among record-low levels. Younger millennials and Gen Z have also benefited from these historically low rates, as those between the ages of 18 and 29 accounted for $68.6 billion in mortgage originations during Q1 of this year, a 131% increase from two years ago.
Despite a plethora of potential drawbacks, including elevated debt and high home prices, housing demand among millennials has remained strong. While home prices may remain elevated in the coming months, we can expect housing demand among the millennial cohort to continue to contribute to a robust housing market.
Topic of the Week
Infrastructure Deal Is the Appetizer to the Fall Fiscal Feast
About one month ago, a group of bipartisan Senators and the White House reached an agreement on an infrastructure plan that included $559 billion of new spending over a five-year period. Since then, legislators and White House officials have been haggling over the specifics of the agreement and, on the Democratic side, contemplating how it fits into the Biden administration's larger ambitions for the American Jobs Plan and the American Families Plan. This week, Congress took a major step toward enactment of this bipartisan infrastructure deal. The Senate voted 67-32 in favor of clearing an important procedural hurdle to eventual passage. Note that this was not a vote on the actual piece of legislation; the writing of the bill and final passage may take another week or so. That said, 17 Republicans joining 50 Democrats on this procedural vote signals that the final bill will likely pass. Although there were some changes relative to the original agreement, the broad strokes of the plan are more or less the same.
One might think that the next step for this infrastructure bill would be a quick stop in the House of Representatives before being sent to the president's desk for his signature. However, it appears that if the Senate passes the legislation as is expected, the Democratic majority in the House will sit on the bill indefinitely. Democratic leaders in the House do not want to pass the bipartisan infrastructure package until they see more meaningful progress on a much larger budget reconciliation bill that contains more of the president's priorities.
So what happens next? We suspect the main action will remain in the Senate as it turns to the first step of the budget reconciliation process: passing a budget resolution. Democrats in the Senate appear to be circling the wagons around a budget resolution that would permit up to $3.5 trillion of new spending over a decade. A critical thing to understand about this step is that if Democrats agree to and pass a budget resolution along these lines, the $3.5 trillion figure is a ceiling, but not a floor. Meaning, the eventual budget reconciliation bill can include less spending, but it cannot contain more. A similar dynamic was at work in 2017 when Republicans passed the Tax Cuts and Jobs Act. Their budget resolution permitted tax changes that reduced revenues by no more than $1.5 trillion over a decade, a ceiling they eventually hit in full.
It is possible that the Senate will vote on a budget resolution before leaving for a monthlong recess on August 6. Other than that, we doubt much more will happen with the reconciliation bill in the next week or so. As a result, the timeline we have laid out in previous reports now looks locked in place: The fall will contain the main drama as the moderate and progressive wings of the Democratic party lock horns over a rewrite of the nation's tax code and social welfare programs. We continue to believe a reconciliation bill will eventually become law, but that new spending will be lower than the proposed $3.5 trillion. We think something along the lines of $2.0 trillion to $2.5 trillion in new spending over a decade, with roughly half of that paid for with higher tax revenues, is around where the reconciliation bill will ultimately land. This would be in addition to the $500 billion or so of new spending from the bipartisan infrastructure agreement.
We have written previously that even if the reconciliation bill effort fails, something will eventually become law. The bipartisan infrastructure plan agreed to this week appears poised to become that fallback plan. If Democratic leaders in the House face the prospect of passing nothing or passing just the standalone infrastructure bill, we believe they would ultimately adopt the latter approach.
In addition to these ongoing policy developments, Congress must also fund the government past September 30 to avert a government shutdown and increase or suspend the debt ceiling sometime before late October/early November. With so much action looming on the horizon, we encourage our readers to enjoy the final month of summer and prepare for a fall full of fiscal policy twists and turns.
The Weekly Bottom Line: The Economy Remains on Solid Footing
U.S. Highlights
- Thursday’s second quarter GDP report underwhelmed, but a solid foundation for future growth is developing.
- The pandemic continues to present supply chain challenges that are both driving prices higher and weighing on economic growth.
- Consumers are flush with cash and going back to their pre-pandemic spending habits could help slow inflation and give producers a chance to rebuild depleted inventories.
Canadian Highlights
- Canada has so far avoided a spike in new cases tied to the Delta variant. And, with new cases low, the stage is set for a heated summertime performance. In June, real GDP advanced by a projected 0.7% m/m, and high frequency indicators point to continued strength so far in July.
- Still, Delta risk looms. This week, the B.C. government imposed restrictions in part of the province where cases have spiked. The impact of these measures will likely pale in comparison to what was in place earlier in the pandemic. Meanwhile, Alberta is loosening restrictions even further, despite an increase in new cases.
- Inflation slowed a touch in June. However, price pressures are likely to increase in coming months, risking an upward shift in inflation expectations.
U.S. - The Economy Remains on Solid Footing
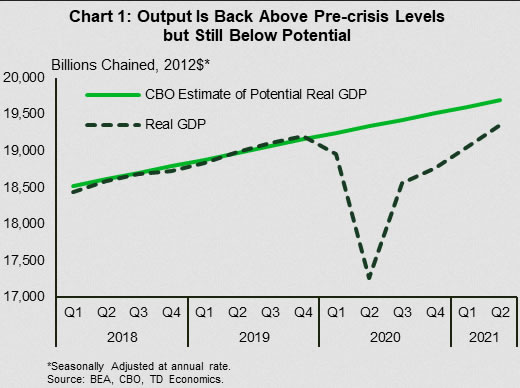
Yesterday’s second quarter GDP report sure was an interesting read. Growth disappointed (6.5% vs. 8.4% expected) as the American consumer’s splurge wasn’t quite enough to meet the lofty expectations for the expansion. However, despite the miss on headline growth, healthy domestic demand persists and is laying a solid foundation for the second half of the year.
The good news starts with noting that total economic activity has surpassed pre-pandemic levels. In fact, real GDP is now only 1.7% below the CBO’s estimates of the full productive capacity of the economy. For a point of reference, after the recession ended in 2009 it took five and a half years (and a downward revision to estimates of potential GDP) to make up this much ground.
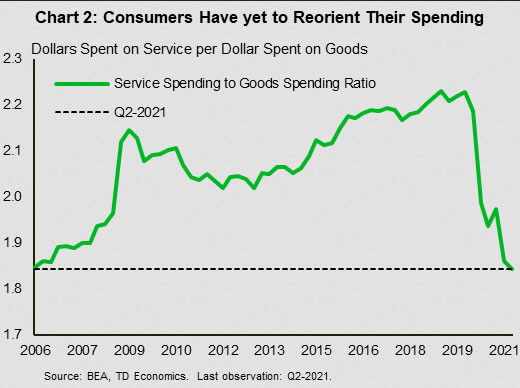
The strength is coming from domestic demand. U.S. households are flush with cash and deployed a chunk of it in the second quarter, drawing down personal savings by $526 billion.
Going forward, the storyline worth keeping an eye on is what that money is being spent on. Consumers have yet to reorient their expenditures back to pre-pandemic patterns. Since the outset of the crisis money has flowed to goods purchases, while services spending was down to 64.8% of the pie in the second quarter (from a peak of 69%).
Though June’s data shows that services expenditures are ticking back up (now $1.87 per dollar spent on goods) the fact that consumers are taking their time adjusting their spending back to “normal” could present quandary for policymakers. Supply chains have struggled to meet demand for goods, and with the ongoing difficulty of emerging markets to control the pandemic (along with China’s commitment to stamp out any COVID cases as they come up) near-term relief isn’t on the radar. The longer it takes to reorient the consumption basket, the longer pressure will be sustained on supply chains and consumer price inflation will struggle to moderate.
The issue goes beyond inflation though, as supply chain problems are also constraining output. The second quarter GDP report featured economy-wide inventory drawdowns that were the largest outside of a recession since the 1940s. The automotive sector (and the semiconductor shortages that hampered producers’ ability to meet demand) made up roughly 60% of the decline in nonfarm inventories, but the issues are more pervasive. The reduction in stockpiles was responsible for more than half of the miss on growth for the quarter.
Despite the current challenges the outlook remains bright. A reorientation to services spending will allow inventory to rebuild in the balance of the year by focusing demand away from capacity constrained sectors and towards those with slack. The sooner this happens, the sooner we can expect consumer prices to moderate. Moreover, the large drawdown in inventories provides a hedge against future shocks as producers can use lulls in demand to rebuild depleted stockpiles.
Canada - Growth Heating Up, Delta Risks Loom
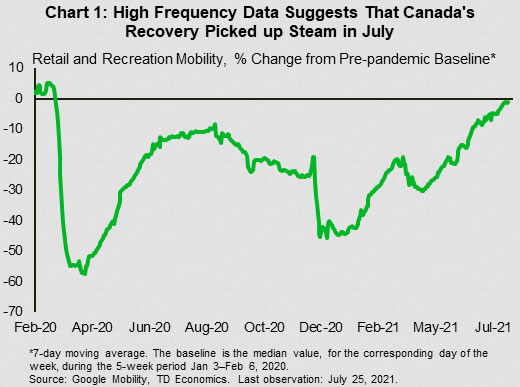
Canada has so far been able to avoid the spike in new cases linked to the Delta variant seen in jurisdictions like the U.K. and parts of the U.S. where vaccination uptake has been low. And, with new cases remaining low, the stage is set for a heated summertime performance for the economy. Just this week, Statistics Canada estimated that real GDP advanced 0.7% month-on-month in June (after dropping by an average of 0.4% in April and May), boosted by re-openings as well as the construction and mining, oil and gas sectors. This is the first in what will hopefully be several solid advances. In this regard, higher frequency data is signaling so far, so good in July (Chart 1).
Of course, Canada is not an island to itself, and Delta risks still loom large. New cases have been grinding higher in recent weeks, with the latest 7-day average at its highest level since late June. An outbreak in B.C.'s Central Okanagan region was even declared this week, forcing the re-imposition of some restrictions in response. These measures include tighter rules governing mask wearing, discouraging non-essential travel into the area, increased scrutiny for businesses where COVID-19 cases have occurred (with the potential for temporary closures), and enhanced social distancing measures at places where people gather, like bars and nightclubs.
A few important developments to note about B.C.'s experience: one, restrictions were localized to one region, two, public health measures were a drop in the bucket compared to those seen earlier in the pandemic and three, officials have suggested that broad-based provincial actions are no longer required. Notably, B.C. has maintained a relatively loose stance on restrictions throughout the pandemic and cases there are still very low. With vaccinations weakening the link between cases and hospitalizations, it will be interesting to see if other provincial governments maintain a similar, lighter-touch, potentially more gradual approach to restrictions. In Alberta, the government has gone even further, announcing this week that it will no longer require people who test positive for COVID-19 to self-isolate, will stop routine testing for mild symptoms and will no longer require mask-wearing in schools come September.
Inflation is an especially important topic these days, and CPI reports have come increasingly under the microscope. However, June's report (released this week) showed that Canadian inflation pressures cooled a little during the month. Year-on-year inflation was 3.1%, down from 3.4% in May, on slower growth in clothing, recreation, food and transportation prices.
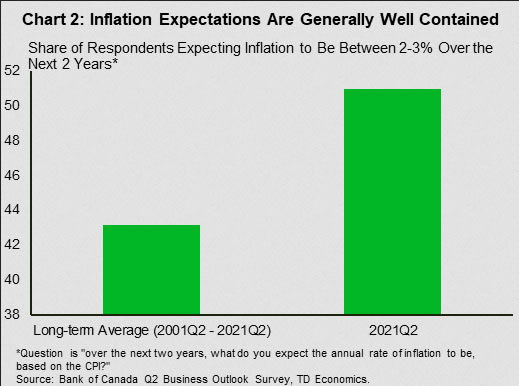
While this is a modest, yet welcome reprieve, note that the Bank of Canada's core inflation measures were unchanged in June, and price pressures are likely to rise in the months ahead reflecting re-openings and supply chain strains. Inflation expectations are the channel through which "transitory" inflation pressures could be longer lasting. So far, they remain mostly well contained (Chart 2), though this is a key risk to inflation and the outlook for monetary policy.
Forward Guidance: July Canada and U.S. Labour Market Reports to Show Further Improvements
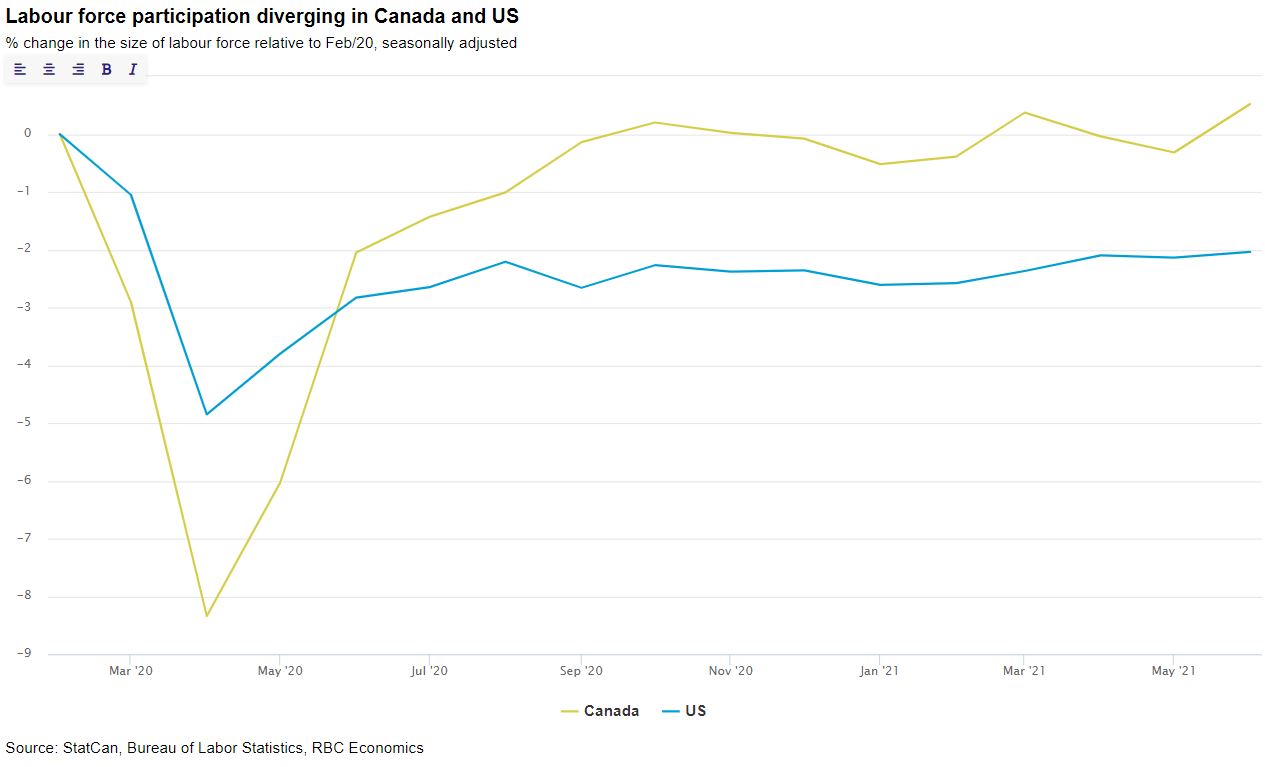
July’s employment reports are expected to show labour market conditions continued to improve in both Canada and the US. Similar to June, the hospitality sector will drive much of job gains in July as the economies continue to reopen. In Canada, we expect employment increased 150K in July trimming the employment shortfall to 190K compared to February 2020. The unemployment rate is expected to fall to 7.2% from 7.8% in the prior month. Canada’s labour force already fully recovered its pandemic-related losses in June and we expect the labour force participation rate to tick up slightly higher again in July.
The US in comparison, has seen a much slower recovery with 3.4 million fewer labour force participants (people either working or looking for work) in June 2021 than in February 2020. Growing retirements among the baby boom generation, COVID-related health concerns and larger than usual federal income support all played some role in keeping workers from actively seeking employment. On the latter, 25 states ended the $300 federal top-up to state unemployment benefits by July 3rd, with 22 out of those 25 going one step further and ending all other types of federal aids including PUA. We expect another solid gain in U.S. employment July and look for labour force participation to rise as well.
Week ahead data watch:
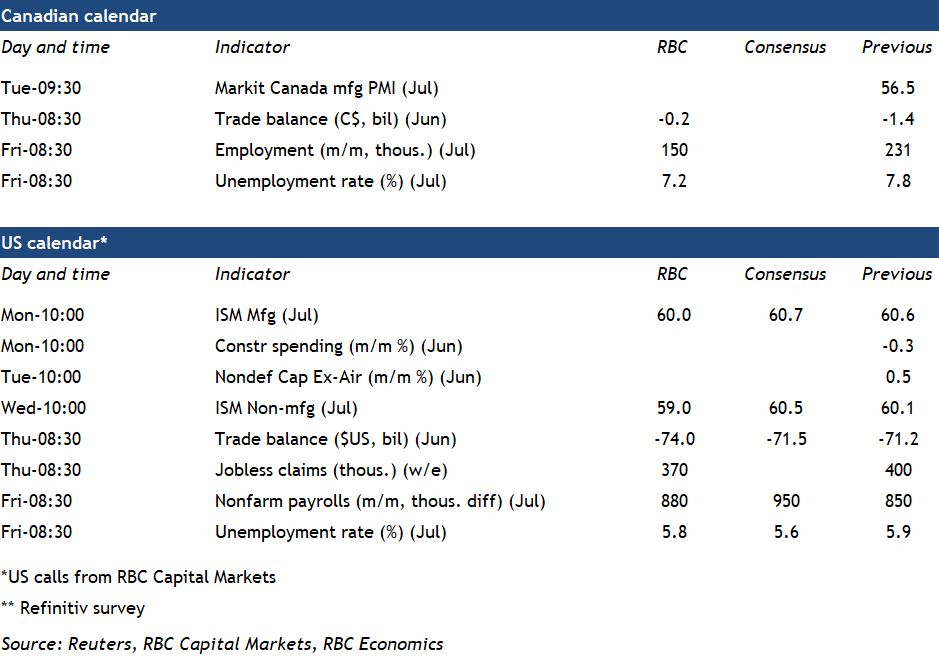
- In June, we expect a gain in Canadian exports supported by higher energy prices and a flatter reading in imports with potential upside from services import as more were able to travel abroad with the new quarantine exemption. That should combine to a narrower trade deficit of $200 million.
- Canada now leads many other advanced economies in the share of population that’s fully vaccinated. Infections are once again rising in parts of the country but remain low for now. And a higher vaccination rate is expected to prevent those increases from putting the same amount of pressure on the healthcare system as in prior waves.
Week Ahead – US Jobs Report Up Next
Country
US
The upcoming jobs report will be pivotal for the Fed in deciding whether the economy is headed toward hitting their substantial progress goal. Now that the Fed has finally had their first deep dive into discussing tapering asset purchases, Wall Street will closely focus on labor market progress in the coming meetings. The July jobs report is expected to show 925,000 jobs were created, an improvement from the prior month gain of 850,000.
Tapering at earliest seems like it could be in September, but that still means interest rate hikes are a long way off. Unless risk aversion becomes the dominant theme, the dollar could remain vulnerable in the short-term.
Financial markets will also pay close attention to debt ceiling drama. The Treasury still has around $450 billion in cash, so Congress can afford to delay tackling this issue until October. While the Treasury will use extraordinary measures to prevent the US from defaulting, Republicans will start to posture for spending reforms in order for President Biden to move forward with his next round of stimulus.
EU
The data this week is unlikely to have done much to change the ECBs view on what is needed to achieve its new, more aggressive, inflation target. Hawks at the central bank may make a little more noise going forward, with German inflation now running above 3%. But I don’t expect this will change much at this stage.
The key releases next week will be PMIs on Monday and Wednesday, with German factory orders on Thursday also noteworthy.
UK
The Bank of England meeting next week is the standout event, although the meeting almost certainly comes to early to make any significant judgement on paring back monetary support. While the recent surge in the delta variant has eased, the risk of cases rising again is still significant. What’s more, the MPC will want more evidence on how the economy is responding to restrictions being lifted fully, not to mention the impact that the furlough scheme ending in September will have.
Of course, the growth and inflation data may make some members of the MPC a little nervous and stimulate debate on the risks of it, but with the widespread view being that both are temporary, it’s unlikely that the majority policy makers will consider removing support any time soon.
Emerging Markets
Russia
Unemployment fell to 4.8% this week, slightly behind expectations, while retail sales rose 10.9% on an annual basis, ahead of forecasts.
Next week we get the quarterly monetary policy report on Monday. This comes a couple of weeks after the central bank raised interest rates to 6.5%. They did warn of more to come after the meeting and the report may hold clues as to what we can expect going forward.
South Africa
PMI the most notable economic release next week. The central bank previously left interest rates unchanged and signaled a hike may be considered later in the year.
Asia Pacific
China
Market sentiment has been dominated by the China government’s crackdown on the tech sector and now the education sector with Mainland and Hong Kong exchanges, as well as US-listed China companies taking a bath this week. Concerns are also rising in the corporate credit sector with Chinese corporate dollar-denominated debt falling heavily this week.
Despite assurances from China that its moves were “targeted” and not part of a broader agenda, financial markets are taking this with a grain of salt and sentiment will start next week walking a tightrope. China equities will continue to underperform until the regulatory discount reaches equilibrium with lower prices.
China releases official Manufacturing and Non-Manufacturing PMIs over the weekend, along with Caixin Manufacturing PMI on Monday morning. A set of poor data could spark fireworks in the early part of the week and send Mainland and Hong Kong equities sharply lower once again in an already nervous environment.
Pan-Asia PMIs are also released Monday. Weak readings will increase nervousness already complicated by Asia’s delta-variant situation, and could be another headwind for both China and regional stocks, as well as ASEAN currencies which have not benefited from US Dollar weakness this past week.
India
The Indian Rupee has recovered over the past week due to lower oil importer buying, with Covid-indced demand still weak. Additionally INR has seen inflows from international investors who have been fleeing China markets and rotating into India and ASEAN markets. With its large universe of IPO’d tech unicorns, India is well positioned to benefit from a China rotation. Both the Sensex and the INR should outperform ASEAN markets on that basis in the coming week.
The back end of the week will be dominated by the latest Reserve Bank of India rate decision. Inflation remains above the RBI’s upper 6.0% limit, but the ongoing Covid-19 situation, although improving, should stay the central bank’s hand. It would be a huge surprise if the RBI hiked on Friday and if they did, India equities would fall sharply and the INR would rally sharply.
Australia & New Zealand
Australian stock markets are trading sideways over the past week with delta-variant cases increasing in Sydney resulting in a harsher lockdown and a 4-week extension. The week is dominated by the RBA rate decision on Tuesday, with no change expected. The threat to growth and employment from the NSW Covid situation will ensure the RBA remains very dovish. Other data incluses PMIs, Home Loans, Retail Sales and the Trade Balance, but global risk sentiment and the RBA will dominate.
Both the AUD and NZD continue to bounce around on swings in global risk sentiment. Both have traced out technical recovery formations this week, but have yet to break convincingly higher. That will very much depend on the Sydney Covid-19 situation stabilising, and China stock markets finding a floor next week.
New Zealand’s Employment Change and Labour Costs data on Wednesday could send NZD/USD sharply higher if it comes in above expectations. The RBNZ has an itchy trigger finger and has said as much. Higher prints will make an RBNZ hike almost certain at its next meeting and be very supportive of the currency.
Japan
Japanese stocks continued gyrating on swings in risk sentiment internationally, reflecting the heavy presence of retail fast money inthe Japan market. We expect this volatility to continue as the only major data releases are Tokyo CPI and Household Spending.
Japan expanded its Covid-19 states of emergencies to more prefectures on Friday, and that appears to be weighing on the Nikkei. An escalation of the Covid situation, especially if it threatens the Olympics, could be a strong headwind for Japan stocks next week.
USD/JPY has dissolved into a purely US/Japan interest rate differential play. The flattening US yield curve has seen USD/JPY fall to 109.50 and if yields in the US track lower next week, Friday’s US Non-Farm Payroll will ironically, be the biggest market-moving event risk for USD/JPY next week.
Key Economic Events
Saturday, July 31
- US debt limit returns on August 1st as lawmakers debate over increasing or suspending the ceiling in the months ahead.
Economic Data/Events
- China July Manufacturing PMI: 50.8e v 50.9 prior; non-Manufacturing PMI: 53.3e 53.5 prior
- Hong Kong budget balance
Sunday, Aug. 1
- UK Government lowers its contribution for furloughed workers to 60%, with the employer burden increased to 20% of pre-pandemic pay.
Monday, Aug. 2
- US ban begins over investing in 59 Chinese firms with ties to China’s military or surveillance industries.
- Director of NIAID Fauci speaks at the Center for Strategic and International Studies (CSIS)
- The Toronto Stock Exchange will be closed.
Economic Data/Events
- US July ISM Manufacturing PMI: 60.7e v 60.6 prior; July Final Markit Manufacturing PMI: 63.1e v 63.1 prelim; construction spending
- Australia CoreLogic house prices, Melbourne Institute inflation, ANZ job advertisements
- Eurozone Manufacturing PMI
- Germany Manufacturing PMI, retail sales
- India Manufacturing PMI
- UK Manufacturing PMI
- Australia Manufacturing PMI
- Thailand Manufacturing PMI, business sentiment index
- Russia Manufacturing PMI
- South Africa Manufacturing PMI
- Hungary Manufacturing PMI
- Poland Manufacturing PMI
- Turkey Manufacturing PMI
- Czech Republic Manufacturing PMI
- Sweden Manufacturing PMI
- Switzerland Manufacturing PMI
- China Caixin manufacturing PMI
- Singapore PMI, electronics sector index
- Japan vehicle sales, consumer confidence index, manufacturing PMI
- Switzerland CPI
- Bank of Russia quarterly monetary report
Tuesday, Aug. 3
- Eurogroup President Donohoe, Scotland PM Sturgeon, Singapore PM Lee Hsien Loong, and SEC Chairman Gensler to speak at 3-day annual Aspen Security Forum
Economic Data/Events
- Australia rate decision: No changes expected to Cash Rate Target, likely to defer bond taper
- Australia building approvals
- US factory orders, durable goods
- New Zealand CoreLogic house prices
- Japan Tokyo CPI, monetary base
- Turkey CPI, PPI
- Mexico international reserves
- New Zealand Unemployment
- Eurozone PPI
- Denmark currency reserves
Wednesday, Aug. 4
Economic Data/Events
- US ADP employment change
- Thailand (BOT) rate decision: Expected to keep Benchmark Interest Rate unchanged at 0.50%
- Eurozone PMIs, Retail sales
- Hungary Retail sales
- Australia Retail sales
- Singapore PMIs
- India PMIs
- China Services PMIs
- Japan PMIs
- South Africa PMIs
- Russia PMIs
- Sweden PMIs
- Germany PMIs
- UK PMIs
- Thailand consumer confidence
- France budget balance
- EIA crude oil inventory report
Thursday, Aug. 5
- The Group of 20 digital economy ministers meet in Trieste, Italy.
- Inauguration day for Iran’s Ebrahim Raisi
Economic Data/Events
- BOE Rate decision: to keep its benchmark interest rate and its bond-buying target unchanged
- Czech Republic rate decision: To raise interest rates 25 basis points to 0.75%
- US initial jobless claims, trade balance
- France industrial production
- Germany factory orders
- Indonesia GDP
- Australia Trade
- Russia CPI
- Thailand CPI
- Eurozone ECB publishes Economic Bulletin
- Russia gold and forex reserves
- UK new car registrations
- Ireland unemployment
Friday, Aug. 6
- RBA Governor Lowe gives testimony to a Parliament committee.
Economic Data/Events
- US July Change in nonfarm payrolls: 925Ke v 850K prior; unemployment rate:5.6%e v 5.9% prior, wholesale inventories
- Germany Industrial production
- Italy Industrial production
- Spain Industrial production
- Hungary Industrial production
- India Rate decision: Expected to keep Repurchase Rate unchanged at 4.00%
- Canada unemployment
- Australia Reserve Bank of Australia statement on monetary policy
- Japan household spending, leading index
- Switzerland Foreign reserves
- China BoP current account balance
- France Trade
- Hungary Trade
- South Africa gross and net reserves
Sovereign Rating Updates
- Norway (Fitch)
- ESM (S&P),
- Czech Republic (Moody’s)