Sample Category Title
AUD/USD Daily Report
Daily Pivots: (S1) 0.7350; (P) 0.7374; (R1) 0.7405; More...
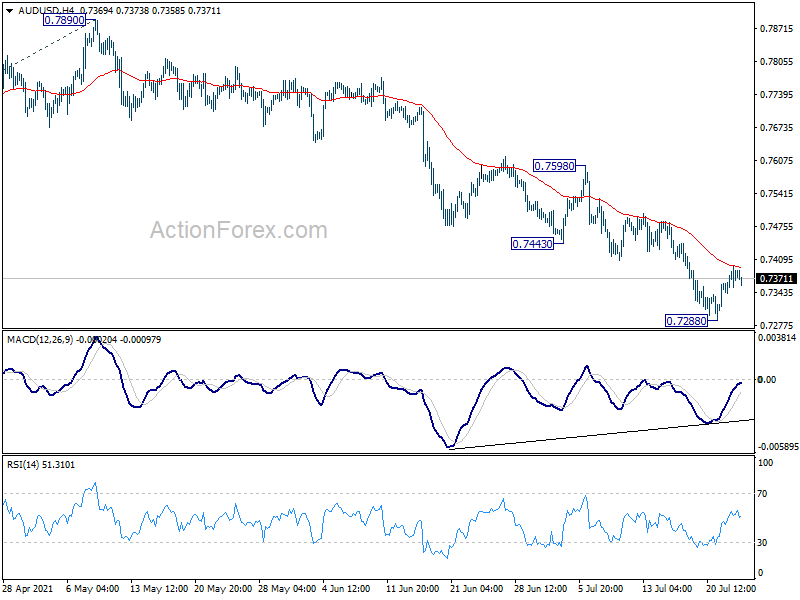
Intraday bias in AUD/USD remains neutral and some consolidations could be seen. But outlook stays bearish as long as 0.7443 support turned resistance holds. On the downside, break of 0.7288 will resume larger fall from 0.8006, and target 161.8% projection of 0.8006 to 0.7530 from 0.7890 at 0.7120. However, break of 0.7443 will bring stronger rebound to 0.7530 support turned resistance.
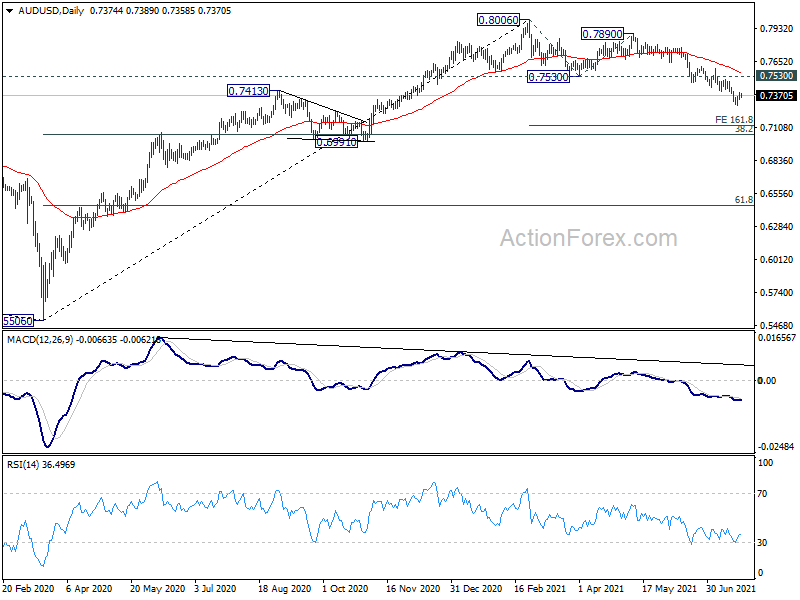
In the bigger picture, rise from 0.5506 medium term bottom could have completed at 0.8006, after failing 0.8135 key resistance. Correction from there could target 0.6991 cluster support (38.2% retracement of 0.5506 to 0.8006 at 0.7051). We'd look for strong support from there to bring rebound. However, sustained break of this level would argue that the whole medium term has indeed reversed.
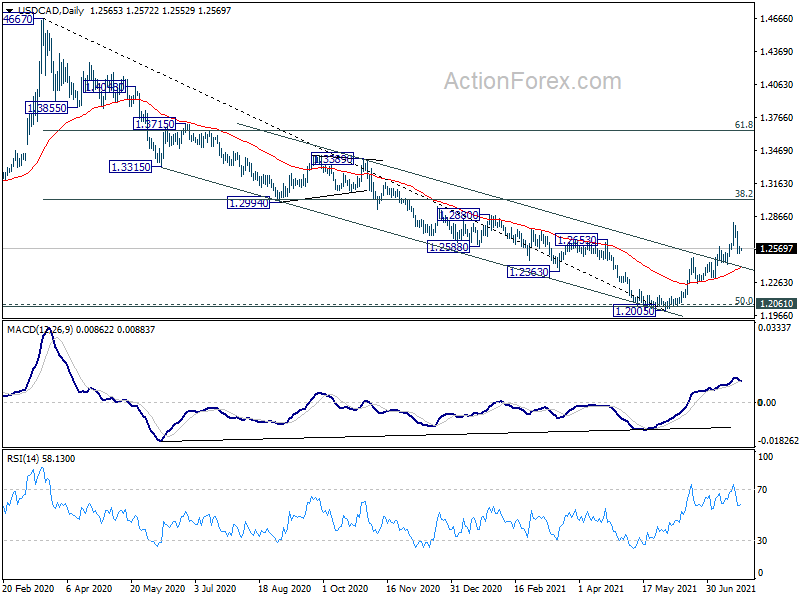
USD/CAD Daily Outlook
Daily Pivots: (S1) 1.2531; (P) 1.2562; (R1) 1.2595; More...
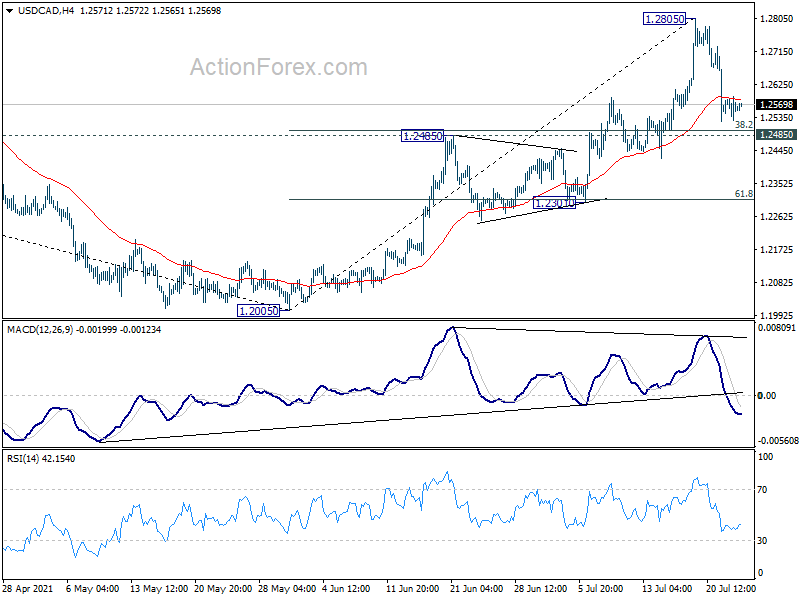
Intraday bias in USD/CAD remains neutral at this point and some consolidations could be seen. Further rise remains in favor as long as 1.2485 resistance turned support holds. On the upside, break of 1.2805 will extend the rise from 1.2005 to 1.3022 medium term fibonacci level next. On the downside, however, break of 1.2485 will bring deeper fall back to next cluster support at 1.2301 (61.8% retracement of 1.2005 to 1.2805 at 1.2311).
In the bigger picture, fall from 1.4667 is seen as the third leg of the corrective pattern from 1.4689 (2016 high). It should have completed after hitting 1.2061 (2017 low) and 50% retracement of 0.9406 to 1.4689 at 1.2048. Sustained break of 38.2% retracement of 1.4667 to 1.2005 at 1.3022 will pave the way to 61.8% retracement at 1.3650 and above. Overall, medium term outlook remains neutral at worst with 1.2048/61 support zone intact.
EUR/USD Decline Likely To Continue
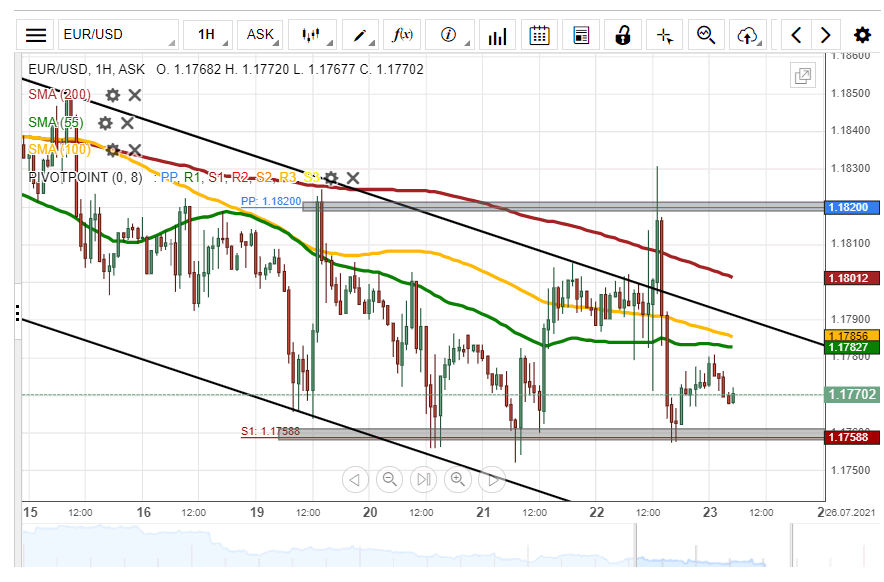
On Thursday, the Eurozone single currency declined by 62 pips or 0.53% against the US Dollar. The currency pair tested the weekly support level at 1.1758 during Thursday's trading session.
All things being equal, the exchange rate could continue to edge lower during the following trading session. The potential target for sellers would be near the 1.1740 area.
However, the weekly S1 at 1.1758 could still provide support for the EUR/USD currency exchange rate within this session.
Canadian Dollar Firm as Focus Turns to Retail Sales
Trading in Asian session is relatively subdued today, as some participants are already looking forward to the weekend, after a roller coaster ride. Canadian Dollar is currently the strongest one for the week, helped by rebound in WTI oil price, which is back above 71. However, New Zealand and Australian Dollars are the worst performing ones. Dollar and Yen diverged after risk markets stabilized and recovered. Euro is currently the weakest European major, in particular against Sterling.
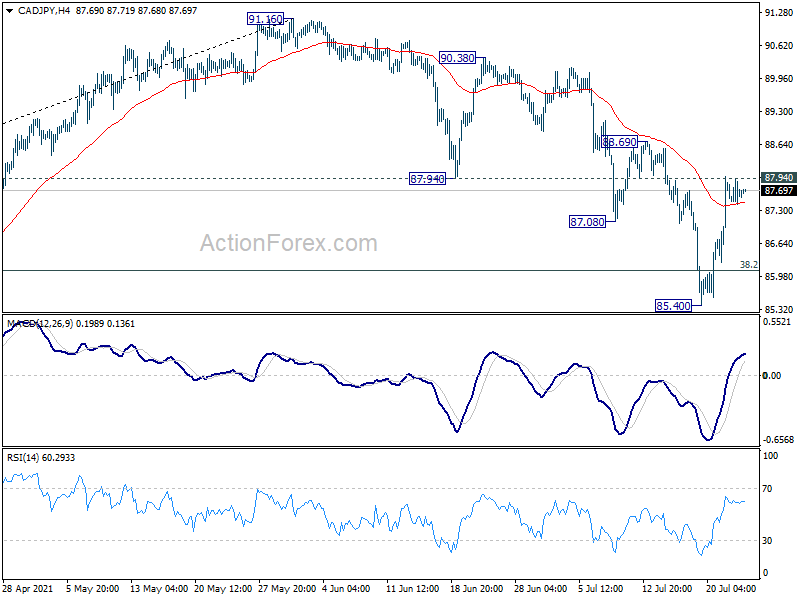
Technically, we'd pay some attention to CAD/JPY, which could react further to Canada retail sales today, as well as the stock markets. It's now pressing 87.94 support turned resistance. Firm break there would argue that whole corrective fall from 91.16 has completed at 85.40 already. Stronger rise would be seen back to retest 91.16 high in the coming weeks.
In Asia, at the time of writing, Hong Kong HSI is down -1.10%. China Shanghai SSE is down -0.75%. Singapore Strait Times is down -0.18%. Japan is still on holiday. Overnight, DOW rose 0.07%. S&P 500 rose 0.20%. NASDAQ rose 0.36%. 10-year yield dropped -0.015 to 1.265.
UK Gfk consumer confidence rose to -7, gradual release of pent-up demand
UK Gfk Consumer Confidence rose from -9 to -7 in July. The index has improved for six months in a row. Personal financial situation over next 12 months was unchanged at 11. General economic situation over the next 12 months dropped from -2 to -5. However, major purchase index rose from -5 to 2.
Joe Staton, Client Strategy Director GfK, says: "The healthy seven-point rise in the major purchase measure aligns with strong retail growth figures that reflect the gradual unlocking of the UK high street and release of pent-up demand as Brits hit shops, restaurants and venues. However, threats from increasing consumer price inflation, rising COVID infection figures, and the looming end of furlough and the Job Retention Scheme could put the brakes on this rebound.
Australia PMI composite dropped to 45.2, growth streak brought to a halt
Australia PMI Manufacturing dropped from 58.6 to 56.8 in July, a 4-month low. PMI Services dropped from 56.8 to 44.2, a 14-month low. PMI Composite dropped from 56.7 to 45.2, also a 14-month low.
Jingyi Pan, Economics Associate Director at IHS Markit, said: "Latest indications from the IHS Markit Flash Australia Composite PMI suggested that Australia's growth streak had been brought to a halt in July, and perhaps no surprise given the renewed lockdowns aimed to bring the COVID-19 situation under control."
Looking ahead
Eurozone PMIs, UK retail sales and PMIs will be featured in European session. Canada will release retail sales later in the day. US will also release PMIs.
USD/CAD Daily Outlook
Daily Pivots: (S1) 1.2531; (P) 1.2562; (R1) 1.2595; More...
Intraday bias in USD/CAD remains neutral at this point and some consolidations could be seen. Further rise remains in favor as long as 1.2485 resistance turned support holds. On the upside, break of 1.2805 will extend the rise from 1.2005 to 1.3022 medium term fibonacci level next. On the downside, however, break of 1.2485 will bring deeper fall back to next cluster support at 1.2301 (61.8% retracement of 1.2005 to 1.2805 at 1.2311).
In the bigger picture, fall from 1.4667 is seen as the third leg of the corrective pattern from 1.4689 (2016 high). It should have completed after hitting 1.2061 (2017 low) and 50% retracement of 0.9406 to 1.4689 at 1.2048. Sustained break of 38.2% retracement of 1.4667 to 1.2005 at 1.3022 will pave the way to 61.8% retracement at 1.3650 and above. Overall, medium term outlook remains neutral at worst with 1.2048/61 support zone intact.
Economic Indicators Update
| GMT | Ccy | Events | Actual | Forecast | Previous | Revised |
|---|---|---|---|---|---|---|
| 23:00 | AUD | Manufacturing PMI Jul P | 56.8 | 58.6 | ||
| 23:00 | AUD | Services PMI Jul P | 44.2 | 56.8 | ||
| 23:01 | GBP | GfK Consumer Confidence Jul | -7 | -9 | -9 | |
| 6:00 | GBP | Retail Sales M/M Jun | 0.50% | -1.40% | ||
| 6:00 | GBP | Retail Sales Y/Y Jun | 9.60% | 24.60% | ||
| 6:00 | GBP | Retail Sales ex-Fuel M/M Jun | 0.70% | -2.10% | ||
| 6:00 | GBP | Retail Sales ex-Fuel Y/Y Jun | 7.80% | 21.70% | ||
| 7:15 | EUR | France Manufacturing PMI Jul P | 58.3 | 59 | ||
| 7:15 | EUR | France Services PMI Jul P | 59 | 57.8 | ||
| 7:30 | EUR | Germany Manufacturing PMI Jul P | 64.1 | 65.1 | ||
| 7:30 | EUR | Germany Services PMI Jul P | 59.5 | 57.5 | ||
| 8:00 | EUR | Eurozone Manufacturing PMI Jul P | 62.5 | 63.4 | ||
| 8:00 | EUR | Eurozone Services PMI Jul P | 59.6 | 58.3 | ||
| 8:30 | GBP | Manufacturing PMI Jul P | 62.7 | 63.9 | ||
| 8:30 | GBP | Services PMI Jul P | 62 | 62.4 | ||
| 12:30 | CAD | Retail Sales M/M May | -3.00% | -5.70% | ||
| 12:30 | CAD | Retail Sales ex Autos M/M May | -5.00% | -7.20% | ||
| 13:45 | USD | Manufacturing PMI Jul P | 62 | 62.1 | ||
| 13:45 | USD | Services PMI Jul P | 64.8 | 64.6 |
GBP/USD Two Scenarios Likely
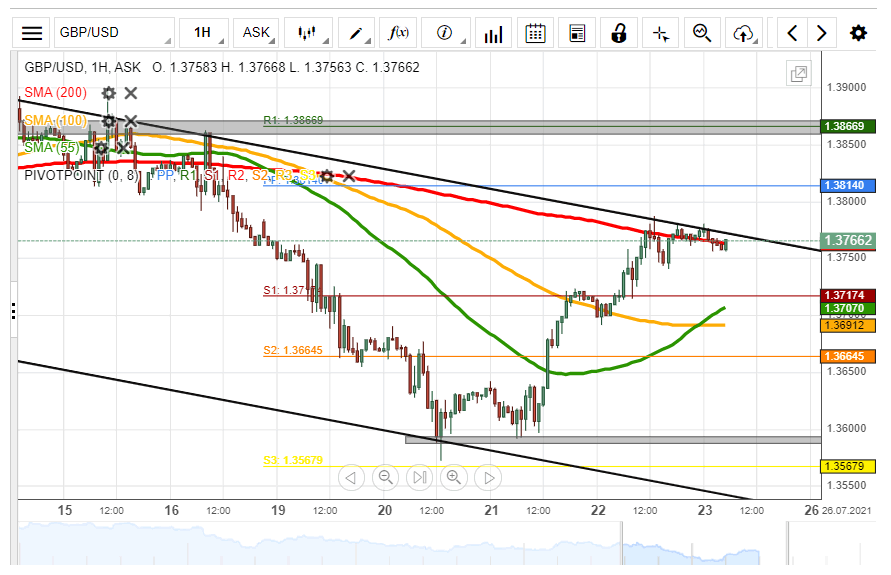
The British Pound edged higher by 84 pips or 0.61% against the US Dollar on Thursday. The surge was stopped by the 200– hour simple moving average at 1.3761 during yesterday's trading session.
The GBP/USD exchange rate is currently trading near the upper boundary of a descending channel pattern and could be set for a breakout.
If the breakout occurs, a surge towards the 1.3900 level could be expected within this session.
However, if the channel pattern holds, bears might target the support level formed by the 55– and 100– hour SMAs at 1.3699 today.
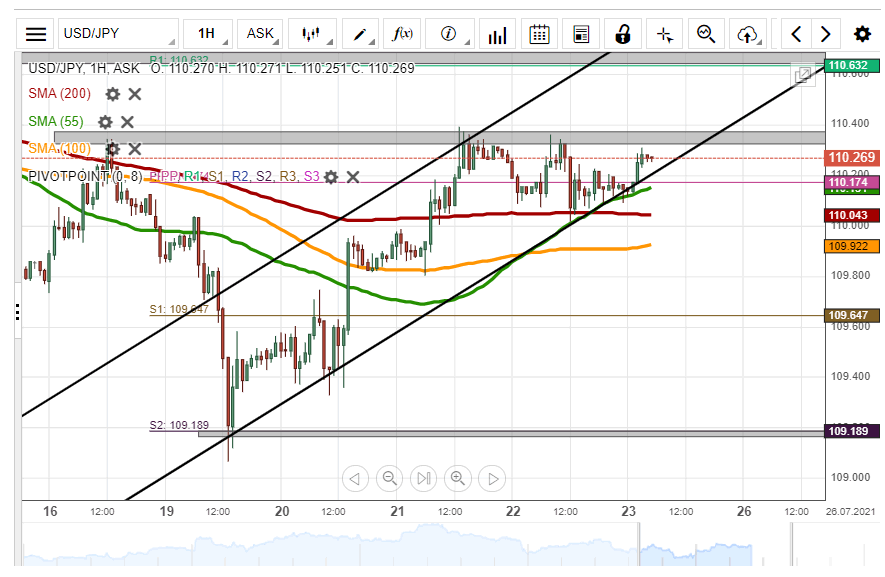
USD/JPY Could Target 110.60
On Thursday, the US Dollar declined by 27 pips or 0.25% against the Japanese Yen. The decline was stopped by the 200– hour simple moving average at 110.04 during Thursday's trading session.
All things being equal, the currency pair could continue to edge higher in an ascending channel pattern during the following trading session. The potential target for the exchange rate will be near the 110.63 level.
However, given that the currency exchange rate is currently trading near the lower boundary of an ascending channel pattern, a breakout might occur within this session.
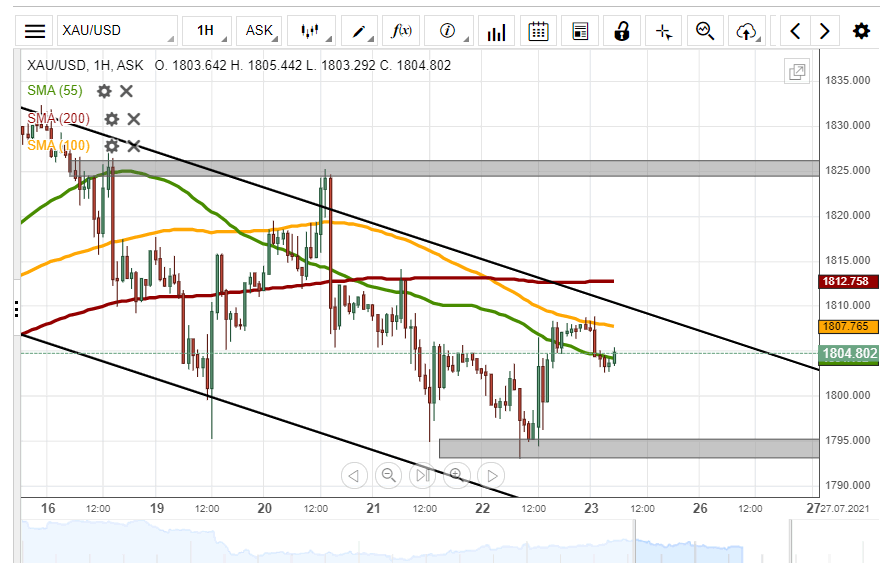
XAU/USD Tests 100- Hour SMA
The yellow metal's price edged higher by 0.73% on Thursday. The surge was stopped by the 100– hour simple moving average at 1808.01 during Thursday's trading session.
Given that the commodity is currently trading below the 55-, 100– and 200– hour SMAs, bearish traders might continue to drive the price lower during the following trading session.
However, the support level at 1795.00 could provide a barrier for the XAU/USD exchange rate within this session.
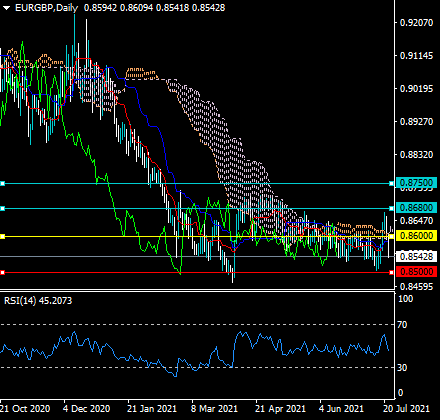
EURGBP Turning Bearish
Technical analysis
The EURGBP pair is looking bearish on the daily time frame. The Ichimolu indicator shows that the price has fallen below he Tenkan and Kijun Sens lines, and cloud support.
According to the RSI indicator the trend is now bearish as a below 50 reading is now being recorded. Typically, this is a bearish intraday sign and a sell signal.
What the possible outcomes are
In our most likely scenario, the EURGBP pair will start to decline towards the 0.8400 support level over the medium-term as the bearish trend starts to accelerate.
Alternatively, the EURGBP pair will move in a price range between the 0.8600 to 0.8500 before making a decisive breakout in either direction.
Key levels
Support 0.8500 0.8400
Resistance 0.8600 0.8680
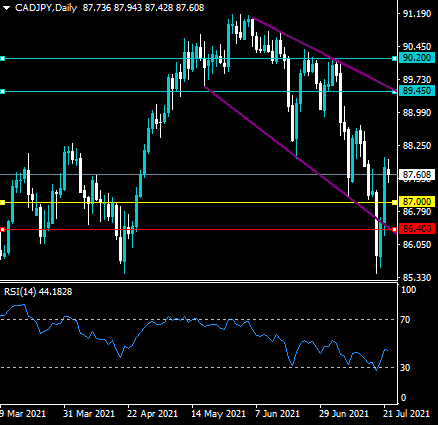
CADJPY Bullish Bias
Technical analysis
The CADJPY pair has remained above its trend defining 200-day moving average and the RSI indicator is recovering from oversold conditions.
The daily time frame shows that the CADJPY pair has moved back inside a large broadening descending wedge pattern. These patterns are typically considered to be bullish reversal patterns.
What the possible outcomes are
In our most likely scenario, the CADJPY pair test back towards the top of mentioned descending broadening wedge pattern, around the 1.8945 resistance level.
Alternatively, the CADJPY pair may correct back towards back towards the bottom of the wedge pattern one final time before attempting to break above the 1.8945 resistance level.
Key levels
Support 1.8700 1.8640
Resistance 1.8945 1.9020
XRPUSD Now Bullish
Technical analysis
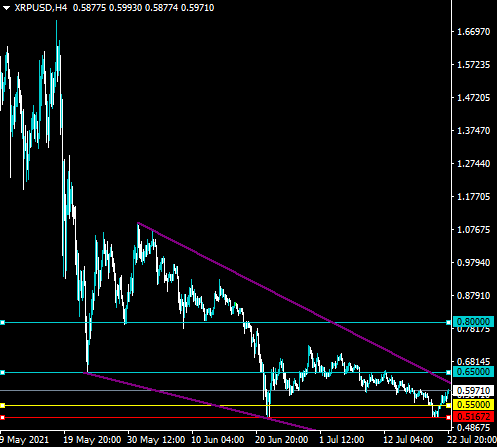
The XRPUSD pair has stabilized above the $0.5500 level, this is a very good sign as bulls could be preparing to target the $0.6500 level.
The four-hour time frame shows that a bullish breakout from a falling wedge pattern will take place if XRPUSD bulls can move past the $0.6300 resistance level.
What the possible outcomes are
In our most likely scenario, the XRPUSD pair will continue to head higher, and eventually head back towards the $0.6500 resistance level after recently finding a meaningful price support.
Alternatively, the XRPUSD pair could correct back towards the $0.5500 area and then start to rally back towards the $0.6500 level.
Key levels
Support $0.5500 $0.5167
Resistance $0.6500 $0.8000