

Sample Category Title
BTCUSD Still Bullish
Technical analysis
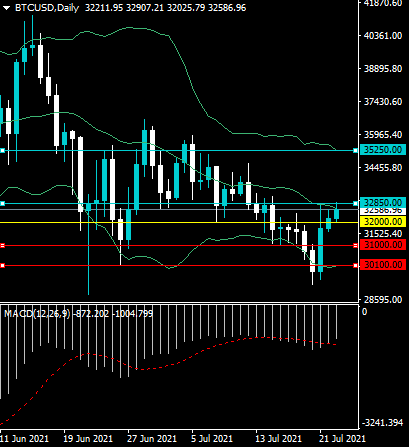
The BTCUSD pair is consolidating around the mid-line of the daily Bollinger Band. A break above the mid-line exploses further gains towards the upper daily Bollinger Band, around the $35,250 level.
The daily time frame also shows that large amounts of bullish MACD price divergence is present, and extends up until the $36,000 resistance level.
What the possible outcomes are
In our most likely scenario, the BTCUSD pair breaks above the mid-line of the daily Bollinger Band indicator and advances towards at least the $35,250 level.
Alternatively, the BTCUSD pair may fail to move above the mid-line of the daily Bollinger Band and reverse back towards the lower Bollinger Band.
Key levels
Support $31,000 $30,100
Resistance $32,850 $35,250
USDCAD Now Bearish
Technical analysis
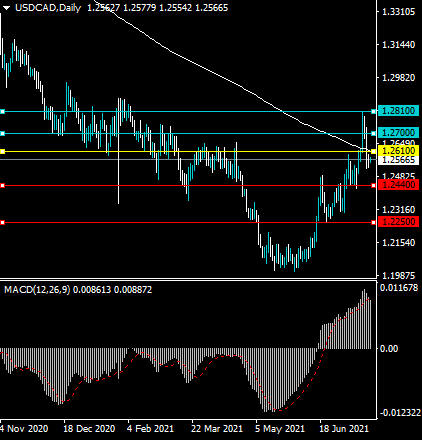
The USDCAD pair is bearish after moving back under its 200-day moving average. The early-week move higher appears to have been a false technical breakout.
The daily time frame shows that significant amounts of bearish MACD price divergence has formed. The MACD price divergence extends down towards the 1.2250 level.
What the possible outcomes are
In our most likely scenario, the bearish price trend will remain in place and the USDCAD pair will continue to decline back towards the 1.2250 level over the medium-term time horizon.
Alternatively, the USDCAD pair will stage another technical test back towards its 200-day moving average, above the 1.2600 level, and then start to sell-off again.
Key levels
Support 1.2440 1.2250
Resistance 1.2620 1.2700
ECB SPF sees higher inflation and growth in 2021 and 2022
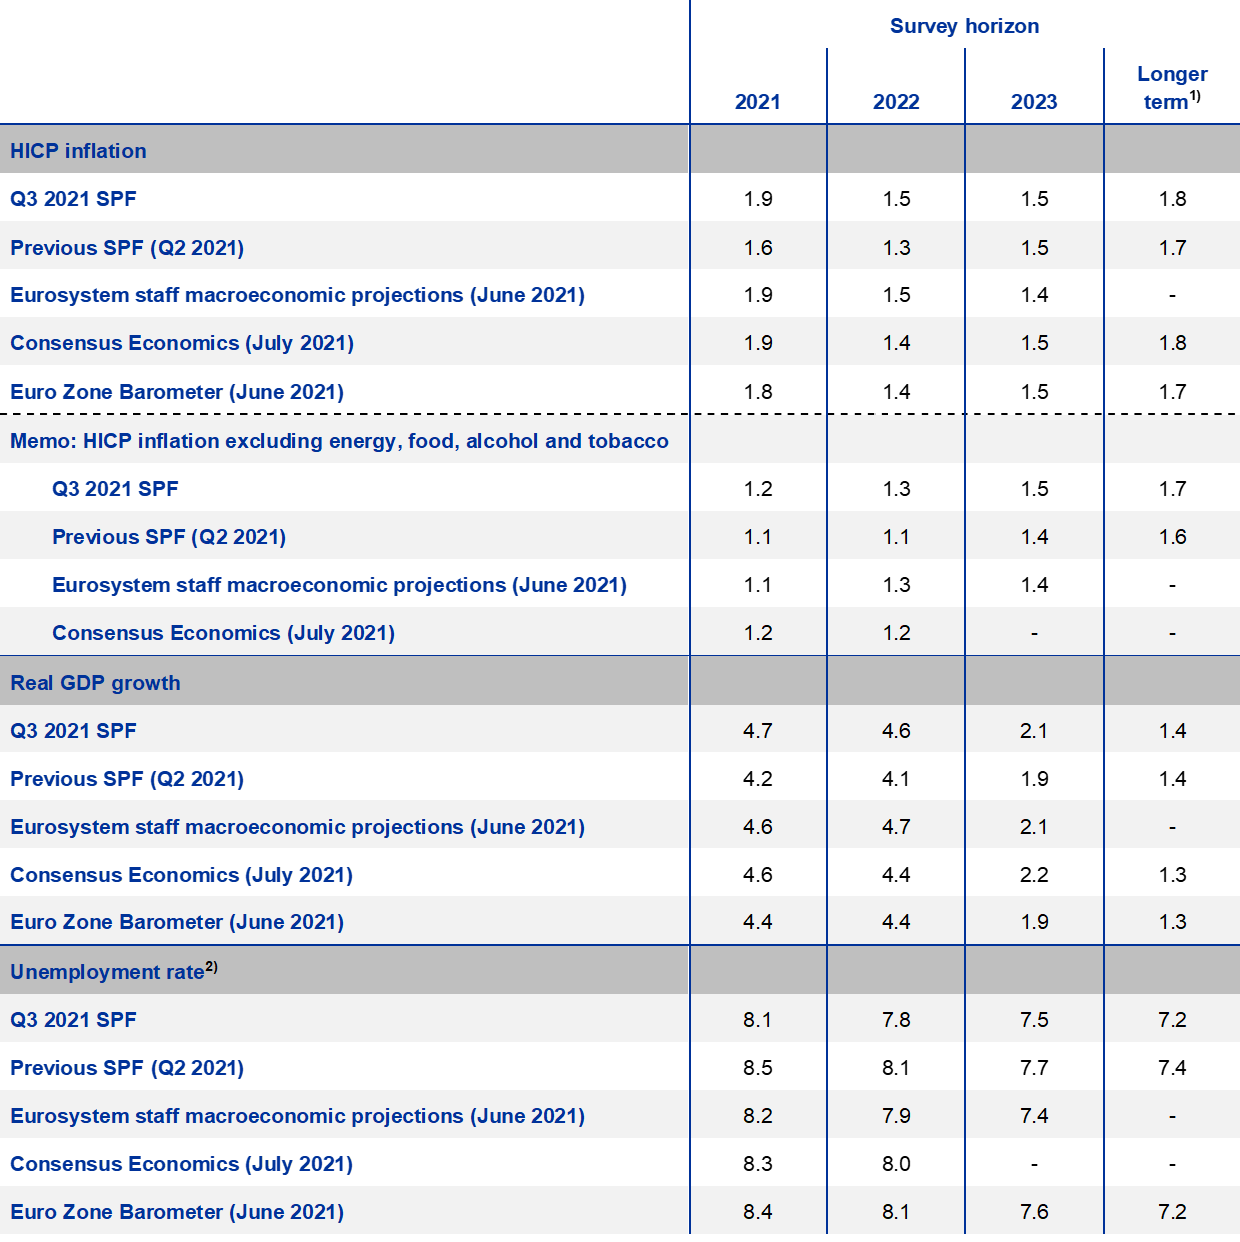
In the ECB Survey of Professional Forecasters (SPF) for Q3, inflation expectations for Eurozone were revised up for 2021 and 2022. Growth projections were upgraded across the horizon while unemployment forecasts were revised down.
Inflation forecast:
- For 2021 at 1.9% (revised up from Q2 forecast at 1.6%).
- For 2022 at 1.5%, (up from 1.3%).
- For 2023 % 1.5% (unchanged).
Real GDP growth forecast:
- For 2021 at 4.7% (up from 4.2%).
- For 2022 at 4.6% (up from 4.1%).
- For 2023 at 2.1% (up from 1.9%).
Unemployment rate forecast:
- For 2021 at 8.1% (down from 8.5%).
- For 2022 at 7.8% (down from 7.8%).
- For 2023 at 7.5% (down from 7.7%).
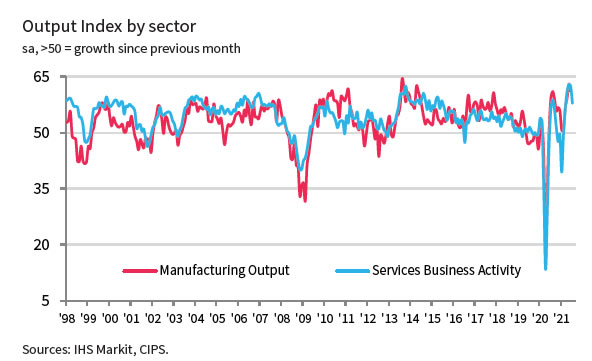
UK PMI composite dropped to 57.7, Delta variant overshadowed freedom day
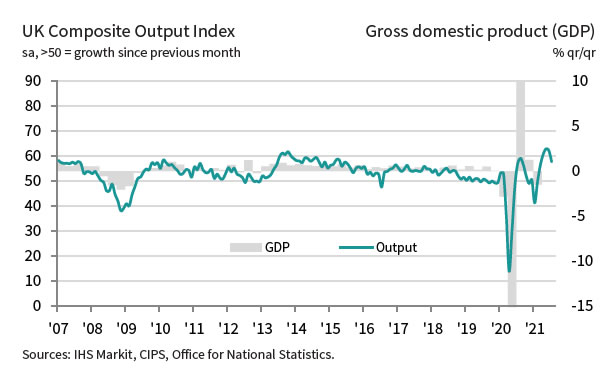
UK PMI Manufacturing dropped from 63.9 to 60.4, below expectation of 62.7. PMI Services dropped from 62.4 to 57.8, below expectation of 62.0. PMI Composite dropped from 62.2 to 57.7.
Chris Williamson, Chief Business Economist at IHS Markit, said: "July saw the UK economy's recent growth spurt stifled by the rising wave of virus infections, which subdued customer demand, disrupted supply chains and caused widespread staff shortages, and also cast a darkening shadow over the outlook.
"Concerns over the Delta variant have meanwhile overshadowed the passing of "freedom day", and were a key factor alongside Brexit and rising costs behind a sharp slide in business expectations for the year ahead, which slumped to the lowest since last October. The PMI indicates that GDP growth will likely have slowed in the third quarter, after having rebounded sharply in the second quarter."
EUR/USD Outlook: Extended Consolidation To Precede Final Push Towards Key Supports
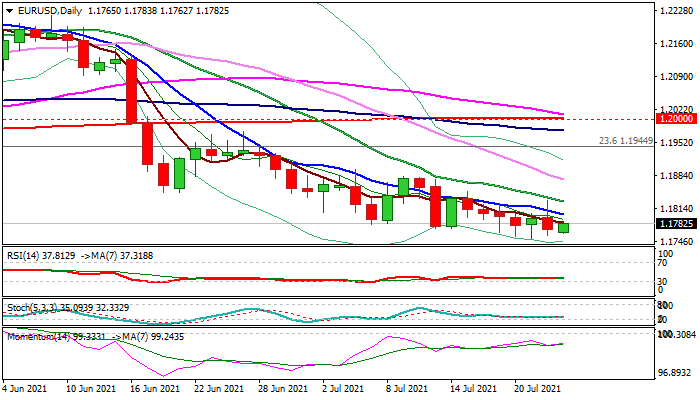
The EURUSD is holding near the new multi-week low in early European trading on Friday, after strong upside rejection and subsequent drop on Thursday.
The short-lived positive impact from ECB resulted in a brief correction which was capped by initial barriers (falling 10/20DMA’s).
Upbeat German PMI data keep the pair afloat, but the reaction was so far minor.
Thursday’s bearish daily candle with long upper shadow, weighs on near-term action, with negative daily studies, adding to the bearish outlook.
Formation of multiple death crosses (10/200, 20/200, 30/200 DMA’s) provided additional negative signals for the continuation of larger downtrend and attack at key targets at 1.1704/1.1694 (2021 low/Fibo 38.2% of 1.0635/1.2349 rally).
Friday’s close below falling 20DMA (1.1829) to confirm bearish bias.
Res: 1.1801, 1.1829, 1.1850, 1.1881.
Sup: 1.1751, 1.1737, 1.1704, 1.1694.
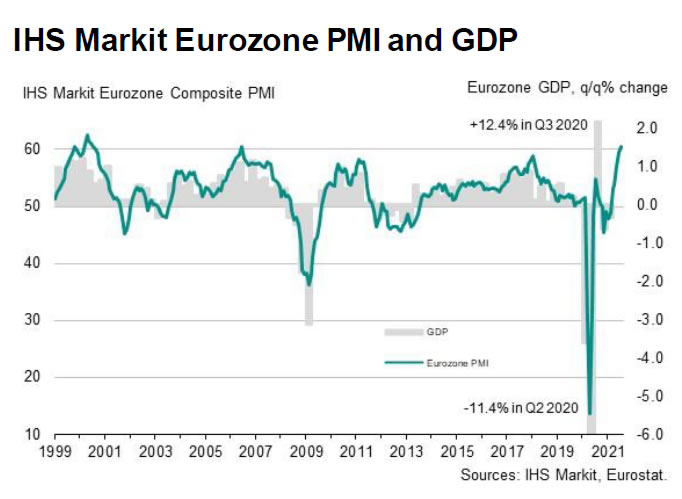
Eurozone PMI composite rose to 60.6, 21-yr high, enjoying a summer growth spurt
Eurozone PMI Manufacturing dropped from 63.4 to 62.6 in July, above expectation of 62.5. PMI Services rose from 58.3 to 60.4, above expectation of 59.6, a 181-month high. PMI Composite rose from 59.5 to 60.6, highest in 252 months.
Chris Williamson, Chief Business Economist at IHS Markit said: "The eurozone is enjoying a summer growth spurt as the loosening of virus-fighting restrictions in July has propelled growth to the fastest for 21 years. The services sector in particular is enjoying the freedom of loosened COVID-19 containment measures and improved vaccination rates, especially in relation to hospitality, travel and tourism."
GBPJPY Proceeds Higher After Bullish Doji
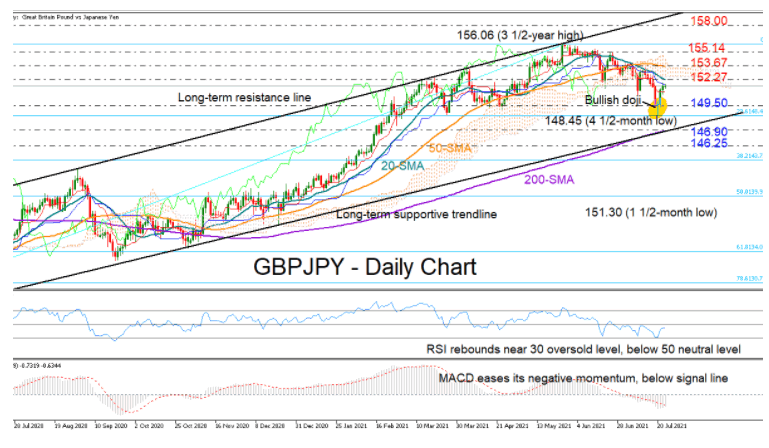
GBPJPY is pushing for another green day, justifying the bullish dragonfly doji candlestick formed on Tuesday following the bounce on the 4 ½-month low of 148.45 and the 23.6% Fibonacci retracement of the March 2020 – May 2021 upleg.
While the bearish cross between the 20- and 50-day simple moving averages (SMAs) is dashing hopes for a trend improvement in the short-term picture, the soft recovery in the MACD and the upturn in the RSI raise expectations that positive momentum could persist. Yet, some caution is still required as the former has yet to cross above its red signal line and the latter continues to fluctuate below its 50 neutral mark.
Looking for resistance levels, the blue Kijun-sen line at 151.79 and the 20-day SMA at 152.27 may prevent the price from touching the 50-day SMA at 153.67. Higher, a break above the 155.14 barrier would shift the spotlight straight to the 156.03 peak, where any violation may prompt a new bullish round towards the 158.00 mark and the long-term resistance line.
Alternatively, a downside reversal may initially pause around 149.50 before heading again for the 23.6% Fibonacci and the 148.45 low. Slightly beneath, a tougher battle could take place near the long-term ascending trendline drawn from the 2020 bottom and the 200-day SMA currently at 146.90. Should sellers gain more ground, the next rebound could occur around 146.25.
In brief, the technical picture suggests GBPJPY could extend its recovery within the short-term bearish trajectory, with the confirmation likely coming above 152.27.
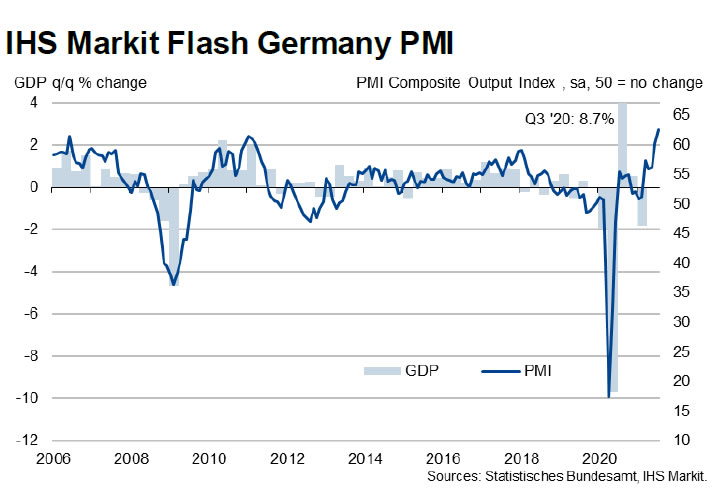
Germany PMI composite rose to record 62.5, remains in the fast lane
Germany PMI Manufacturing rose from 65.1 to 65.6 in July, above expectation of 64.1. PMI Services rose from 57.5 to 62.2, above expectation of 59.5, record high since June 1997. PMI Composite rose from 60.1 to 62.5, record high since Jan 1998.
Phil Smith, Associate Director at IHS Markit said: "Germany's private sector economy remains in the fast lane to recovery, according to July's flash PMI survey. Buoyed by a resurgent service sector, the survey's headline index is now at a record high and signals that the recovery still possesses strong momentum at the start of the third quarter."
Oil Rises, Gold Steady
Oil rallies once again
The fast money FOMO gnomes were out in force once again in oil markets overnight, pushing prices higher despite nothing really materially changing in the world overnight. Gone is the “delta-dismay” of Monday’s speculative-long capitulation, and in with the fear of missing out on the next rally. As I have stated previously, I felt any sell-off would be short in duration, but I will admit oil’s comeback has surprised me and highlights that tail-chasing fast money is what is driving oil prices right now.
Overnight, Brent crude rose 1.95% to USD 73.60 a barrel, with WTI leaping by 2.15% to USD 71.65 a barrel. Both contracts have now recouped all of their losses for the week. The price action has left Asian markets somewhat bemused, with all thoughts of bargain hunting consigned to the rubbish bin. Therefore, regional markets are choosing to sit on their hands today, leaving both Brent and WTI unchanged in early trading.
The massive ranges this week have left the chart picture a bit of a mess. Both Brent and WTI are now effectively unchanged for the week, and on that basis, I believe the best of the rallies are over for now in the short term.
Brent crude has resistance nearby at USD 74.00 a barrel and WTI at USD 72.00 a barrel. I believe as we run into the end of the week, both contracts will struggle to sustain gains above those levels unless we get a news headline surprise. Brent crude has immediate support at USD 72.00 a barrel, while WTI’s support is at USD 70.00 a barrel.
Gold tests support once again
Gold once again probed downside support overnight, but the 100-DMA held, and gold ended a non-descript session 0.17% higher at USD 1806.50 an ounce. In equally directionless Asian trading, gold has faded slightly to USD 1803.50 an ounce this morning.
The 100-DMA, today at USD 1796.25 an ounce, continues to provide quite solid support and has comfortably blocked any deeper sell-offs over the past two weeks. However, I note that the rallies are getting ever shallower with gold now, tracing out a series of lower highs over this week. That, I believe, is signalling those risks are increasing for a deeper gold sell-off, as the US dollar stays firm and even as US bond yields fall, which should be supportive.
A daily close below USD 1790.00 an ounce will signal a deeper correction that could reach as far as support at USD 1750.00 an ounce, especially if stop-loss sellers are forced to the market. Above, gold has resistance at USD 1810.00 an ounce, followed by the 200-DMA at USD 1824.00 an ounce. Only a daily close above the 200-DMA will shift the bearish outlook.
Currency Markets Consolidate
ECB meeting a sleeper
The ECB policy meeting failed to shake up volatility in currency markets, something I got badly wrong yesterday. With the meeting passing without incident, currency markets settled into a directionless range-trading session, with the US dollar content to continue consolidating recent gains. With no direction from North America, and a Japan holiday reducing liquidity anyway, the Asian session is off to an equally quiet start which will likely be the tone for the remainder of the Asian day.
EUR/USD is at 1.1775 this morning, not far away from support at 1.1750. A dovish ECB still leaves the single currency with a downside bias with failure of 1.1750 signally a retest of 1.1700. Only a rally through resistance at 1.1850 will change the outlook. GBP/USD closed above its 200-day moving average at 1.3708 overnight, continuing its quite impressive recovery. GBP/USD is at 1.3770 today, awaiting a move through either 1.3600 or 1.3900 to signal its next medium-term directional move. The reopening doom and gloom headlines have dimmed as the week has gone on, suggesting that the upside may be the path of least resistance for Her Majesty’s British pound.
The US dollar index was almost unchanged overnight at 92.85, roughly in the middle of a broader 92.50 to 93.20 trading range for the week. Inflows into the US bond and equity markets continue to support the greenback on dips while at the same time, it lacks the conviction/momentum to test 93.20 convincingly. The data calendar and Capitol Hill risk tighten up considerably next week, and the US dollar direction should resolve one way or the other. In the meantime, patience is required.
USD/CNY remains marooned between 6.4500 and 6.4900, with the 100-DMA today at 6.4720, acting as an intra-day pivot of late for day traders. The PBOC seems content with the level of the yuan at these levels, having nipped the appreciation trend in the bud for now. Both the Malaysian ringgit and Indonesian rupiah made sharp gains overnight, which I attribute to yet another spike in oil prices. USD/THB, though, remained locked at its recent highs, trading at 32.93 today. As an unofficial index of the delta variant in Asia, I believe that the overnight rallies by MYR and IDR are temporary and that their downtrend will resume sooner rather than later, along with the THB.