

Sample Category Title
AUDUSD Uptick From Near 8-Month Low May Be Short Lived
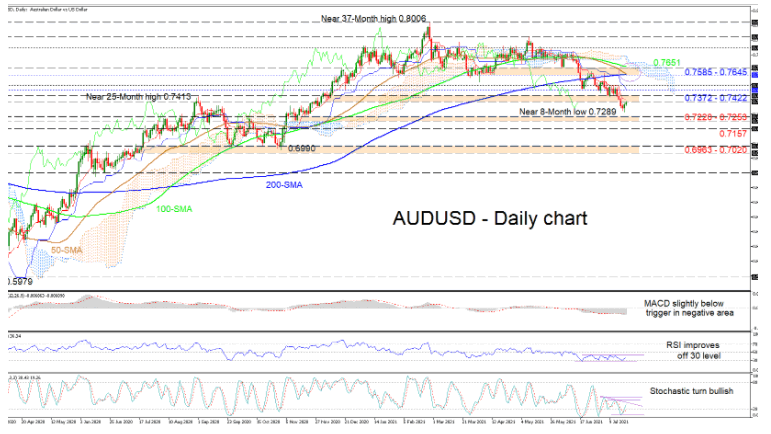
AUDUSD is striving to extend above the curbing boundary of 0.7372-0.7422 after buyers re-emerged around a near 8-month low of 0.7289. The short-term picture suggests that sellers have gained the upper hand, which could be further confirmed by the completion of forthcoming bearish crossovers of the 200-day simple moving average (SMA) by the diving 50- and 100-day SMAs.
The Ichimoku lines are indicating a pause in negative pressures, while the short-term oscillators are transmitting mixed signals in directional momentum. The MACD below zero has nudged a tad beneath its flattened red trigger line, while the RSI has bounced off the 30 level. The stochastic oscillator has adopted a bullish tone, but is showing that upside forces will need to step up to shift the sentiment increasingly positive.
In an improving scenario, resistance may originate from the 0.7372-0.7422 capping barrier. Should buying interest persist, the bulls may then meet further restraints at the blue Kijun-sen line at 0.7465 and the nearby high at 0.7502. Piloting higher, significant upside limitations could transpire from the section of resistance of 0.7585-0.7645, which is fortified by the 50- and 100-day SMAs and the Ichimoku cloud.
If sellers resurface and steer the price down, initial support could arise from the 0.7289 low and the neighbouring boundary of 0.7220-0.7253. Another leg lower could then test the 0.7157 barrier. Should the pair sink even further, the support base of 0.6963-0.7020, formed over mid-July to the end of October, could attempt to dismiss the decline from gathering additional downward pace.
Summarizing, AUDUSD remains heavy beneath the 0.7500 border and far below the SMAs. For the pair to regain a positive vibe, the price would need to elevate above the 0.7645 mark and the cloud.
GBP/USD Outlook: Fresh Recovery Needs More Evidence To Confirm Reversal
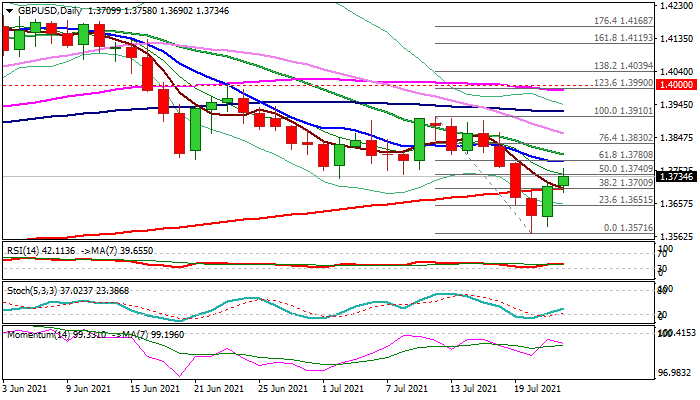
Cable extends gains into the second straight day, following Wednesday’s 0.6% rebound after being firmly in red for four consecutive days.
Bullish signal from Wednesday’s bullish engulfing was boosted by return and close above 200DMA, with today’s bullish close required to confirm reversal signal.
Bullseye initial targets at 1.3780 (10DMA/Fibo 61.8% of 1.3910/1.3571) and 1.3800 (20DMA), break of which would accelerate recovery.
Caution on rising bearish momentum which is diverging from price action and warning of possible recovery stall.
Broken 200DMA marks pivotal support (1.3700) and close back below the indicator would revive bears.
Res: 1.3758; 1.3780; 1.3800; 1.3830.
Sup: 1.3700; 1.3690; 1.3651; 1.3591.
Markets Shake Off Worries: ECB May Press On Yields And Euro
Buyers once again dominate the markets. The S&P500 added 0.8%, back to a week ago levels, and now just 0.6% below all-time highs. Since last November, this US broad market index has repeatedly found support on dips below its 50-day moving average, with the recent drawdown was no exception.
Earlier this year, such mini-corrections were followed by a renewal of historic highs - a possibility this time as investors and traders have seen enough demand for stocks during the downturn. Markets avoided the worst-case scenario of a spiraling selloff.
Oil added 5% on Wednesday, now trading near $71.40 for Brent. The pullback has stopped near the 76.9% Fibonacci retracement, which is a very bullish case. Oil is helped by a further decline in commercial stockpiles, indicating an operational deficit in oil despite fears of a fall in demand due to a new wave of covid contagion.
The Brent price is testing the 50-day moving average on the daily charts. Only a bold rise above $72 will be a signal for a new bullish assault.
In the meantime, gold remains one of the laggards, having moved back below $1800. Last week, it failed to break above the 50 and 200-day average cluster area, putting selling back on the agenda. Locally, the price of gold went down along with rising long-term government bond yields. The inverse correlation of these assets is also strong on long periods, causing pressure on the gold price during rising rates times.
The issue of rates will be considered by the ECB today. It will be the first meeting since the European Central Bank formally raised its inflation target and noted a tolerance for exceeding it to revive the economy.
Some economists do not rule out that the said strategy revision would entail additional policy easing. It is unlikely that we will see such steps from the ECB right now. Still, in the longer term, we could see an extension of QE, which could pressure medium-term interest rates, potentially supporting gold and interest in equities while hurting the euro.
BoE Broadbent: The appropriate policy response to current inflation is nothing
BoE Deputy Governor Ben Broadbent said in a speech, "most of the overshoot relative to target in the latest CPI numbers... reflects unusually strong inflation in goods prices". That would also be true of the "larger overshoot we're going to see towards the end of this year". "If this was only a story about global goods prices," he added, then the appropriate policy response to the current inflation would be "nothing".
Also, "while we know it's going to go further over the next few months, I'm not convinced that the current inflation in retail goods prices should in and of itself mean higher inflation 18-24 months ahead, the horizon more relevant for monetary policy," he added.
The Analytical Overview Of The Main Currency Pairs
The EUR/USD currency pair
Technical indicators of the currency pair:
Prev Open: 1.1777
Prev Close: 1.1794
% chg. over the last day: +0.14%
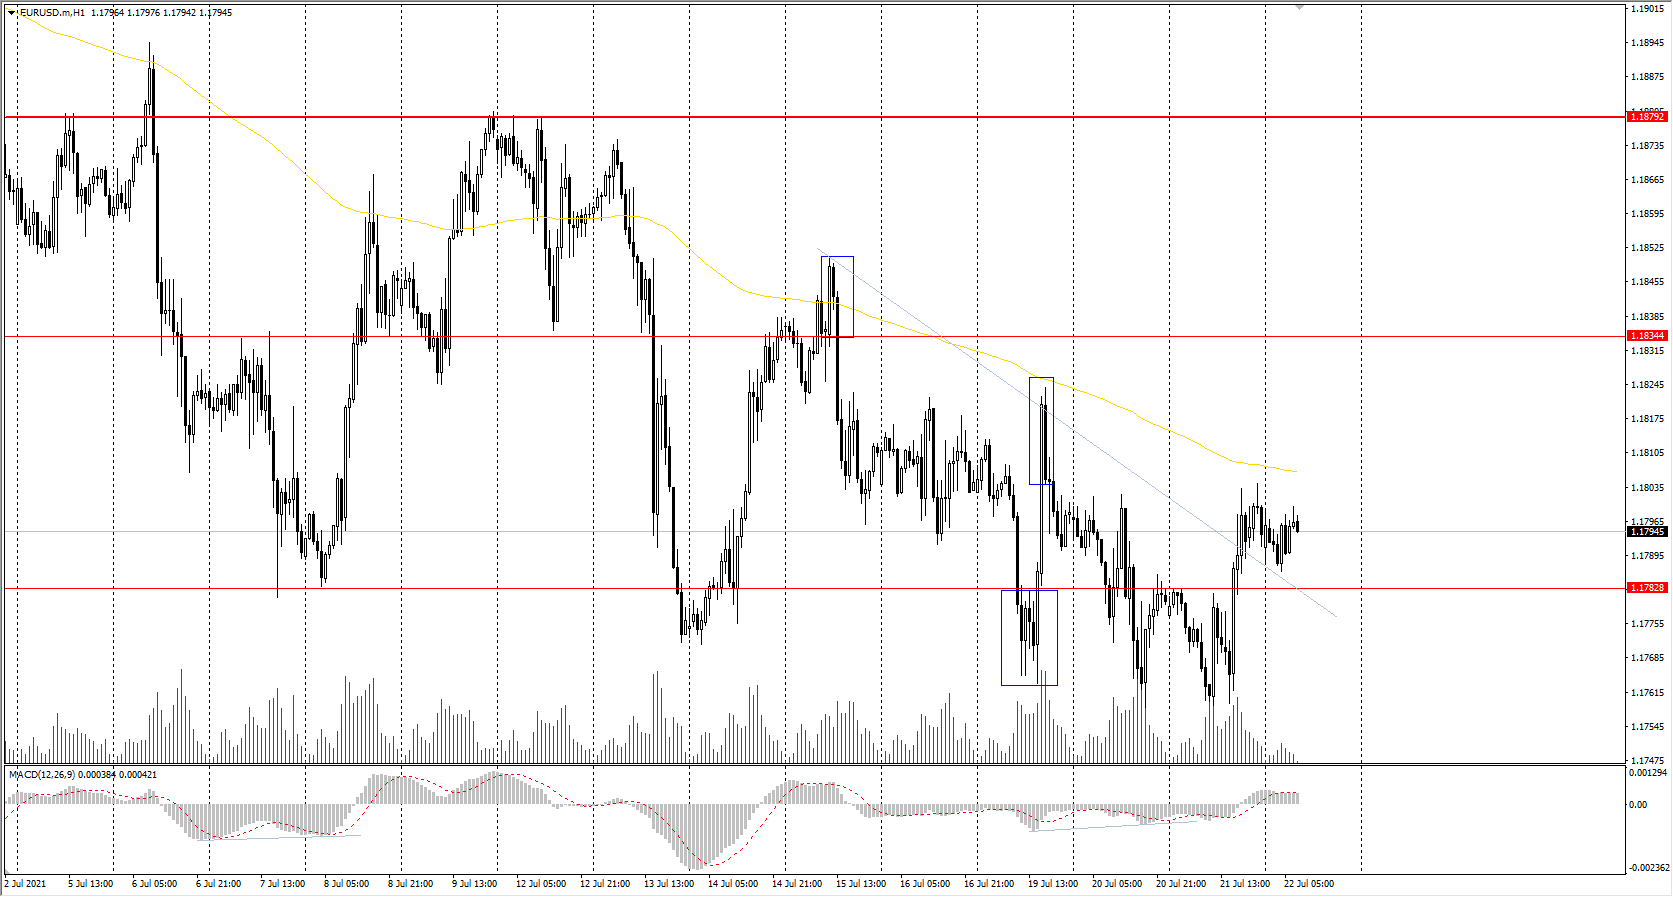
The Federal Reserve is printing more money than the European Central Bank, but the ECB has been buying more assets than the Fed for the whole week. This behavior led to a temporary decline in the euro. But now, the situation is playing in favor of the euro as the Fed will print much more money this week, which will have a negative impact on the dollar index.
Trading recommendations
Support levels: 1.1783, 1.1746, 1.1609
Resistance levels: 1.1834, 1.1879, 1.1934, 1.1969
From the technical point of view, the trend is still bearish. Sellers' weakness has been replaced by buyers' initiative. Traders should expect increased volatility with the release of the ECB news. Price can go either way, but buying positions are preferable now, despite the fact that there is a downtrend observed on the timeframe. The divergence on the MACD indicator has not been fully worked out yet on higher timeframes.
Alternative scenario: if the price breaks through the 1.1879 resistance level and fixes above, the general uptrend is likely to be resumed.
News feed for 2021.07.22:
- Eurozone Deposit Facility Rate (m/m) at 14:45 (GMT+3);
- Eurozone ECB Marginal Lending Facility at 14:45 (GMT+3);
- Eurozone ECB Monetary Policy Statement at 14:45 (GMT+3);
- Eurozone ECB Interest Rate Decision at 14:45 (GMT+3);
- Eurozone ECB Press Conference at 15:30 (GMT+3);
- US Initial Jobless Claims (w/w) at 15:30 (GMT+3).
The GBP/USD currency pair
Technical indicators of the currency pair:
Prev Open: 1.3620
Prev Close: 1.3708
% chg. over the last day: +0.64%
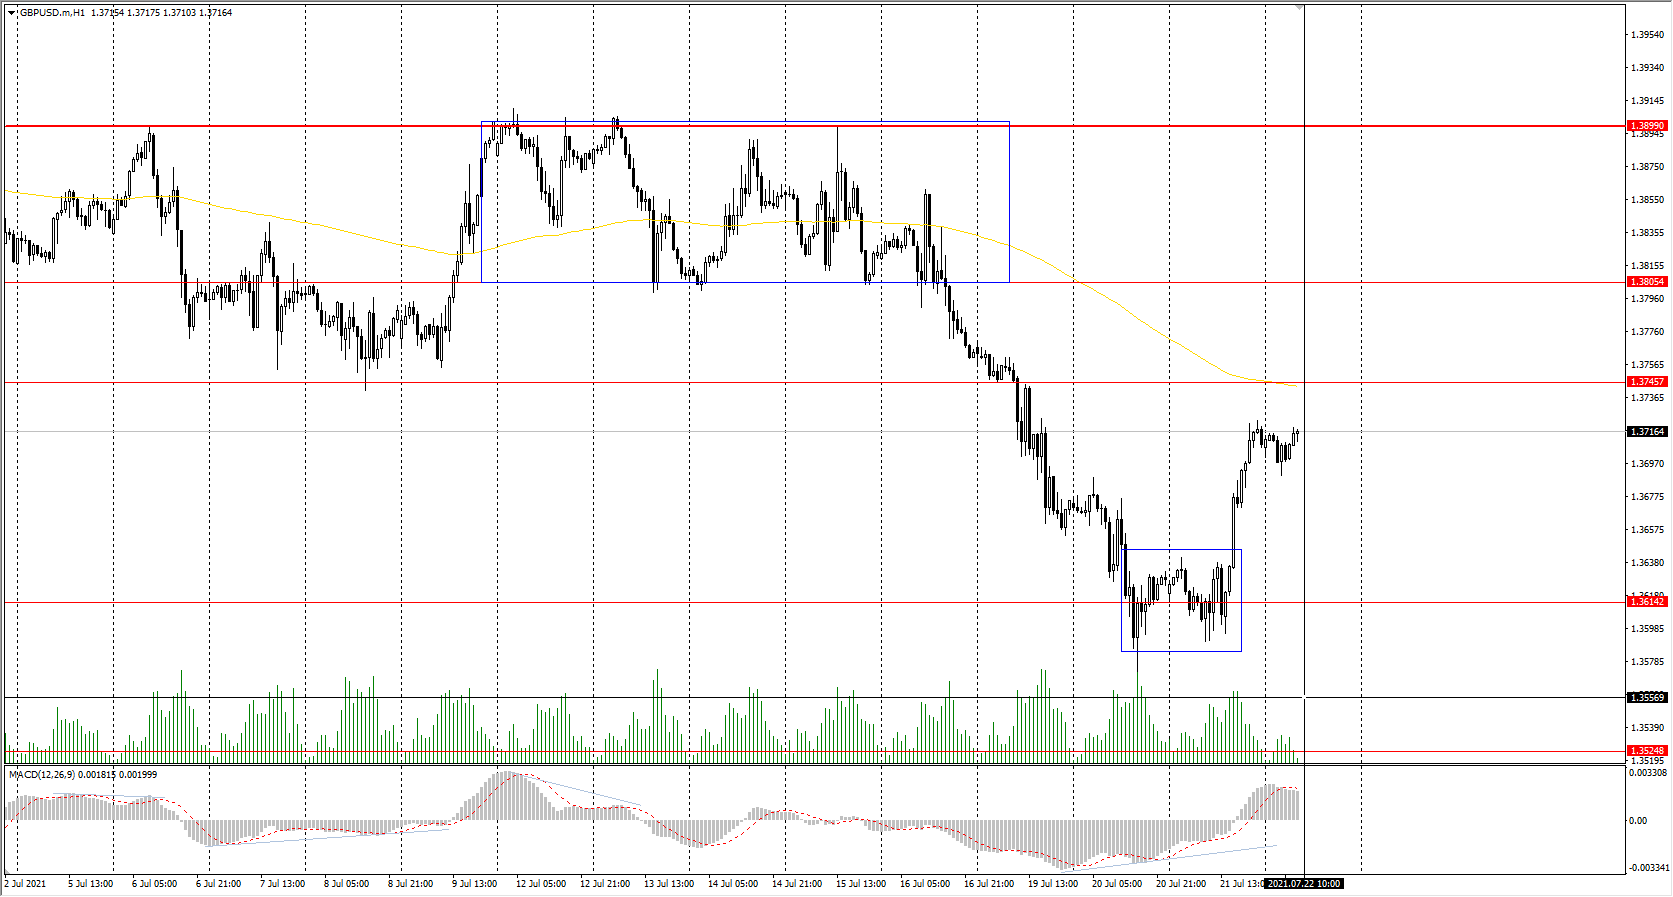
Against the background of the dollar index decrease, the British pound increased by 0.64% yesterday. The coronavirus situation in the UK is rapidly deteriorating after the restrictions were lifted. Still, authorities are confident that this is a short-term spike, which will decrease as the vaccination rate is accelerating.
Trading recommendations
Support levels: 1.3614, 1.3525
Resistance levels: 1.3745, 1.3805, 1.3899, 1.3923, 1.4002, 1.4075, 1.4101
The trend on the GBP/USD currency pair is downward on the H1 timeframe. Yesterday, the buyers took the initiative and formed a false breakdown zone at the bottom, which traders can use to enter long positions. The MACD indicator returned to the positive zone. Under such market conditions, traders are better to look for both sell deals from the resistance levels within the trend and buy deals from the support levels, but only on the intraday timeframes and with short targets.
Alternative scenario: if the price breaks through the 1.3899 resistance level and consolidates above, the bearish scenario is likely to be canceled.
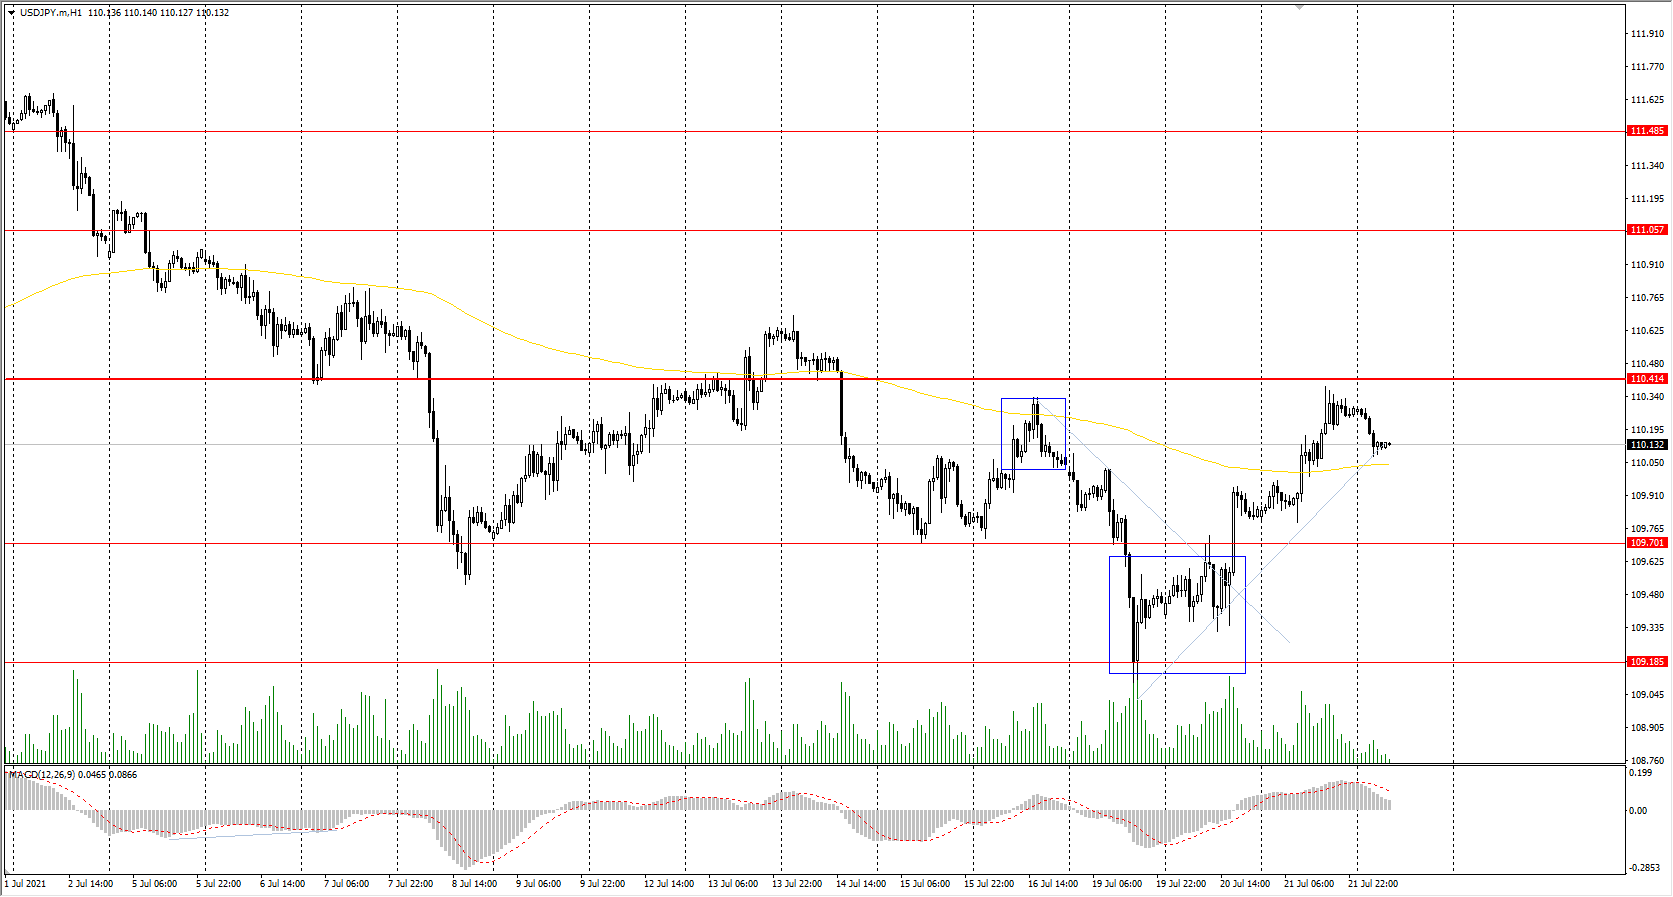
The USD/JPY currency pair
Technical indicators of the currency pair:
Prev Open: 109.92
Prev Close: 110.29
% chg. over the last day: +0.33%
The USD/JPY currency pair increased by 0.33% yesterday and approached the priority change level. At the same time, both the dollar index and the Japanese yen futures fell yesterday. This suggests that both currencies are demonstrating weakness. A lot will depend on the movement of the dollar index now and its reaction to the release of the weekly labor market news today.
Trading recommendations
Support levels: 109.70, 109.19, 108.65
Resistance levels: 110.41, 110.73, 111.06, 111.48, 110.73, 112.18
From the point of view of technical analysis, the situation has not changed. There is a downward trend on the H1 timeframe, as the price is still trading below the priority change level and the moving average. The MACD indicator tends to zero but in the positive zone. Under such market conditions, traders should look for both selling from the resistance levels and buying from the support levels, but only with short targets.
Alternative scenario: if the price rises above 110.41, the uptrend is likely to be resumed.
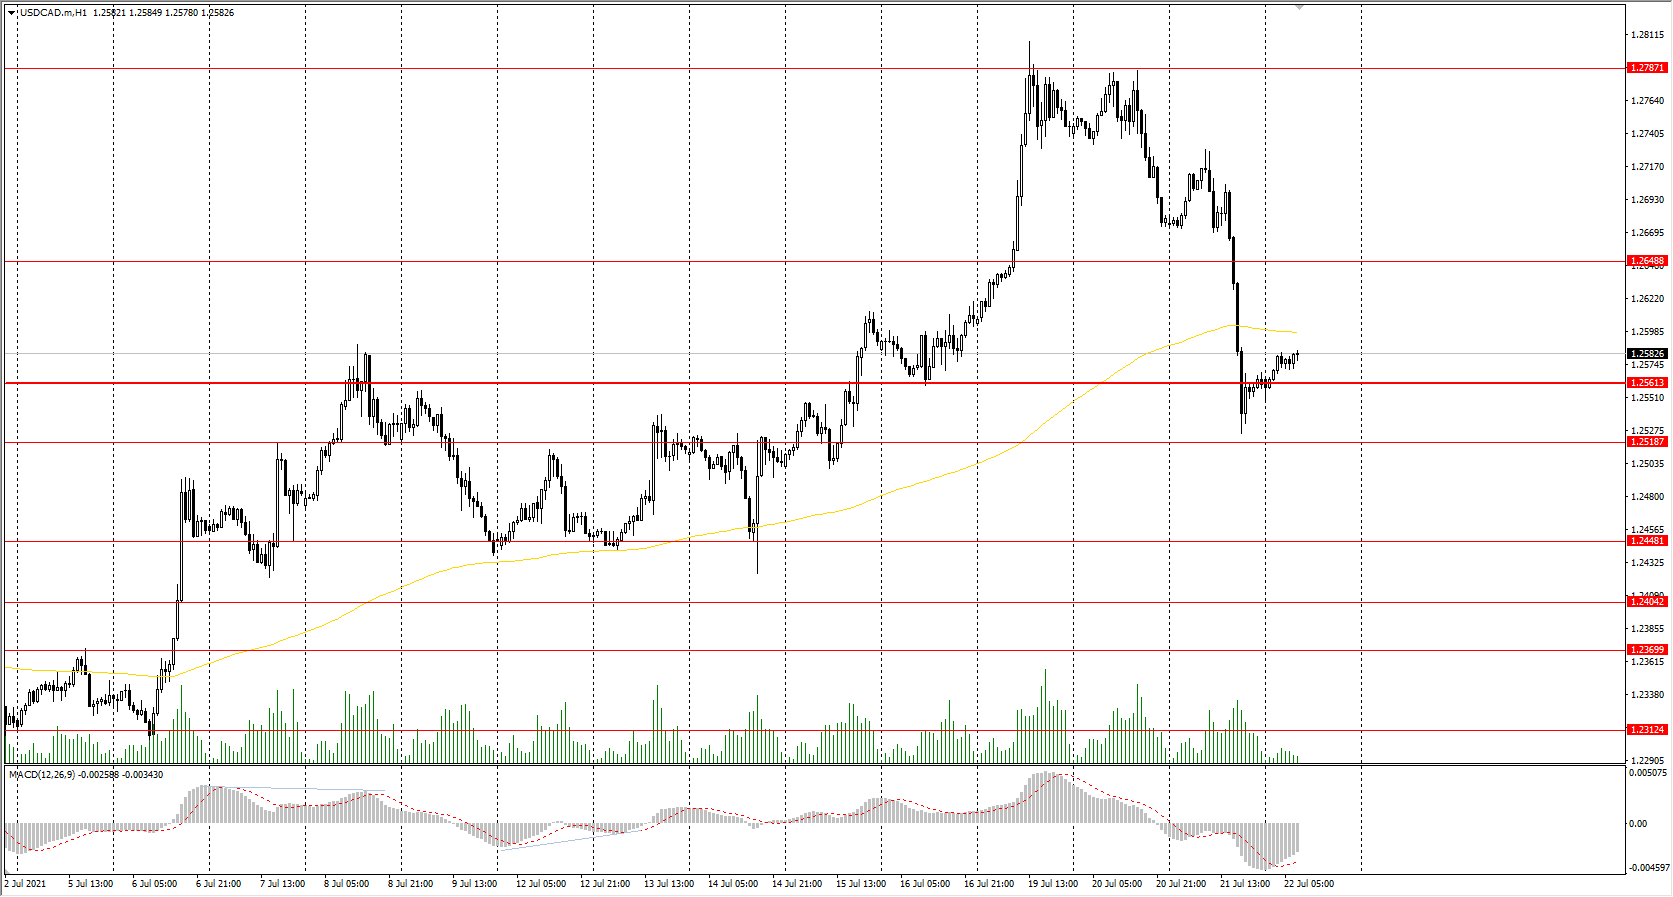
The USD/CAD currency pair
Technical indicators of the currency pair:
Prev Open: 1.2675
Prev Close: 1.2561
% chg. over the last day: -0.90%
The Canadian dollar is a commodity currency and is highly dependent on oil price movements. Oil prices jumped sharply by 5% with the release of the inventory news yesterday, which caused the Canadian dollar futures to strengthen and the USD/CAD to fall (inverse correlation).
Trading recommendations
Support levels: 1.2561, 1.2519, 1.2448, 1.2404, 1.2347, 1.2312
Resistance levels: 1.2649, 1.2787, 1.2951
Technically, the trend remains bullish. But the price tested the priority change level, followed by a weak rebound. Under such market conditions, it is better to consider intraday trading. Buy positions should be looked for at the nearest support levels, but it is better to buy with confirmation. Talking abut selling positions, traders should t wait for a pullback to the nearest resistance level.
Alternative scenario: if the price breaks through the 1.2561 support level and fixes below, the downtrend is likely to be resumed.
GBP/JPY Daily Outlook
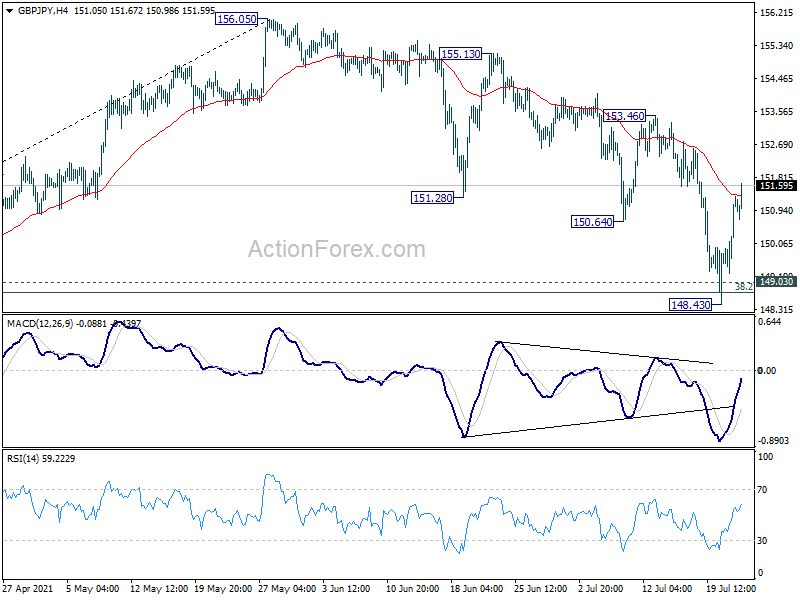
Daily Pivots: (S1) 149.91; (P) 150.63; (R1) 151.97; More...
GBP/JPY's rebound from 148.43 extends to as high as 151.67 so far. Break of 151.8 support turned resistance argues that correction from 156.05 has completed, after defending 38.2% retracement of 136.96 to 156.05 at 148.75. Intraday bias is back on the upside for 153.46 resistance first. Break will bring retest of 156.05 high.
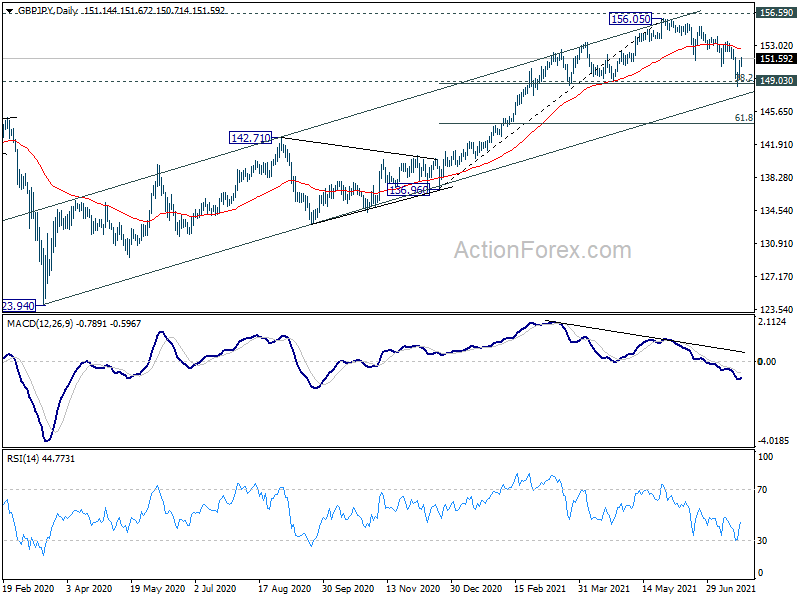
In the bigger picture, rise from 123.94 is seen as the third leg of the pattern from 122.75 (2016 low). Focus remains on 156.59 resistance (2018 high). Sustained break there should confirm long term bullish trend reversal. Next target is 61.8% retracement of 195.86 (2015 high) to 122.75 at 167.93. On the downside, sustained break of 149.03 support, however, will argue that rise from 123.94 has completed. Further break of 142.71 would open up the bearish case for retesting 122.75 low.
Positive Quarterly Company Reports Eventuall Kept Indices From Further Fall
The US stock market closed in the green zone yesterday due to the flow of corporate revenues of reporting companies, which led to the strengthening of the oil and gas, financial, and technology sectors, particularly the semiconductor industry. The S&P 500 index increased by 0.82%, the Dow Jones added 0.83%, and the Nasdaq jumped by 0.92%. Special attention was focused on the airline and cruise companies, which are steadily recovering. Today, investors' attention is directed to the ECB meeting, which will indirectly influence the dollar index, as well as to the weekly report on the number of initial jobless claims. Positive labor market data could provoke growth in the dollar index and a decrease in the main indices.
The European stock market closed with growth yesterday. British FTSE 100 increased by 1.7%, German DAX added 1.36%, French CAC 40 jumped by 1.85%. Europe's largest chipmaker ASML Holding increased its net profit in the second quarter and improved its yearly revenue forecast, which led to a 3.1% rise in its stock price. Shares of German automaker Daimler AG gained 1.1%. At the same time, there are problems with food supplies in the UK because of the labor shortage. Germany continues to struggle with the consequences of the floods. At the moment, about 40,000 people have no access to electricity and water in the stricken areas. Reconstruction after the floods will take several years. The estimated cost of future work is billions of euros. The heavy rains in western Europe have caused flooding not only in Germany but also in neighboring Belgium and the Netherlands.
Yesterday, the oil prices jumped despite an unexpected increase in the US oil inventories last week. The situation in the oil market remains uncertain. On the one hand, demand for fuel is rising sharply during the summer season. On the other hand, OPEC+ countries have started to increase oil production so that supply can catch up with demand. The rise of the Delta strain cases in Asia also influences oil prices. The introduction of new lockdowns could trigger a new wave of declines.
The situation in the market of precious metals did not change much compared to yesterday.
Asia-Pacific stock indices are also increasing following the rise of the US stock market for the second day in a row. Japanese stock exchanges are not trading on Thursday due to a holiday (Marine Day). Real estate operator Longfor Group Holdings (+5%), solar panel manufacturer Xinyi Solar Holdings (+4.8%), casino operator Galaxy Entertainment Group (+4.6%), online retailer Alibaba (+1.9%), Internet giant Tencent Holdings (+0.7%), consumer electronics manufacturer Xiaomi Corp. (+0.2%) became the growth leaders of the Stock Exchange of Hong Kong. At the same time, on Thursday, China rejected the World Health Organization's (WHO) plan for the second phase of investigation concerning the origin of the coronavirus, which includes the hypothesis that the virus came from a Chinese laboratory. In the meantime, the Delta strain cases are growing in Australia. The vaccination rates are low.
Main market quotes:
- S&P 500 (F) 4,358.69 +35.63 (+0.82%)
- Dow Jones 34,798.00 +286.01 (+0.83%)
- DAX 15,422.50 +206.23 (+1.36%)
- FTSE 100 6,998.28 +117.15 (+1.70%)
- USD Index 92.76 -0.21 (-0.23%)
Important events for today:
- Eurozone Deposit Facility Rate (m/m) at 14:45 (GMT+3);
- Eurozone ECB Marginal Lending Facility at 14:45 (GMT+3);
- Eurozone ECB Monetary Policy Statement at 14:45 (GMT+3);
- Eurozone ECB Interest Rate Decision at 14:45 (GMT+3);
- Eurozone ECB Press Conference at 15:30 (GMT+3);
- US Initial Jobless Claims (w/w) at 15:30 (GMT+3);
- Natural Gas Storage (w/w) at 17:30 (GMT+3).
EUR/USD Outlook: Bears Are Pausing Ahead Of ECB
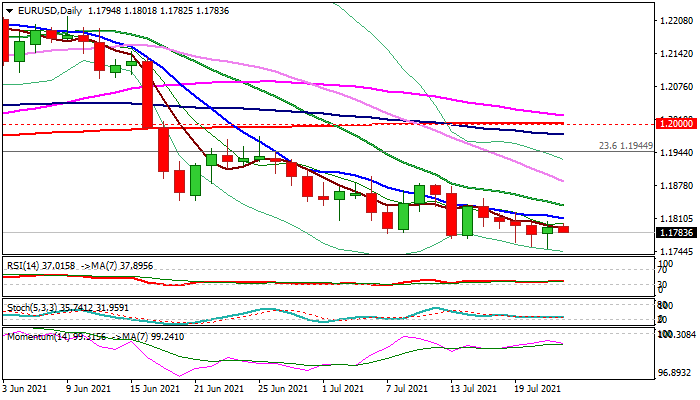
The EURUSD is moving within a narrow range around 1.1800 handle in early Thursday, awaiting signals from today’s ECB policy meeting.
The market expectations are mainly for dovish event that would add pressure to the single currency for attack at key supports at 1.1704/1.1694 (2021 low / Fibo 38.2% of 1.0635/1.2349 rally).
Long tails of daily candles of past three days signal that larger bears are facing headwinds, but remain firmly in play, as daily studies maintain negative momentum and moving averages remain in bearish setup.
Falling 10DMA (1.1811) and 20DMA (1.1838) track the downtrend from early June and mark solid resistances, with close above these indicators to sideline immediate downside risk.
Res: 1.1811, 1.1838, 1.1850, 1.1881.
Sup: 1.1751, 1.1737, 1.1704, 1.1694.
EUR/JPY Daily Outlook
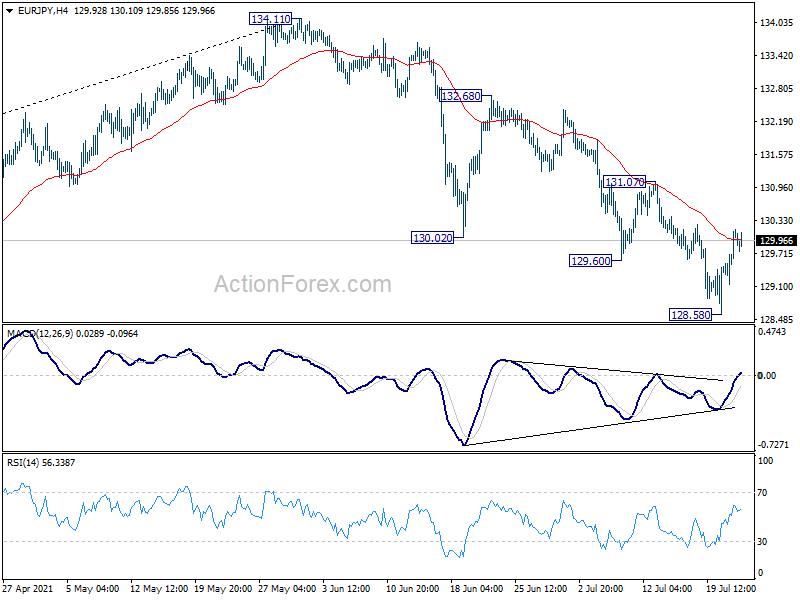
Daily Pivots: (S1) 129.44; (P) 129.81; (R1) 130.47; More....
Intraday bias in EUR/JPY remains neutral first and more consolidative trading could be seen. But further decline is expected as long as 131.07 resistance holds. Break of 128.58 will resume the fall from 134.11. Such decline is seen as correcting whole up trend from 114.42. Deeper fall would be seen to 127.07 resistance turned support next.
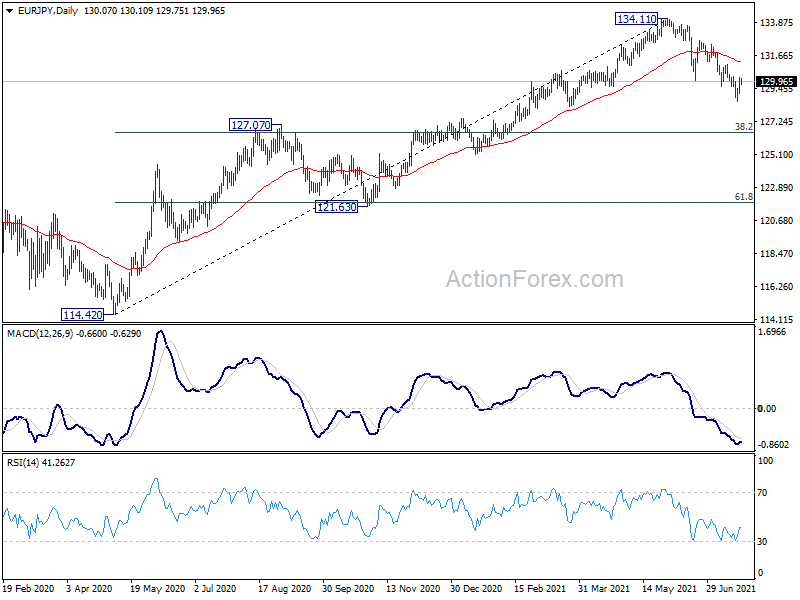
In the bigger picture, rise from 114.42 is seen as a medium term rising leg inside a long term sideway pattern. As long as 127.07 resistance turned support holds, further rise is still expected to retest 137.49 (2018 high) However, firm break of 127.07 will argue that the medium term trend has reversed, and open up the case for retesting 114.42.
Oil Surprises With Rally, Gold Dips
Oil stages a surprise rally
Official US crude inventories followed the API data from the day before and posted a surprise increase in stocks. However, instead of prices falling, oil rallied aggressively. Brent crude leapt 5.25% to USD 72.225 a barrel, and WTI rocketed 5.80% higher to USD 70.25 a barrel. Some long covering sees both contracts ease by 30 cents a barrel in another dull Asian session.
I must admit that the rally caught me completely flat-footed, especially its scale. Notably, there were no surprises within the distillate or gasoline indexes to support the jump in prices either. I can only surmise that with risk sentiment climbing in New York anyway elsewhere, that some gold old-fashioned FOMO fast-money drove the rally. Asian physical buyers who had been holding out for deeper bargains may also have needed to scramble in the overnight session.
Having said that, I have previously stated that I believed that any material sell-off would be short in duration. I didn’t realise it would be that material and that short in duration!
Unless we get another massive wave of delta-variant risk-off sentiment sweeping markets, the lows seen by oil this week are likely to be the lows seen for some time. The world remains on a recovery track, albeit asymmetrically, supporting oil’s consumption fundamentals for the rest of 2022.
Brent crude should find plenty of willing buyers now on any dips to USD 70.00 and USD 68.00 a barrel. Similarly, any retreat by WTI below USD 68.00 a barrel should find plenty of support. The upside remains less clear in the short-term, with resistance now at USD 74.00 and USD 72.00 a barrel, respectively.
Gold continues to fade
A rise in US long-dated bond yields weighed on gold prices overnight, as did a reduction in risk sentiment, with the delta fears of Monday continuing to ebb in North America overnight. Gold fell 0.40% to USD 1803.50 an ounce in a non-descript session and have edged lower to USD 1799.00 an ounce in Asia.
With Asian stock markets performing strongly today, it seems clear that regional investors are quickly rotating out of defensive gold positions and back into equities. That is weighing on gold prices, even if it is not yet enough to flip gold into a temporary bear market.
The yellow metal has taken a back seat this week, with volatility far higher in other asset classes. In the bigger picture, gold remains confined to a broader trading range bound by its 100 and 200-DMAs at USD 1790.00 and USD 1824.00 an ounce, respectively. A daily close above or below either of those levels is required to signal gold’s next directional move.