Sample Category Title
GBP/USD Daily Outlook
Daily Pivots: (S1) 1.3629; (P) 1.3676; (R1) 1.3761; More....
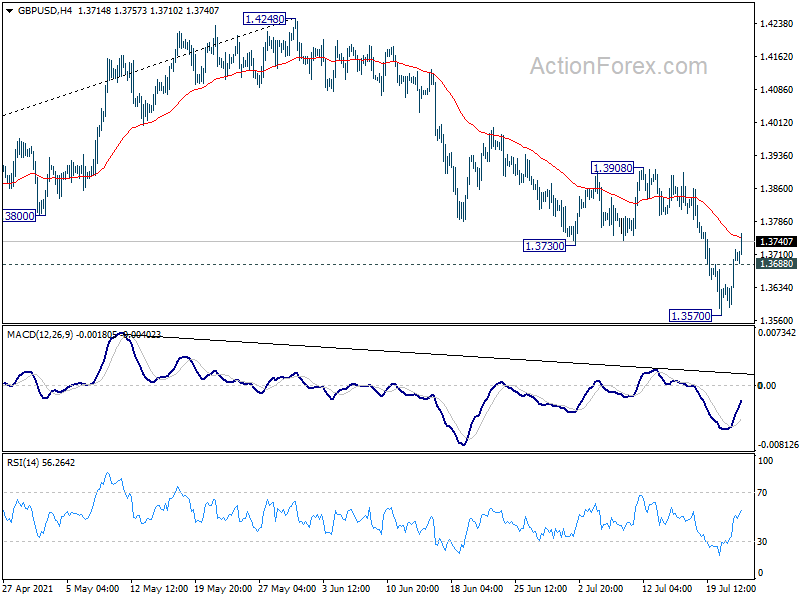
Intraday bias in GBP/USD is turned neutral first with current recovery. Some consolidations could be seen. But further decline will remain in favor as long as 1.3908 resistance holds. On the downside, break of 1.3570 will resume the fall from 1.4248 to 1.3482 resistance turned support first. Decisive break there will indicate that it's already correcting whole up trend from 1.1409. Next target will then be 38.2% retracement of 1.1409 to 1.4248 at 1.3164.
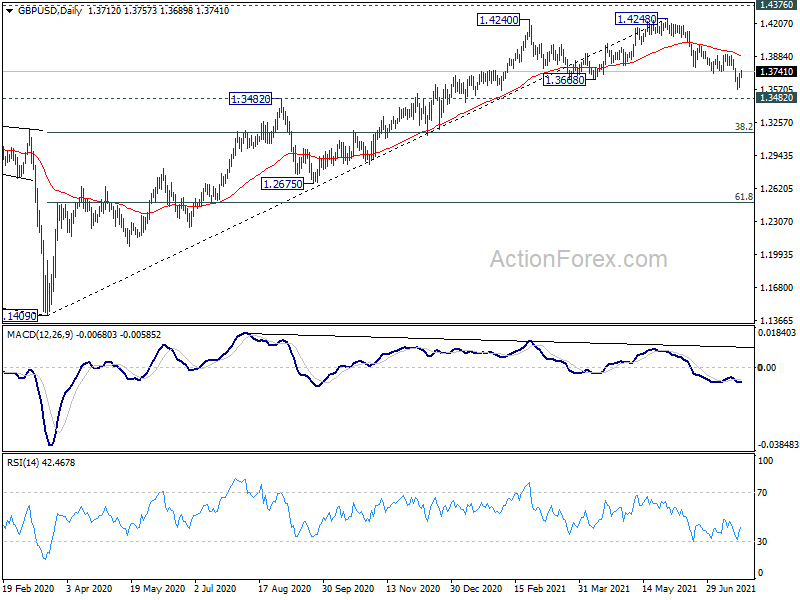
In the bigger picture, as long as 1.3482 resistance turned support holds, up trend from 1.1409 should still continue. Decisive break of 1.4376 resistance will carry larger bullish implications. However, firm break of 1.3482 support will argue that the rise from 1.1409 has completed. GBP/USD would then be seen in another leg of long term range pattern between 1.1409 and 1.4376. Deeper fall could then be seen to 61.8% retracement of 1.1409 to 1.4248 at 1.2493, and even below.
EUR/USD Daily Outlook
Daily Pivots: (S1) 1.1762; (P) 1.1784; (R1) 1.1815; More...
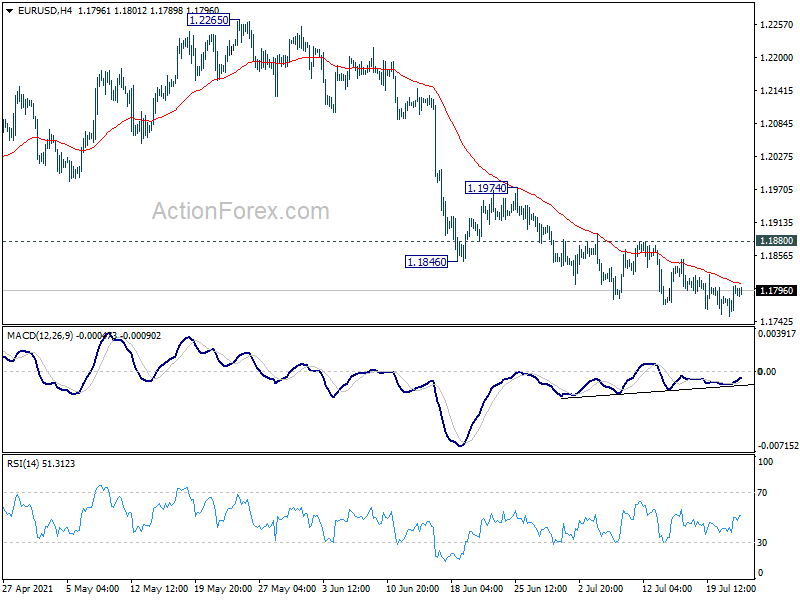
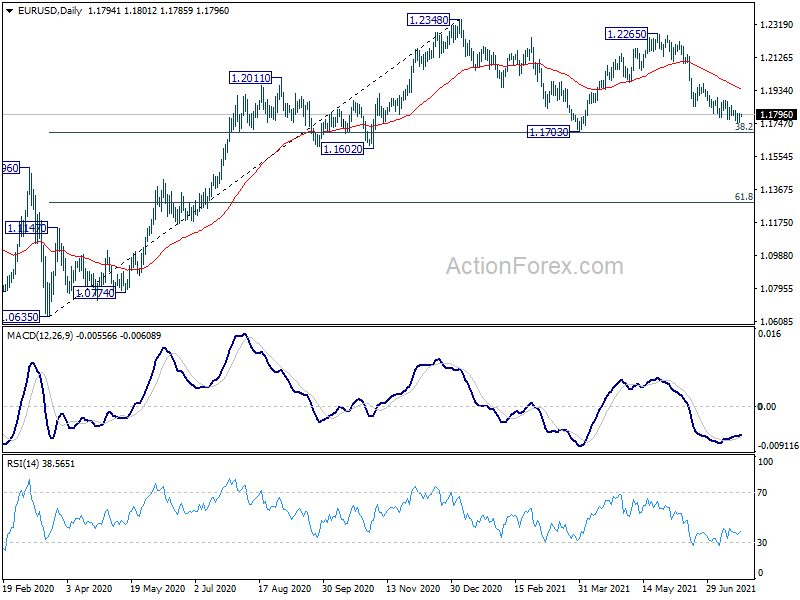
EUR/USD continues to lose downside momentum as seen in 4 hour MACD. But further decline is expected as long as 1.1880 resistance holds. Decline from 1.2265, as the third leg of correction from 1.2348, would target 1.1703 support. On the upside, though, break of 1.1880 will indicate short term bottoming and turn bias back to the upside for stronger rebound to 1.1974 resistance first.
In the bigger picture, rise from 1.0635 is seen as the third leg of the pattern from 1.0339 (2017 low). Further rally could be seen to cluster resistance at 1.2555 next, (38.2% retracement of 1.6039 to 1.0339 at 1.2516). This will remain the favored case as long as 1.1602 support holds. Reaction from 1.2555 should reveal underlying long term momentum in the pair. However sustained break of 1.1602 will argue that the rise from 1.0635 is over, and turn medium term outlook bearish again.
AUD/USD Daily Report
Daily Pivots: (S1) 0.7311; (P) 0.7337; (R1) 0.7384; More...
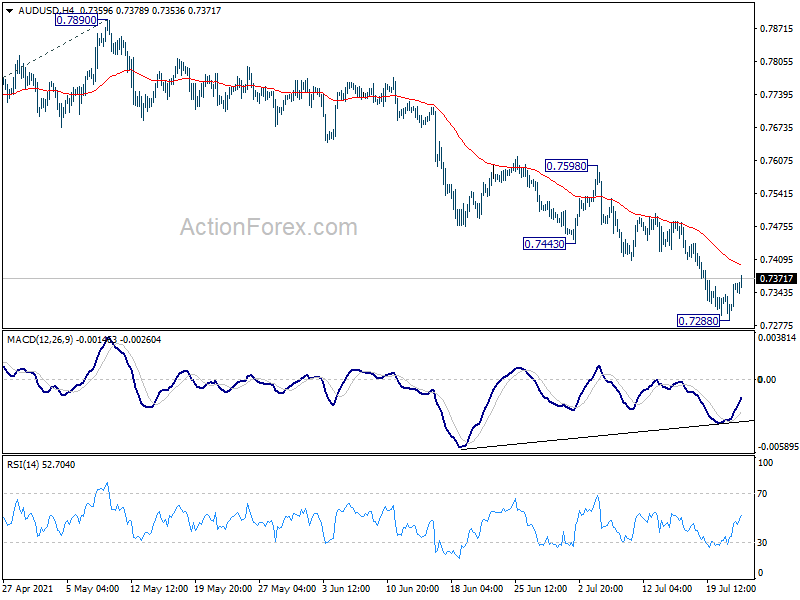
Intraday bias in AUD/USD is turned neutral with current recovery. Some consolidations could be seen but outlook will remain bearish as long as 0.7443 support turned resistance holds. On the downside, break of 0.7288 will resume larger fall from 0.8006, and target 161.8% projection of 0.8006 to 0.7530 from 0.7890 at 0.7120. However, break of 0.7443 will bring stronger rebound to 0.7530 support turned resistance.
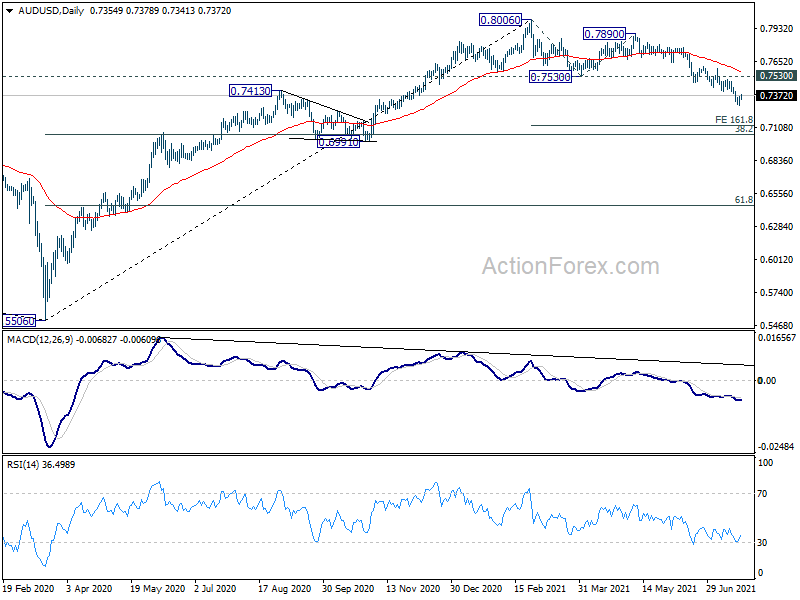
In the bigger picture, rise from 0.5506 medium term bottom could have completed at 0.8006, after failing 0.8135 key resistance. Correction from there could target 0.6991 cluster support (38.2% retracement of 0.5506 to 0.8006 at 0.7051). We'd look for strong support from there to bring rebound. However, sustained break of this level would argue that the whole medium term has indeed reversed.
WTI Oil Futures Power Up To 70 But Some Caution Remains
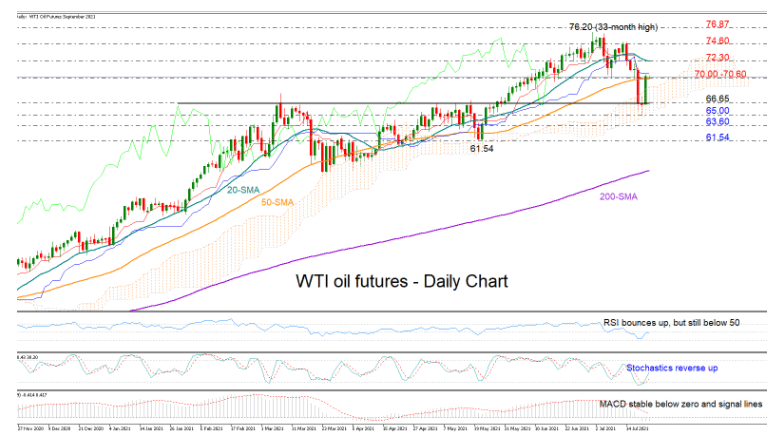
WTI oil futures (September delivery) bounced forcefully near the critical resistance-turned-support zone of 66.65 late on Wednesday, quickly recouping most of Monday’s losses to trade back above the 70.00 level.
The sprint saved the marked from an outlook deterioration in the medium-term picture, but in the short-term window, the price is still structurally in a bearish corrective mode below the 76.20 peak.
As regards the price momentum, although the upside reversal in the Stochastics is promoting further recovery in the market, some negative risks continue to linger in the background as the RSI has yet to pierce above its 50 neutral mark despite the latest sharp upturn in the price. The MACD could not strengthen above its zero and signal lines either, suggesting that bearish interest is still intact.
The 50-day simple moving average (SMA) and the blue Kijun-sen line are currently capping upside movements within the 70.00 - 70.60 area. Hence, once they give way, the door would open for the 72.00 mark and the 20-day SMA slightly higher. Additional gains from here may test the 74.60 resistance territory before stretching towards the 76.20 peak and the 2018 top of 76.87.
If selling pressures return, the bears may attempt to breach the 66.65 floor and drive towards the bottom of the Ichimoku cloud seen at 65.00. A step lower could feed a sharper decline towards 63.60, while below that, the focus will shift to May’s low of 61.54.
In brief, WTI oil futures remain exposed to negative corrections despite Wednesday’s rally. A sustainable move above 70.00 could encourage more buying, while a drop below 66.65 may activate fresh selling orders.
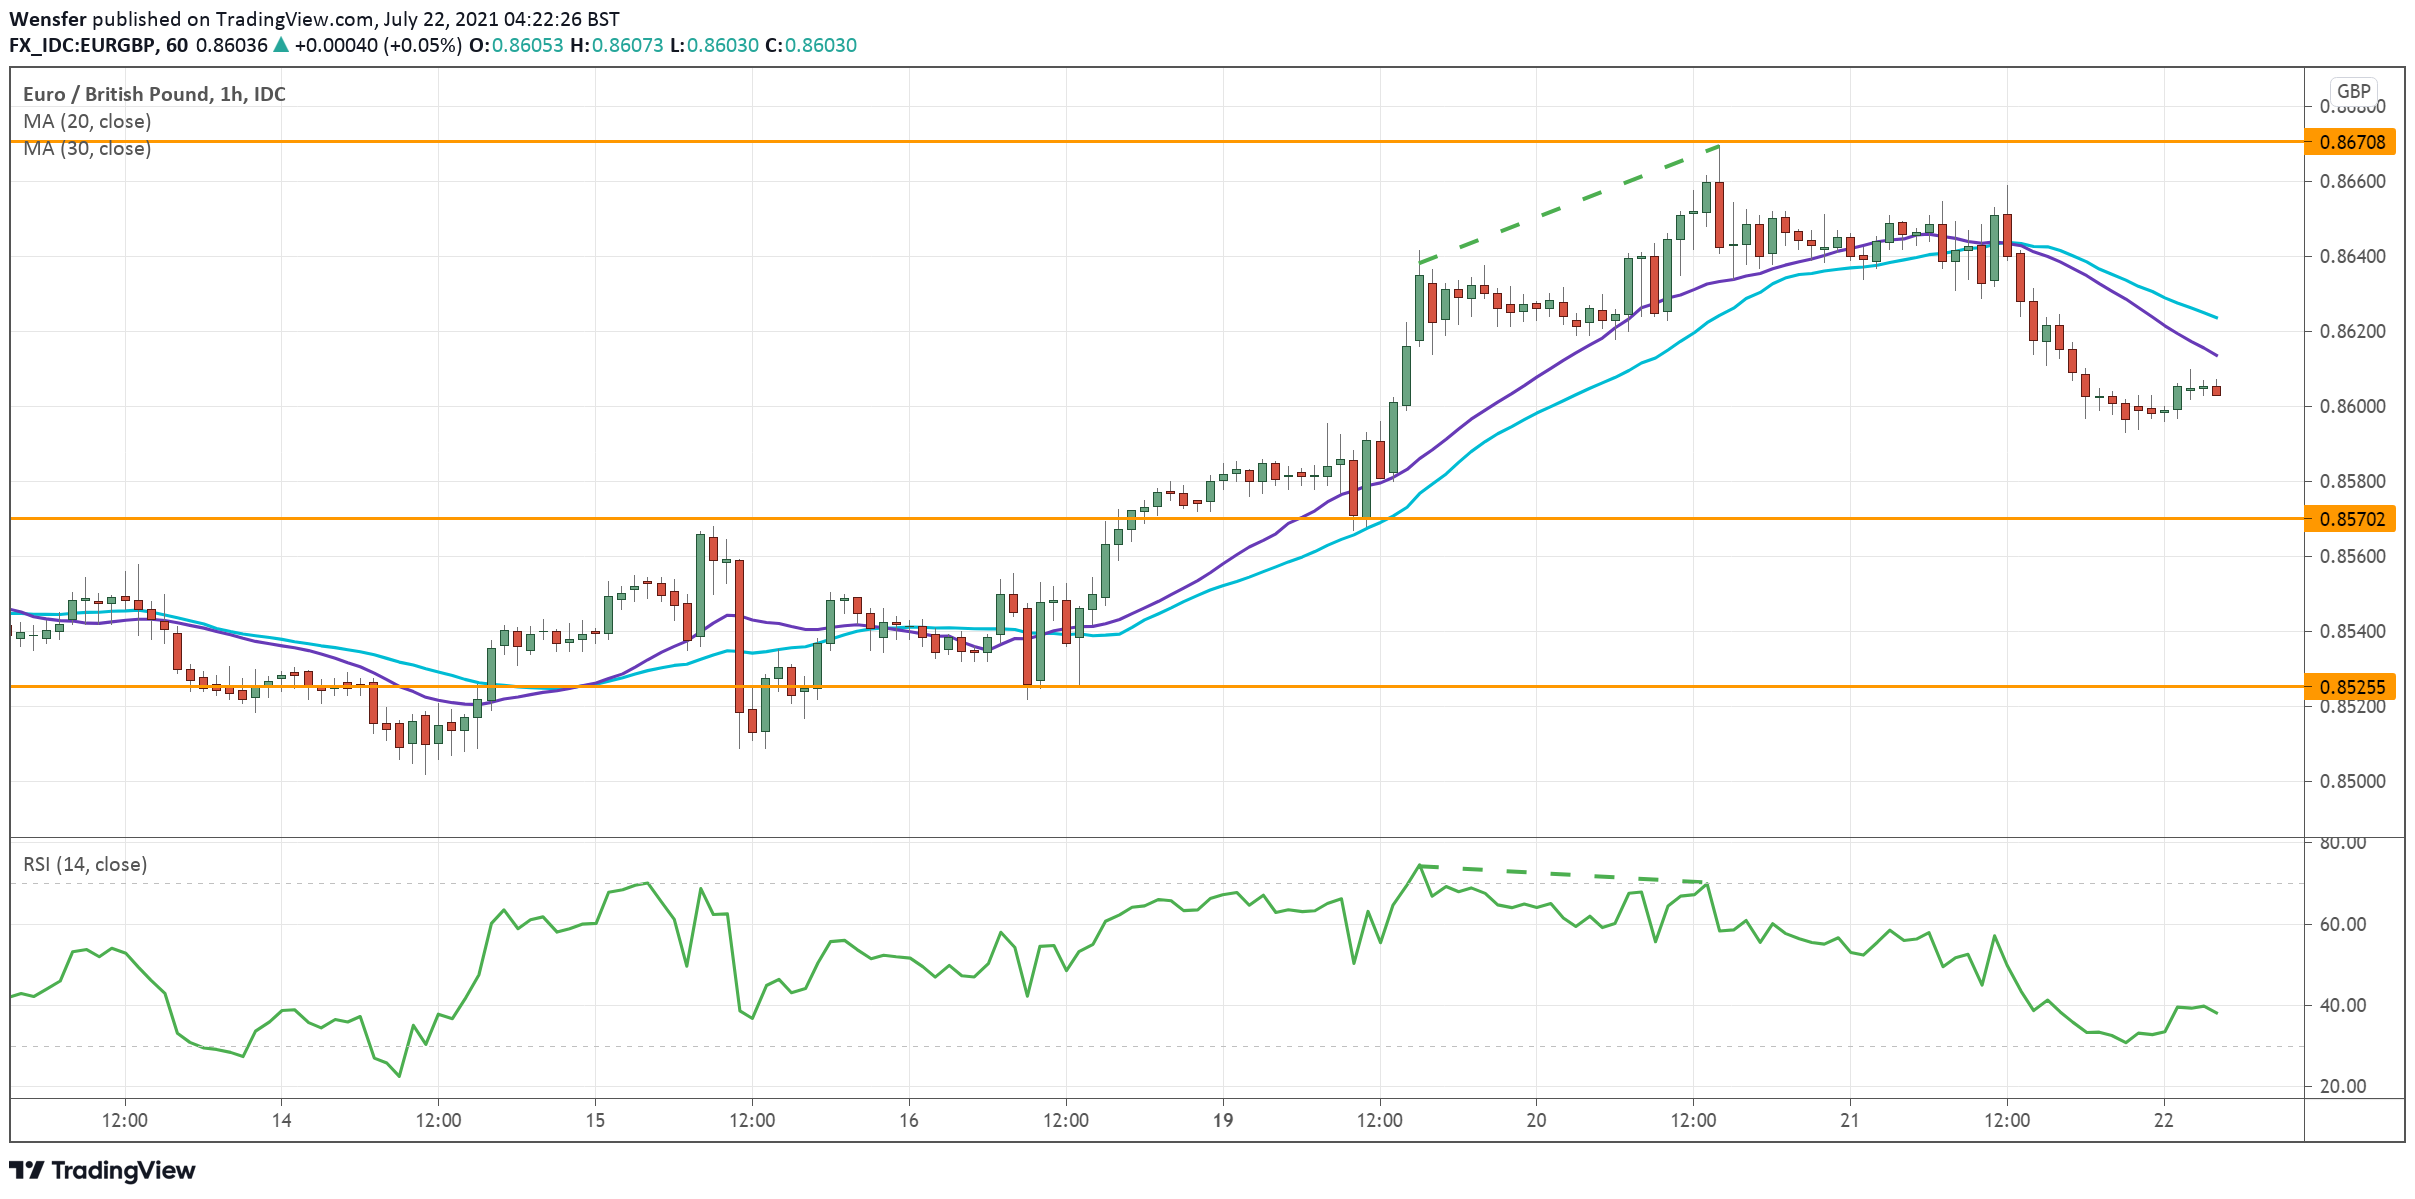
EUR/GBP Attempts Bullish Reversal
The pound tumbles as the UK’s reopening hangs on a thread after a spike in the so-called ‘pingdemic’.
The euro has successfully bounced off 0.8500, a key support from April’s rally on the daily chart. The rally above the resistance at 0.8610 indicates that buyers may have regained control of the direction.
The pair saw some selling pressure near 0.8670 as an RSI divergence was showing signs of exhaustion. A temporary pullback is necessary to let the bulls catch their breath.
0.8570 would be the key support to monitor.
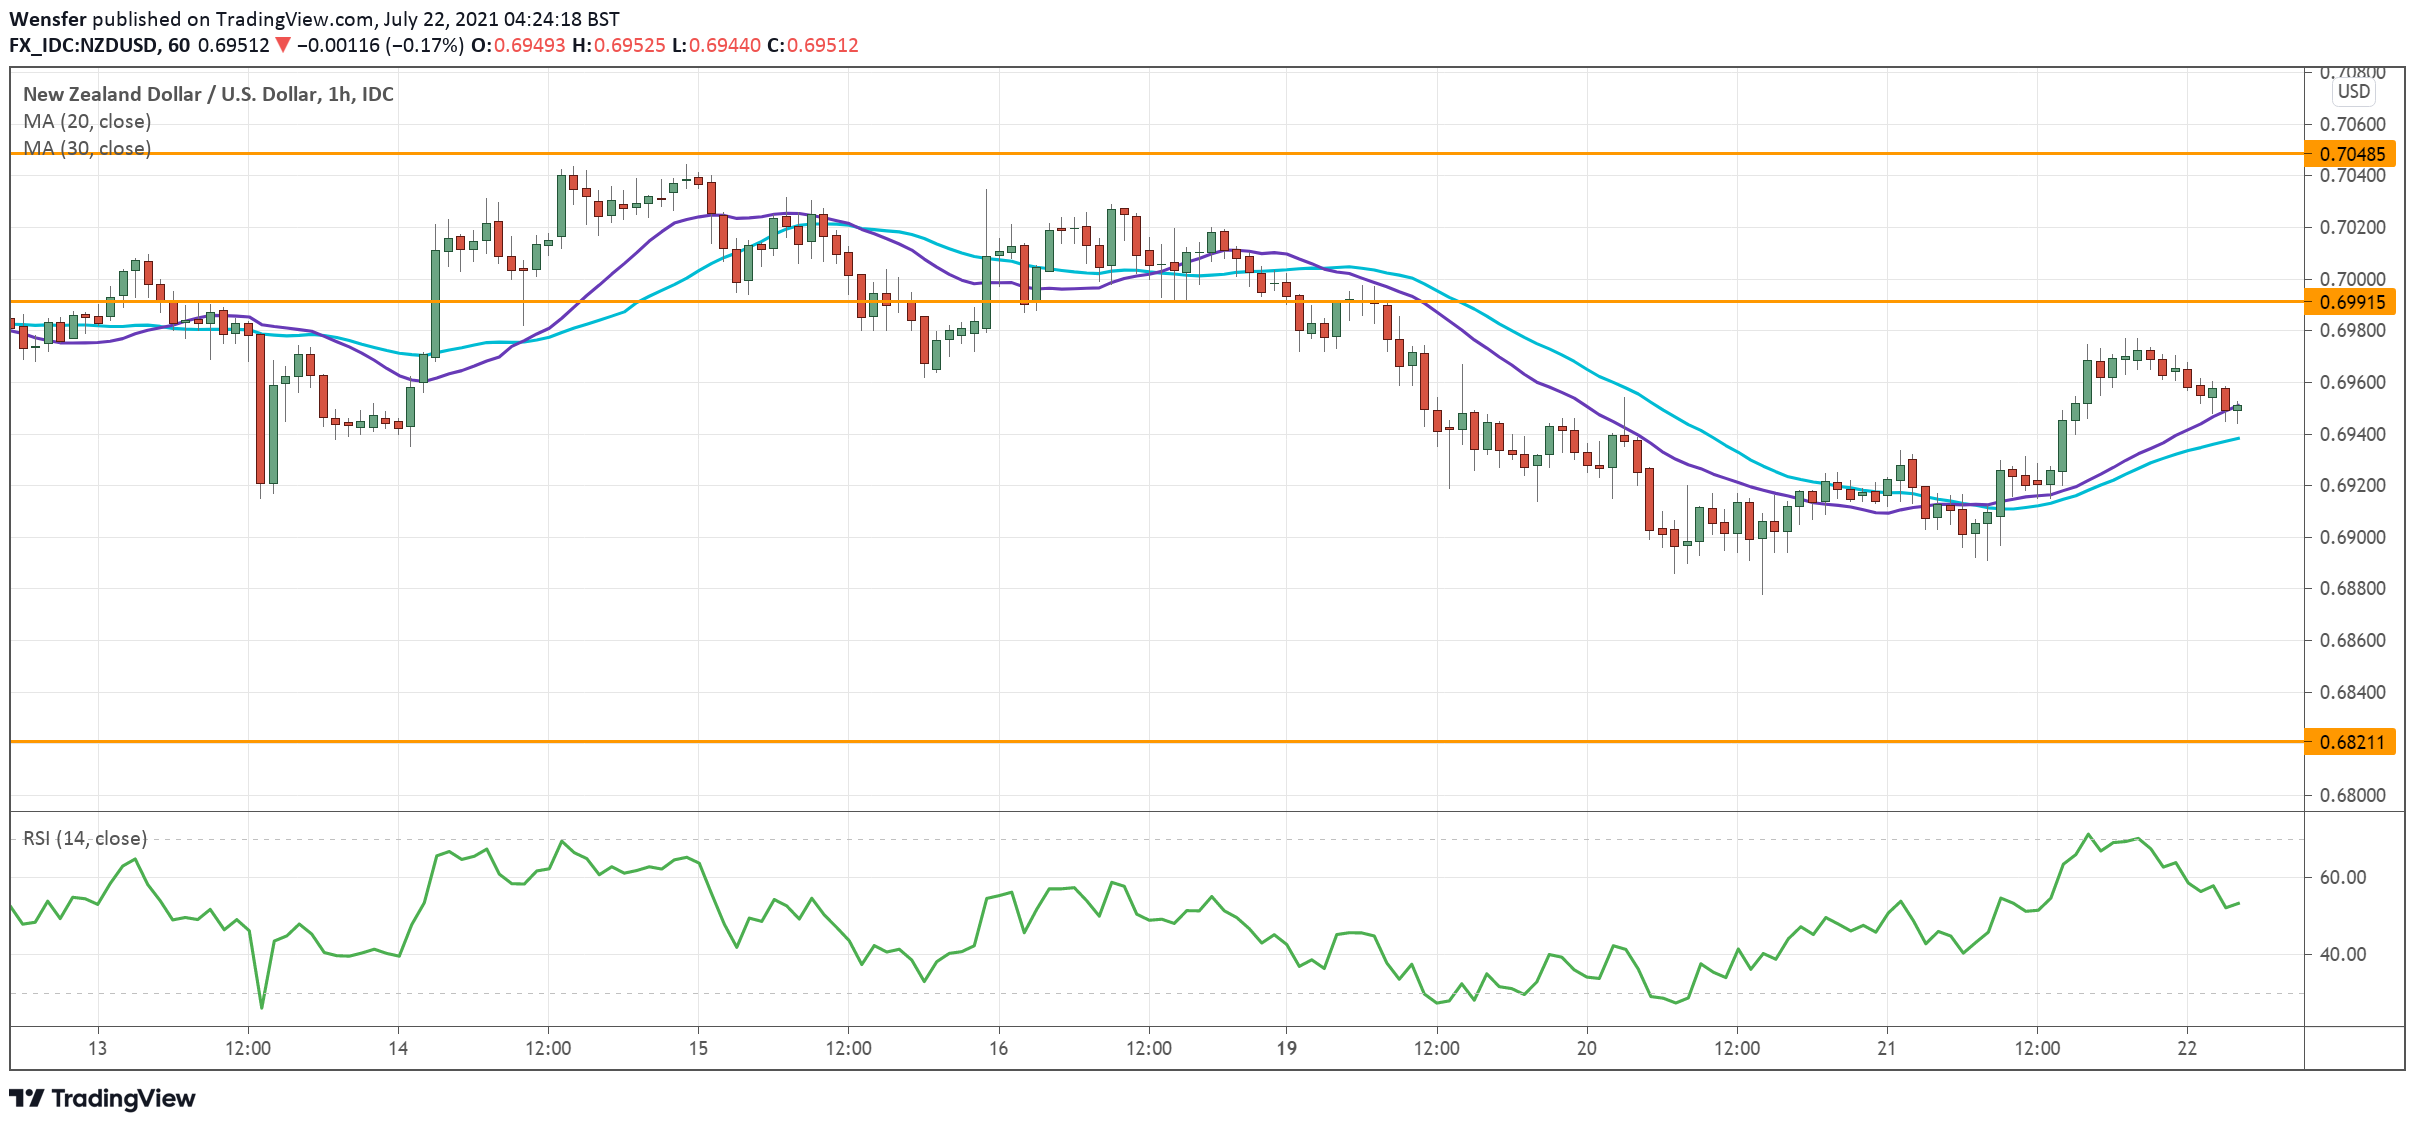
NZD/USD Falls Through Daily Support
The New Zealand dollar falls as global growth concerns may delay RBNZ’s rate hike schedule.
The breakout below the critical daily support at 0.6920 reveals a lack of buying interest. Those who bought the dip have bailed out as the rebound failed to gain traction.
Bearish sentiment may push the pair towards 0.6820 once momentum comes back.
In the meantime, the RSI has recovered to the neutrality area. A limited bounce may lift the price to the key resistance at 0.6990 where sellers would be waiting to jump in.
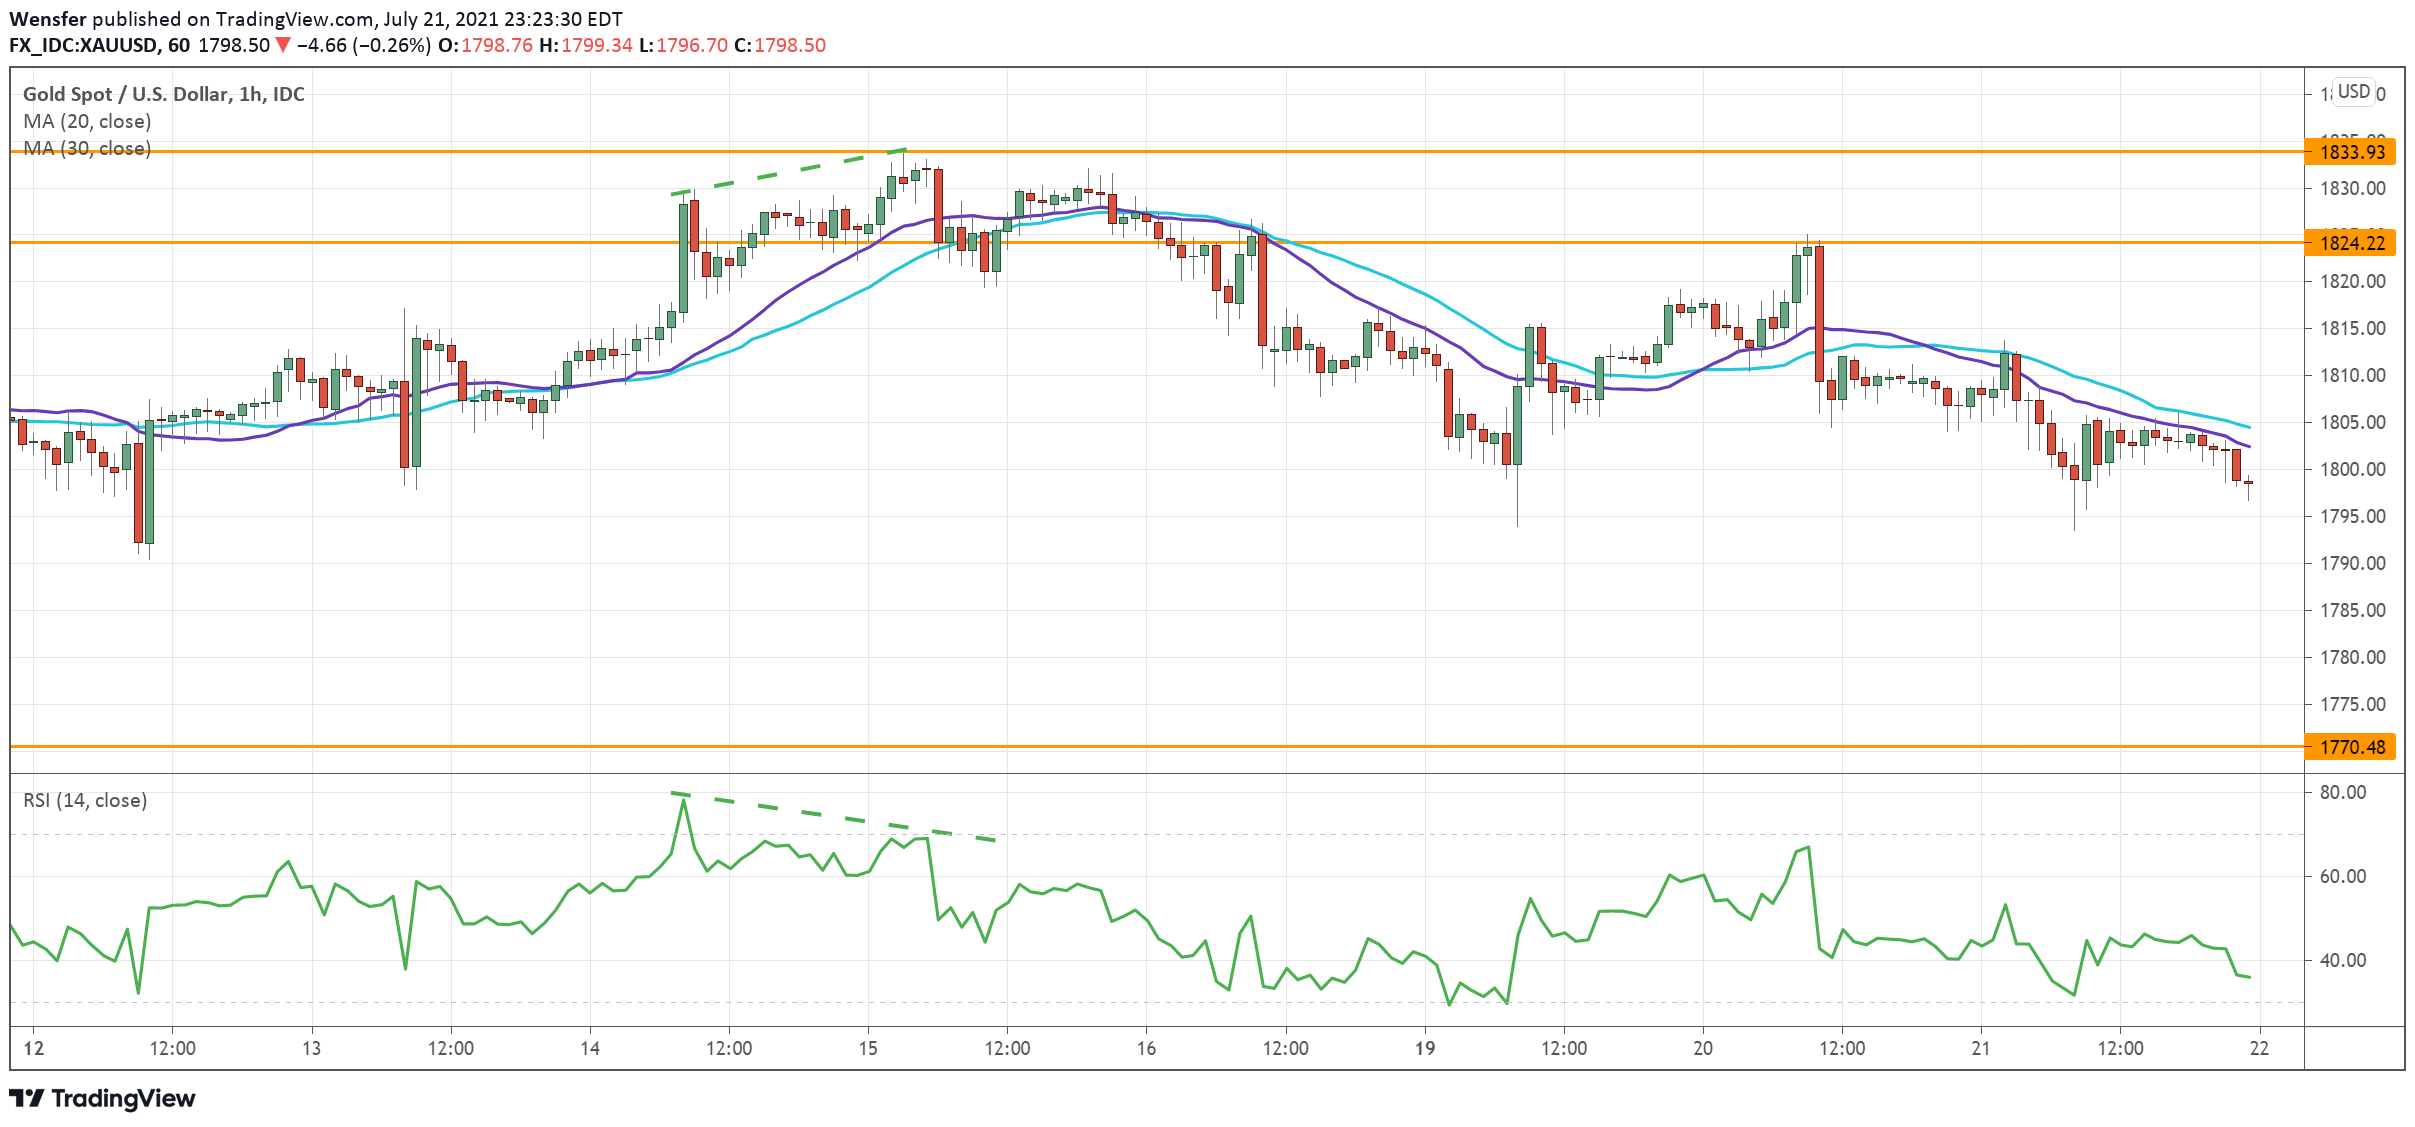
XAU/USD Dips From Supply Area
Gold struggles to hold onto its gains as the US dollar pushes towards fresh year-to-date highs.
The recovery has met stiff selling pressure near 1830, a supply zone from last June’s sell-off. The RSI divergence was a sign that the rally was losing steam. The subsequent break below 1805 came in as a confirmation that the bears were still around.
Below the psychological level of 1800 gold would be vulnerable to a new round of sell-off with 1770 as the target. 1824 is the resistance to break before a rebound could materialize.
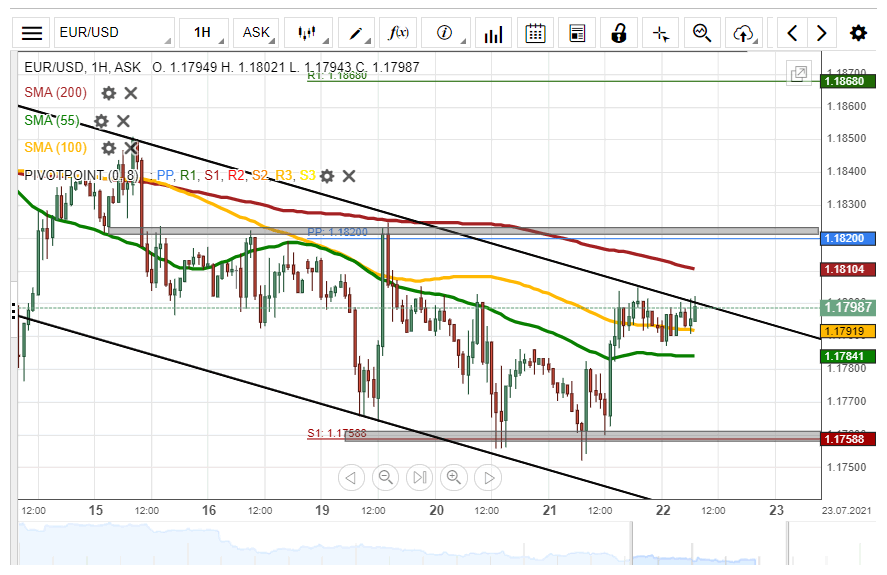
EUR/USD Might Break Channel Pattern
The common European currency rose by 40 pips or 0.34% against the US Dollar on Wednesday. The currency pair breached the 55– and 100– hour SMAs during Wednesday's trading session.
The EUR/USD exchange rate is currently trading near the upper line of a descending channel pattern and could be set for a breakout.
If the breakout occurs, a surge towards the 1.1840 area could be expected within this session.
However, if the channel pattern holds, bears could continue to drive the currency exchange rate lower during Thursday's trading session.
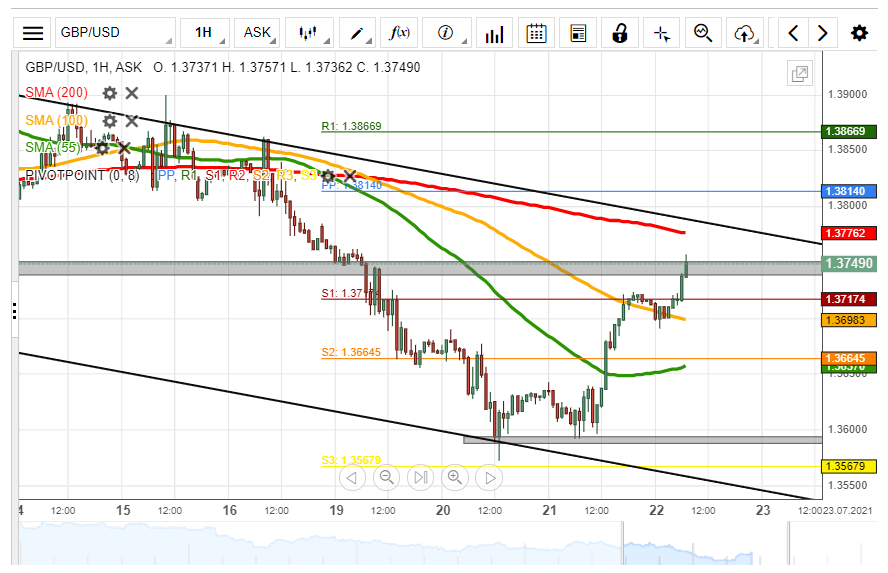
GBP/USD Bounces Off Support
The GBP/USD currency pair bounced off a support level near the 1.3600 zone on Monday. As a result, the British Pound edged higher by 130 pips or 0.95% against the US Dollar.
Everything being equal, the exchange rate could continue to surge during the following trading session. The possible target for bullish traders would be near the 1.3850 level.
However, the 200– hour simple moving average at 1.3780 could provide resistance for the currency exchange rate within this session.
USD/JPY Breakout Occurs
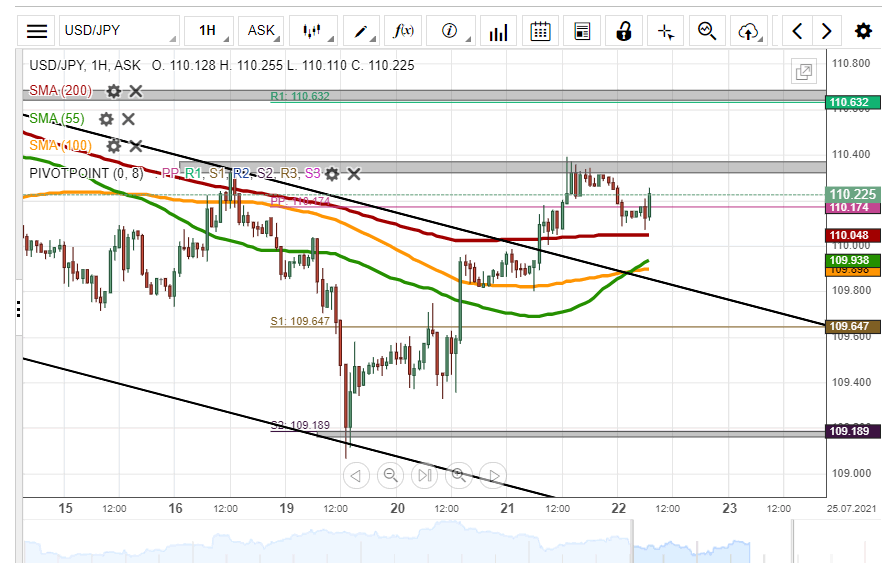
The US Dollar surged by 50 pips or 0.46% against the Japanese Yen on Wednesday. A breakout occurred through the upper boundary of a descending channel pattern during Wednesday's trading session.
Given that a breakout has occurred, buyers could continue to drive the currency pair higher during the following trading session. The potential target for bullish traders would be near the weekly R1 at 110.63.
However, the USD/JPY currency exchange rate could found resistance near the 110.40 regions in the shorter term.