Sample Category Title
Euro Looks Forward to ECB, Canadian Dollar Rebounds With Oil Price
Dollar and Yen lost their position as the strongest ones as US stocks staged another day of massive rebound overnight, together with treasury yields. On the other hand, Canadian Dollar is currently the best performer for the week, helped by WTI crude oil's reclaim of 70 handle. But Aussie and Kiwi remain the weakest at this point. Euro is mixed, as markets await ECB's new forward guidance and press conference.
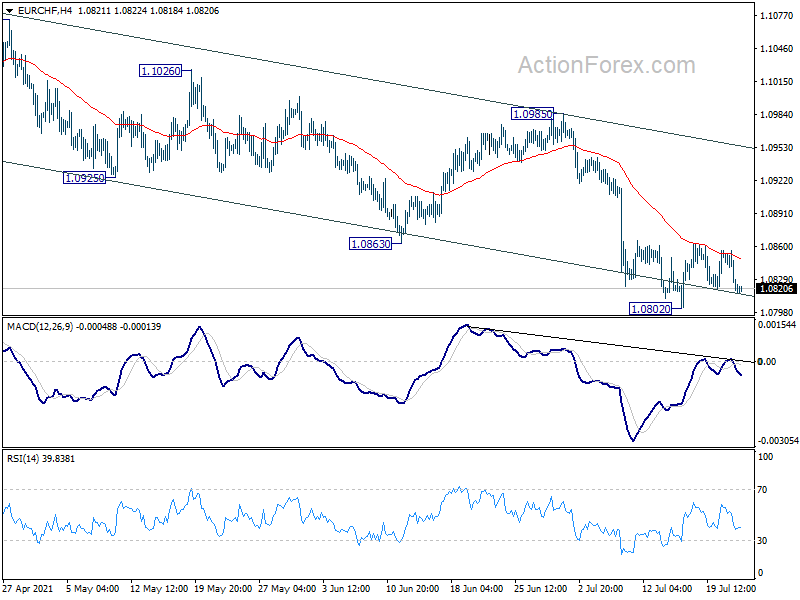
Technically, we'd pay some attention to EUR/CHF to guide the assessment on Euro's next move. It was rejected twice by 4 hour 55 EMA, affirming near term bearishness. Break of 1.0802 temporary low will resume larger fall from 1.1149 towards 1.0737 support. That could also drag EUR/USD down in spite of its own weak downside momentum.
In Asia, Japan is on holiday. Hong Kong HSI is up 1.76% at the time of writing. China Shanghai SSE is up 0.25%. Singapore Strait Times is up 1.40%. Overnight, DOW rose 0.83%. S&P 500 rose 0.82%. NASDAQ rose 0.92%. 10-year yield rose 0.071 to 1.280.
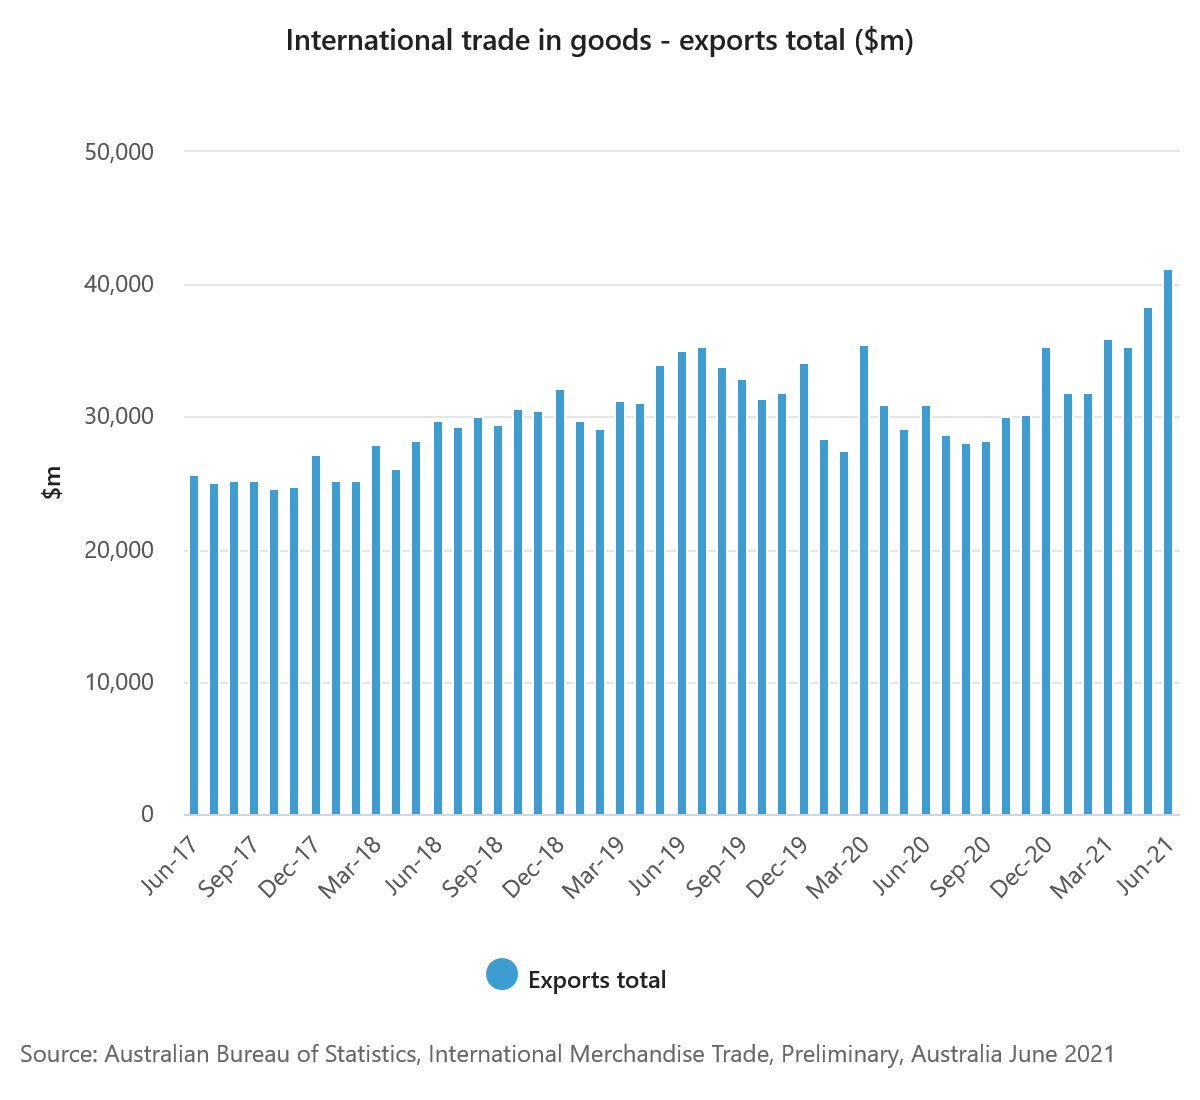
Australia goods exports rose to record 41.3B in Jun
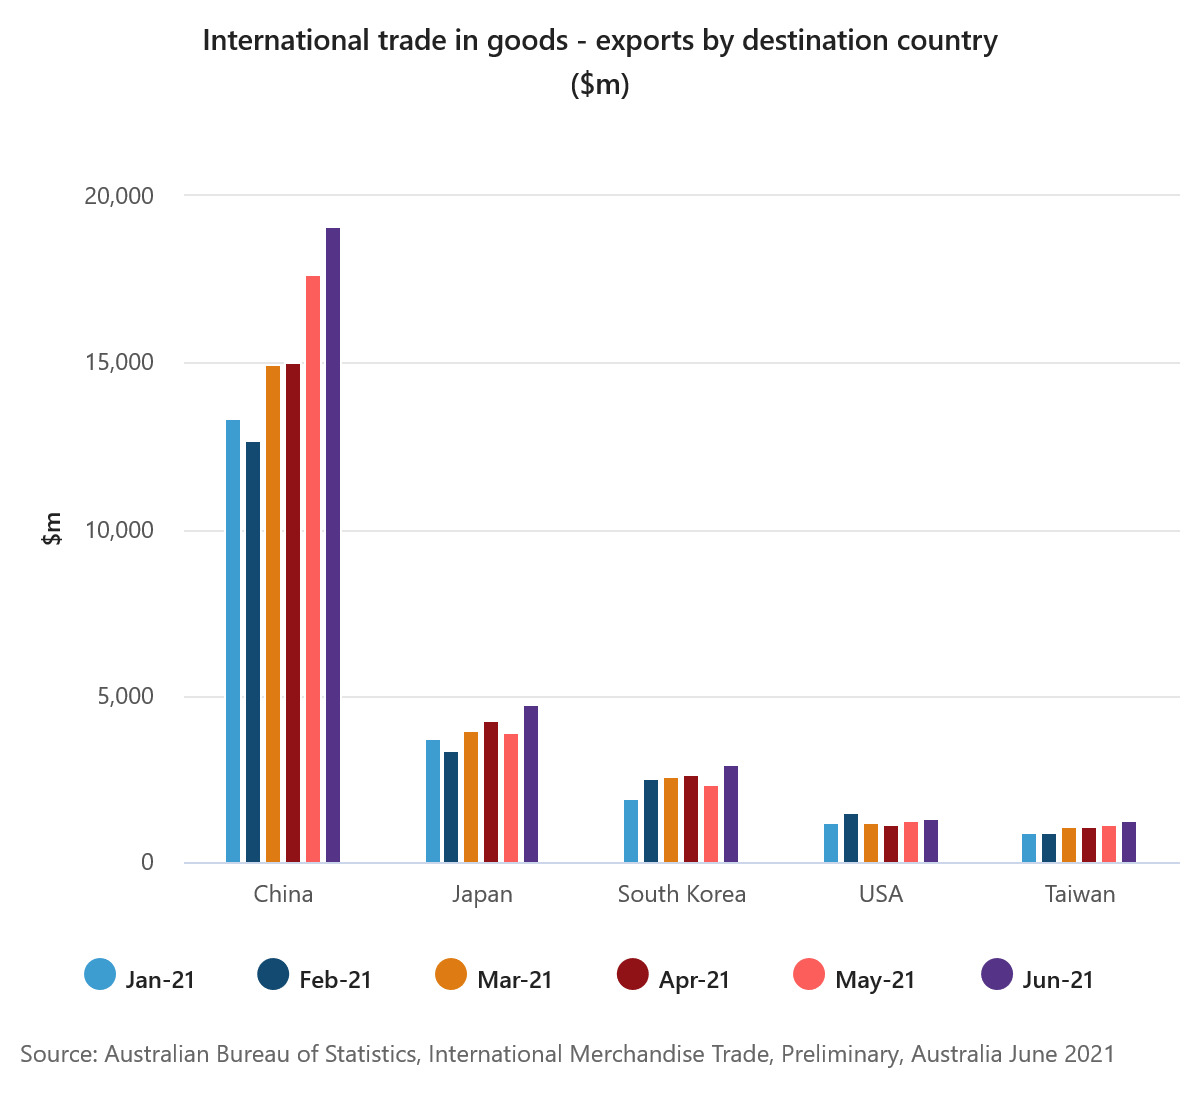
Australia exports of goods rose 8% mom or AUD 2.9B to AUD 41.3B in June. Imports of goods rose 7% mom or AUD 2.1B to AUD 28.0B. Goods trade surplus widened to record AUD 13.3B, up slightly from AUD 12.5B. Exports to top five destinations rose, including China (8%), Japan (21%), South Korea (24%), Taiwan (9%), USA (7%).
Head of International Statistics at the ABS Andrew Tomadini said: "June 2021 recorded a monthly export value above $40 billion. Exports increased 8 per cent to $41.3 billion, with significant increases in metalliferous ores, coal, non-monetary gold, and gas".
Australia NAB business confidence dropped to 17 in Q2, but condition rose sharply to 32
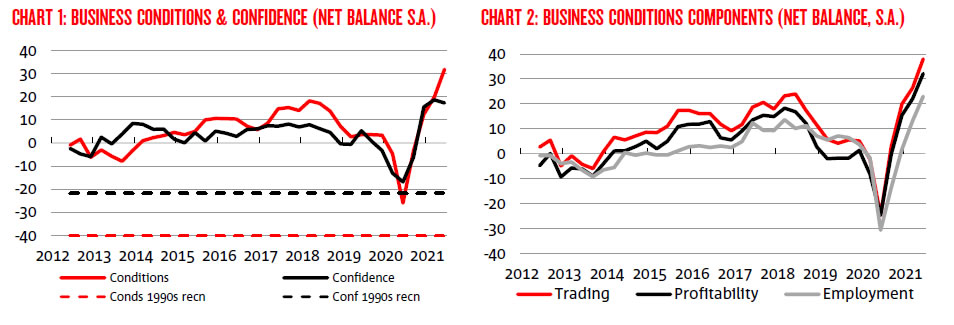
Australia NAB business confidence dropped from 19 to 17 in Q2. Current business condition rose from 20 to 32. Business conditions for the next 3 months rose from 28 to 36. Business conditions for the next 12 months rose from 31 to 33. Capex plans for the next 12 months rose from 34 to 37.
Looking at some more details, trading conditions rose from 26 to 38. Profitability rose from 22 to 32. Employment rose from 13 to 23. Forward orders rose from 14 to 23. Stocks rose from 5 to 11. Exports also improved from -1 to 0.
According to Alan Oster, NAB Group Chief Economist "Business conditions were still in negative territory in Q3 2020, and now, three quarters later, they were at a record high, a testament to how rapid the recovery has been from last year's recession".
"A pleasing aspect of the survey is how broad-based the strength in conditions and confidence was – whether you look by industry or by state they are all above average, and in many cases well above."
EUR/USD lost downside momentum as new ECB forward guidance awaited
ECB policy decision and press conference are the main focuses for today, even though no policy change is expected. After the conclusion of the strategic review on July 8, officials are clear that they're going to adjust the forward guidance to align with the new symmetric 2% inflation target, which allows a temporary overshoot. Overall reactions could, however, be rather muted.
Here are some previews:
- ECB Preview: New Forward Guidance to Reflect New Inflation Target
- ECB Preview: Lagarde To Be Dovish As She Drives Home Strategic Review
- ECB Meeting: Locking in Negative Rates for Longer
- ECB Preview – Aligning Forward Guidance to Strategic Review Outcome
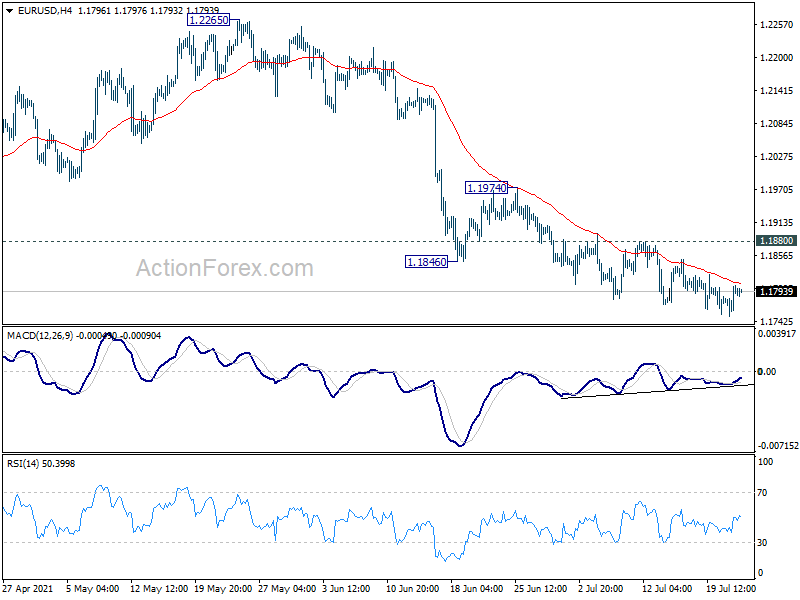
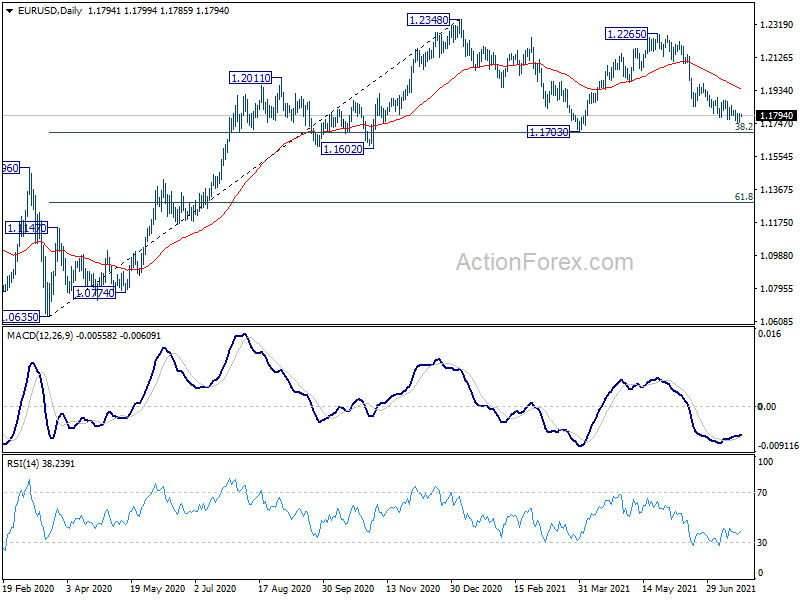
Euro is currently rather mixed in general. EUR/USD is clearly losing downside momentum as seen in 4 hour MACD. But current fall from 1.2265, as the third leg of the pattern from 1.2348, could still extend towards 1.1703 support and even below. Nevertheless, break of 1.1880 resistance would be a sign of near term reversal and bring stronger rebound through 1.1974 resistance.
Elsewhere
US will release jobless claims and existing home sales. Eurozone will release consumer confidence.
USD/CAD Daily Outlook
Daily Pivots: (S1) 1.2481; (P) 1.2606; (R1) 1.2685; More...
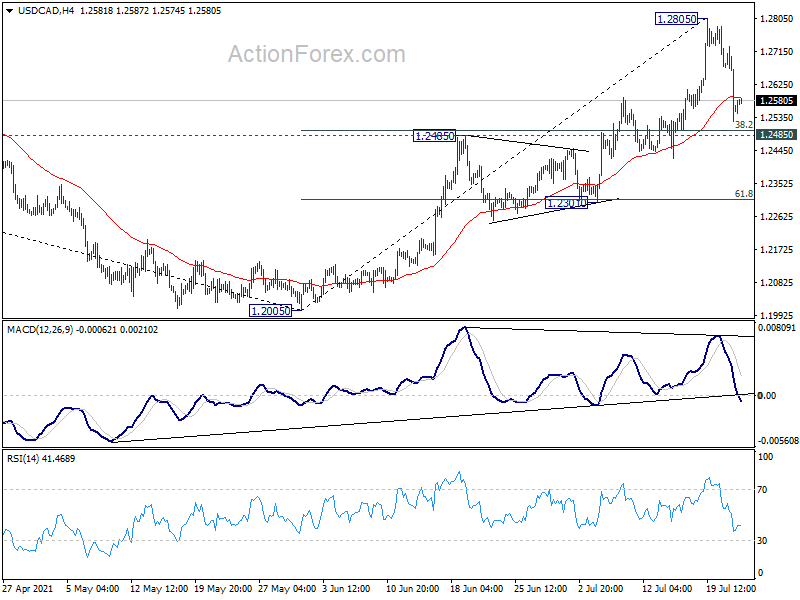
USD/CAD's pull back from 1.2805 extends lower but stays above 1.2485 resistance turned support. Intraday bias remains neutral first. Further rise is still in favor. Break of 1.2805 will extend the rise from 1.2005 to 1.3022 medium term fibonacci level next. On the downside, however, break of 1.2485 will bring deeper fall back to next cluster support at 1.2301 (61.8% retracement of 1.2005 to 1.2805 at 1.2311).
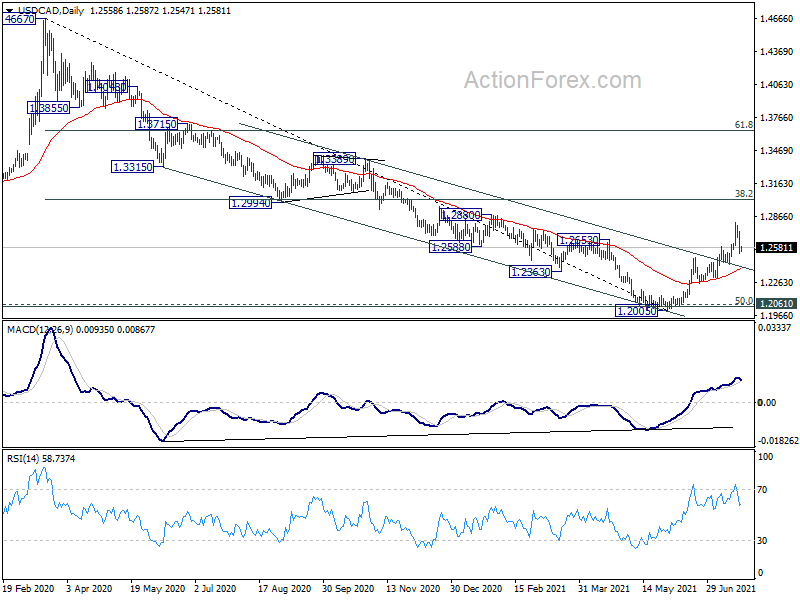
In the bigger picture, fall from 1.4667 is seen as the third leg of the corrective pattern from 1.4689 (2016 high). It should have completed after hitting 1.2061 (2017 low) and 50% retracement of 0.9406 to 1.4689 at 1.2048. Sustained break of 38.2% retracement of 1.4667 to 1.2005 at 1.3022 will pave the way to 61.8% retracement at 1.3650 and above. Overall, medium term outlook remains neutral at worst with 1.2048/61 support zone intact.
Economic Indicators Update
| GMT | Ccy | Events | Actual | Forecast | Previous | Revised |
|---|---|---|---|---|---|---|
| 1:30 | AUD | NAB Business Confidence Q2 | 17 | 17 | 19 | |
| 11:45 | EUR | Eurozone ECB Interest Rate Decision | 0.00% | 0.00% | ||
| 12:30 | EUR | ECB Press Conference | ||||
| 12:30 | USD | Initial Jobless Claims (Jul 16) | 350K | 360K | ||
| 14:00 | USD | Existing Home Sales Jun | 5.95M | 5.80M | ||
| 14:00 | EUR | Eurozone Consumer Confidence Jul P | -3 | -3 | ||
| 14:30 | USD | Natural Gas Storage | 55B |
EUR/USD lost downside momentum as new ECB forward guidance awaited
ECB policy decision and press conference are the main focuses for today, even though no policy change is expected. After the conclusion of the strategic review on July 8, officials are clear that they're going to adjust the forward guidance to align with the new symmetric 2% inflation target, which allows a temporary overshoot. Overall reactions could, however, be rather muted.
Here are some previews:
- ECB Preview: New Forward Guidance to Reflect New Inflation Target
- ECB Preview: Lagarde To Be Dovish As She Drives Home Strategic Review
- ECB Meeting: Locking in Negative Rates for Longer
- ECB Preview – Aligning Forward Guidance to Strategic Review Outcome
Euro is currently rather mixed in general. EUR/USD is clearly losing downside momentum as seen in 4 hour MACD. But current fall from 1.2265, as the third leg of the pattern from 1.2348, could still extend towards 1.1703 support and even below. Nevertheless, break of 1.1880 resistance would be a sign of near term reversal and bring stronger rebound through 1.1974 resistance.
Australia goods exports rose to record 41.3B in Jun
Australia exports of goods rose 8% mom or AUD 2.9B to AUD 41.3B in June. Imports of goods rose 7% mom or AUD 2.1B to AUD 28.0B. Goods trade surplus widened to record AUD 13.3B, up slightly from AUD 12.5B. Exports to top five destinations rose, including China (8%), Japan (21%), South Korea (24%), Taiwan (9%), USA (7%).
Head of International Statistics at the ABS Andrew Tomadini said: "June 2021 recorded a monthly export value above $40 billion. Exports increased 8 per cent to $41.3 billion, with significant increases in metalliferous ores, coal, non-monetary gold, and gas".
Australia NAB business confidence dropped to 17 in Q2, but condition rose sharply to 32
Australia NAB business confidence dropped from 19 to 17 in Q2. Current business condition rose from 20 to 32. Business conditions for the next 3 months rose from 28 to 36. Business conditions for the next 12 months rose from 31 to 33. Capex plans for the next 12 months rose from 34 to 37.
Looking at some more details, trading conditions rose from 26 to 38. Profitability rose from 22 to 32. Employment rose from 13 to 23. Forward orders rose from 14 to 23. Stocks rose from 5 to 11. Exports also improved from -1 to 0.
According to Alan Oster, NAB Group Chief Economist "Business conditions were still in negative territory in Q3 2020, and now, three quarters later, they were at a record high, a testament to how rapid the recovery has been from last year's recession".
"A pleasing aspect of the survey is how broad-based the strength in conditions and confidence was – whether you look by industry or by state they are all above average, and in many cases well above."
Elliott Wave View: NZDUSD Shows Incomplete Bearish Sequence
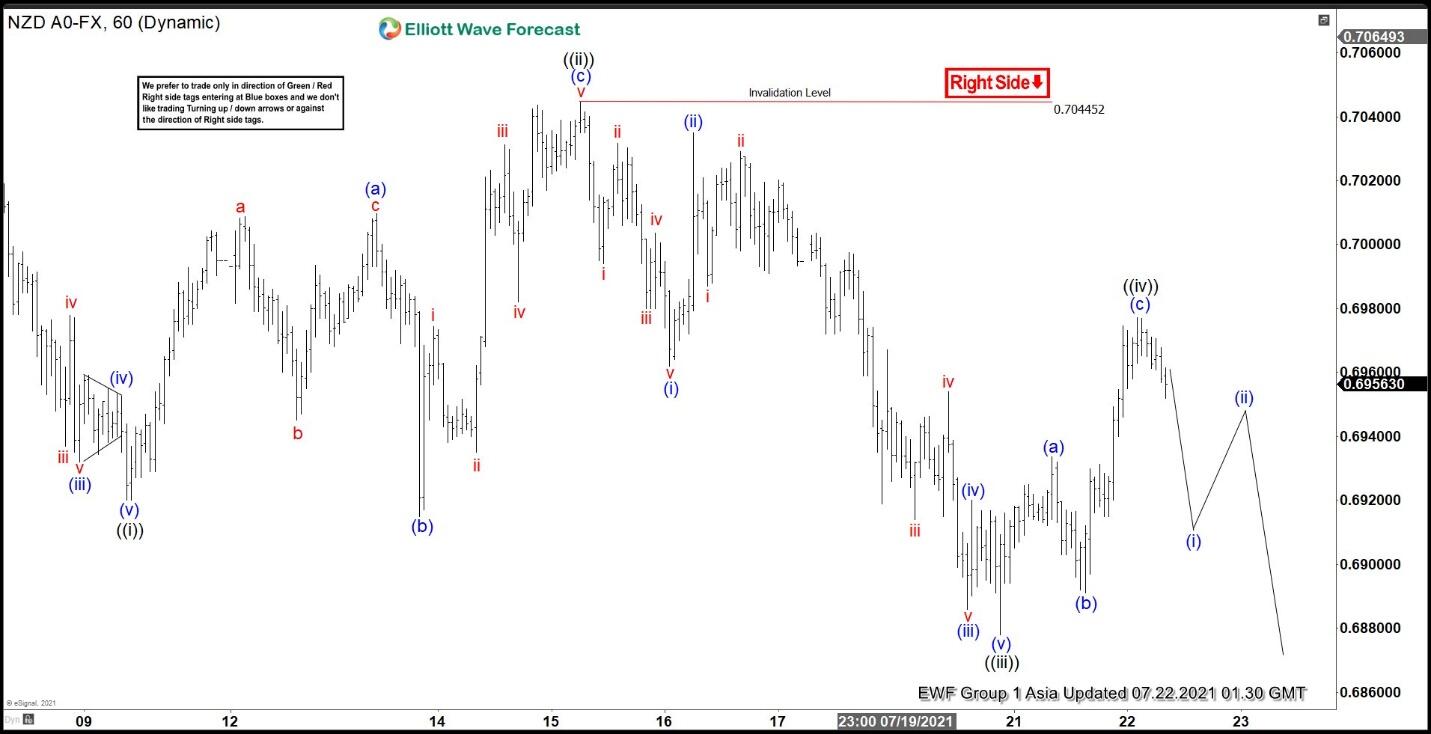
$NZDUSD shows incomplete bearish sequence from February 26, 2021 peak favoring further downside. A 100% – 161.8% Fibonacci extension from February 26 peak can see the pair reaching 0.646 – 0.679 area where support can be seen for 3 waves rally at least. Near term decline from July 6 peak is currently unfolding as a leading diagonal Elliott Wave structure. Down from July 6 peak, wave ((i)) ended at 0.692 and rally in wave ((ii)) ended at 0.7044. Pair resumes lower in wave ((iii)) towards 0.6878 with internal subdivision as a 5 waves impulse. Down from wave ((ii)), wave (i) ended at 0.696, and rally in wave (ii) ended at 0.7034. Pair then resumes lower in wave (iii) towards 0.6886 and bounce in wave (iv) ended at 0.692. Final leg lower in wave (v) ended at 0.6878 which should end wave ((iii)) in larger degree.
Bounce in wave ((iv)) is proposed complete at 0.6977 as a zigzag Elliott Wave structure. Wave (a) ended at 0.693, wave (b) ended at 0.689, and wave (c) ended at 0.6977. Expect pair to extend lower in wave ((v)) to end cycle from July 6 peak as 5 waves diagonal, then it should rally in 3 waves to correct that decline before it resumes lower again. Near term, as far as July 15 pivot high at 0.7044 remains intact, expect rally to fail in 3, 7, or 11 swing for more downside.
NZDUSD 60 Minutes Elliott Wave Chart
NZD/USD: Upsides Likely To Be Limited Above 0.7000
Key Highlights
- NZD/USD is likely to face hurdles near the 0.7000 resistance zone.
- A major bearish trend line is forming with resistance near 0.6980 on the 4-hours chart.
- EUR/USD remains well below 1.1850, GBP/USD accelerated lower below 1.3700.
- Crude oil price declined heavily below the $70.00 support zone.
NZD/USD Technical Analysis
The New Zealand Dollar gained bearish momentum below 0.7000 against the US Dollar. NZD/USD tested 0.6880 and it is now attempting an upside correction.
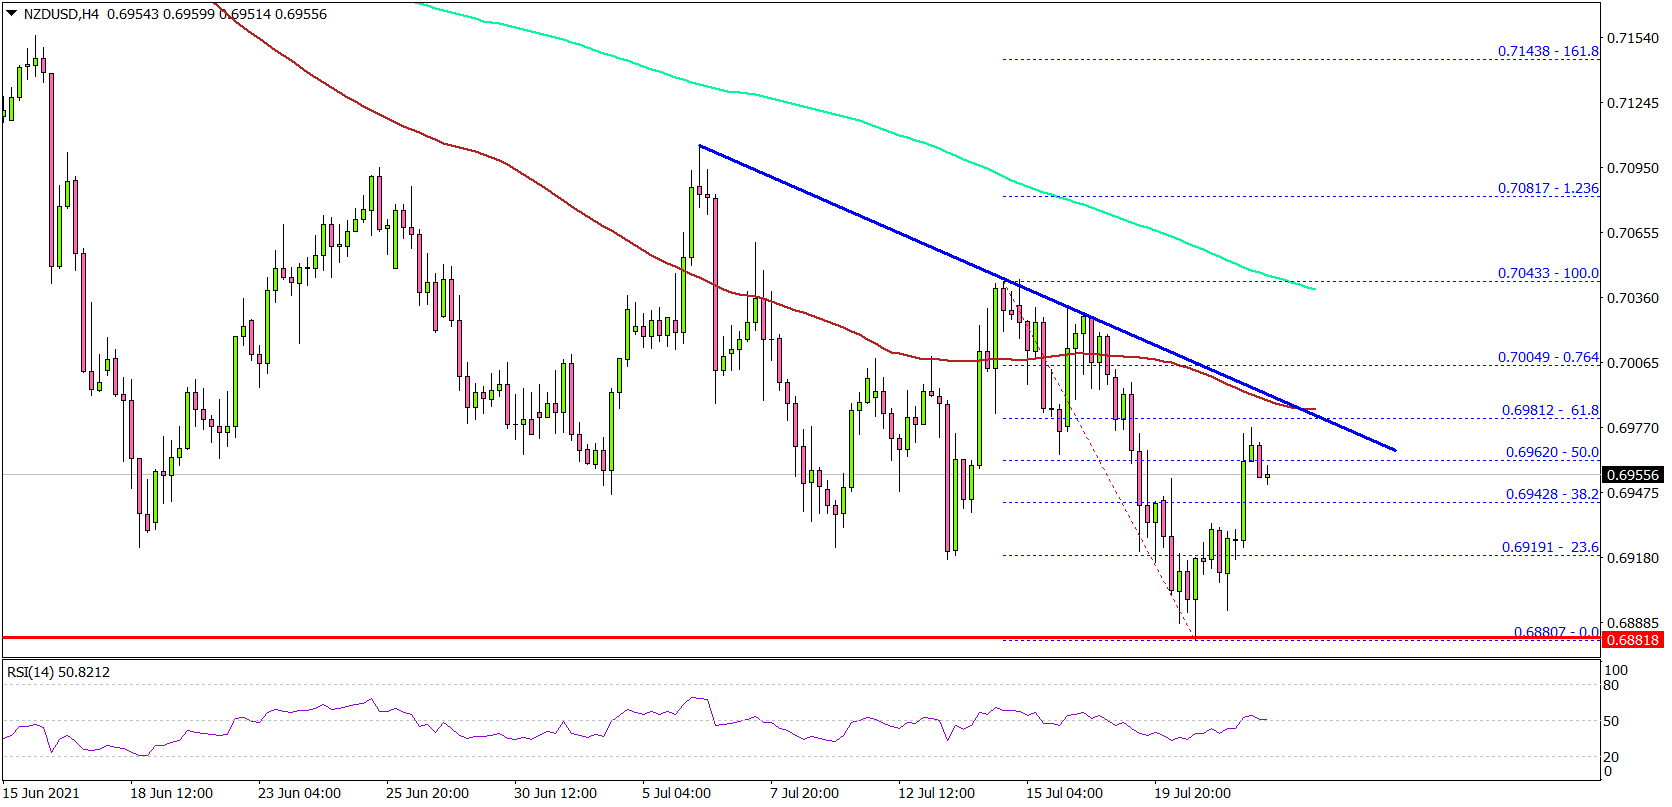
Looking at the 4-hours chart, the pair traded as low as 0.6880. It even settled well below the 0.7000 zone, the 100 simple moving average (red, 4-hours), and the 200 simple moving average (green, 4-hours).
The pair recovered above the 23.6% Fib retracement level of the key drop from the 0.7043 swing high to 0.6880 low. The first key resistance is near the 0.6950 level.
The next key resistance is now forming near the 0.6960 level. It is near the 50% Fib retracement level of the key drop from the 0.7043 swing high to 0.6880 low. There is also a major bearish trend line forming with resistance near 0.6980 on the same chart.
To move into a positive zone, the pair must settle above the 0.7000 resistance. Conversely, the pair might continue to move down below 0.6880. The next major support is near the 0.6820 level.
Looking at EUR/USD, the pair is still trading well below the 1.1850 resistance. Besides, GBP/USD traded towards 1.3570 before it found support.
Economic Releases
- ECB Interest Rate Decision – Forecast 0%, versus 0% previous.
- US Initial Jobless Claims - Forecast 350K, versus 360K previous.
Market Morning Briefing: Aussie Has Bounced Well From 0.73
STOCKS
Strong recovery in equities over the last couple of days after having fallen sharply on Tuesday. This keeps our broader bullish view on equities intact. The indices can oscillate in a broad range and we expect the sideways range to be broken on the upside. The Dow is back above 34500 and can revisit the 35000-35100 resistance which has to be broken to see a fresh rise. DAX has bounced from its key support and can gain momentum on a break above 15600. Nikkei is closed today and tomorrow. Shanghai retains its 3500-3625 range and is moving up within it. Sensex and Nifty can bounce-back within their 52000-53000 and 15600-15900 range and are likely to break them on the upside eventually.
Dow (34798, +286.01, +0.83%) has risen-back sharply after Tuesday’s fall, recovering all the loss. A test of 35000-35100 looks likely again while the momentum sustains. A strong rise past 35100 is needed to see a fresh rise to 36000. Broadly, 33000-35100 is the trading range for now. The bias is bullish to see an upside breakout of this range eventually.
The support at 15000 has held very well and DAX (15422.50, +206.23, +1.36%) has bounced from the low of 15048.56. A strong rise past 15600 from here can see a revisit of 15800. That will also keep alive the chances of seeing 16000-16200 from here itself. While below 15600, the danger of seeing 14800 on the downside first will still be there before seeing 16000-16200 on the upside.
Nikkei (27548) is closed today and tomorrow. Broadly we expect it to sustain above 27000 and retain the 27000-29500 range with a bullish bias.
Shanghai (3569.70, +7.04, +0.20%) is retaining its 3500-3625 range and is moving within its. The bias is bullish to see an upside break above 3625 and a rise to 3700-3800 over the medium-term. 3450 and 3400 are deeper supports seen below 3500. Only a break below 3400 will turn the broader view bearish.
Sensex (52198.51, −354.89, -0.68%) can rise back within the 52000-53000 range taking cues from the recovery in the global equities. Our broader view remains bullish while above the strong supports at 52000 and 51000. As such Sensex is likely to break above 53000 and see a rise to 54000 and higher levels over the medium-term.
Similarly, Nifty (15632.10, −120.30, -0.76%) can rise within its 15600-15900 range. The broader view is bullish to see an upside break above 15900 and a rise to 16000-16200 going forwards. Supports are at 15600 and 15500. The bullish view will get negated only on a break below 15500.
COMMODITIES
Commodities have recovered a bit on weak Dollar over the last 2-days and if the weakness sustains, we may expect commodities to rise back in the near term. Crude prices can rise towards immediate resistance near 72 from where another dip looks possible while Gold and Silver needs to remain above 1800 and 25 to rise towards 1820/40 and 26 respectively. Failure to hold above 1800 and 25 can drag them down towards 1780 and 24 which are crucial supports on the downside. Copper can be ranged within 4.30-4.15 and a break on either side would give more clarity on further direction.
Brent (71.94) is holding above 68 just now and the corrective upmove can take the price higher towards 72-72.50 from where another fall towards 68-65 can be expected. Only a break above 72, if seen will indicate a possible rise back towards 75-77 in the medium term. Watch price action after a rise to 72. WTI (70.08) on the other hand is holding above 64 and can rise to 71-72 in the next couple of sessions from where a dip looks likely.
Gold (1801.80) rose to 1814 yesterday but could not sustain the rise beyond that. While below initial resistance at 1820, we may see a delay in a rise towards our expected 1840/60 levels. While 1800 holds, a ranged move between 1800 and 1820 looks possible but a break below 18000 if seen can drag it down to crucial support at 1780 again. Watch price action near current levels.
Silver (25.35) tested 24.79 yesterday before bouncing back to levels above 25. Another fall below 25, if seen in the near term can be bearish for Silver towards 24-23 in the medium term. On the upside the maximum upmove could be limited to 26 over the next 1week.
Copper (4.2770) is holding well above the support near 4.20/15 and while that holds, we may continue to see ranged movement between 4.15 and 4.30. A break on either side will give clarity on further direction.
FOREX
Dollar Index has dipped a bit taking Euro higher towards 1.18. But we will watch price action closely for a few more sessions to get clarity on medium term direction. Aussie and Pound have recovered and seem to be in a corrective upmove and we may expect another fall over the next 2-3 sessions. USDCNY may fall to 6.45/44 before rising sharply towards 6.50 and higher in the medium term. USDINR may fall today towards 74.40/20. EURJPY can trade within 130.20-128.80 while USDJPY may remain within 110.80-109 levels in the near term.
Dollar Index (92.776) fell sharply from 93.19 and could be headed towards 92.40/92.00 in the near term. Unless a break below 92 is seen, it would be difficult to say if a reversal is in place and scope for a rise back to 93.0-93.20 may still be a possibility in the medium term. Watch price action on a possible fall to 92.40 which is an interim support and can hold for this week.
Euro (1.1795) has risen on Dollar weakness. But the currency may range within 1.1750-1.1820 for the very near term and while the Dollar Index is not very confident of coming off sharply from current levels, our bearish hopes on Euro seems to be increasing and will get confirmation on a break below 1.1750 in the near term. Only a rise above 1.1820/50, if seen over the coming week will show some bullish signs and indicate a rise.
EURJPY (129.91) tested 130.18 before coming off from there. A range of 130.20-128.80 may hold for the near term unless a break on either side is seen.
Dollar-Yen (110.13) tested 110.38 before coming off from there. A trade region of 110.80-109.00 may hold for the near term.
Aussie (0.7353) has bounced well from 0.73 and while that holds, Aussie could be bullish for a rise towards 0.74. A range of 0.73-0.74 may hold for the near term.
Pound (1.3705) has risen well from 1.3570 and while that holds, a rise to 1.38 can be possible. Any sharp rejection from 1.38, if seen can again take Pound back towards 1.3570/1.3500 in the longer run.
USDCNY (6.4675) has fallen sharply from 6.49 and can extend towards 6.45 before bouncing back from there. The 6.44/45-6.49/50 range may hold for now which could be followed by a sharp upmove soon. The pair seems to be on the last leg of a possible triangle correction pattern on the near term charts and could be preparing for a sharp breakout in the coming 1-2 weeks.
USDINR (74.62) held below crucial resistance at 75 last week and while that holds, we may expect a dip in the pair towards 74.40/20 in the near term. Note that below 75, important supports are seen at 74.60, 74.40 and 74.20 respectively that holds decent possibilities of pushing the pair to higher levels in the medium term. A break below 74.60 looks likely today to pave way for 74.40/20 in the near term.
INTEREST RATES
The US Treasury yields have recovered sharply from Tuesday’s fall and are back above their crucial supports. While this bounce sustains above the supports, the corrective rise that we had mentioned earlier will still be a possibility in the coming days. The German Yields remain bearish and have more room to fall from current levels. The 5Yr GOI has broken its 5.64%-5.7% range on the downside and can fall further in the coming days while this break sustains.
The US 2Yr (0.21%), 5Yr (0.74%), 10Yr (1.29%) and 30Yr (1.94%) have risen back sharply after tumbling on Tuesday. The 30Yr is back above 1.9% and the danger of seeing 1.7% on the downside mentioned earlier has reduced. A rise past 2% from here can see a relief rally to 2.1%-2.2%. The 10Yr on the other hand can see a corrective rise to 1.45%-1.5% while it manages to sustain above 1.2%.
The German 2Yr (-0.72%) and 5Yr (-0.69%) yields have dipped further while the 10Yr (-0.40%) and 30Yr (0.08%) remain stable. Our bearish view remains intact. The 10Yr has room to test -0.45%/-0.50%. The 30Yr is at an intermediate support but looks vulnerable to break below it and fall to 0%/-0.05% in the coming days.
The 10Yr GoI (6.1904%) is stuck below 6.2% with muted trading. The 5Yr GOI (5.6350%) on the other hand has broken the 5.64%-5.7% range on the downside. While this break sustains a further fall to 5.6% and 5.56% is possible in the coming days.
Eco Data 7/22/21
[php_everywhere instance="1"]
US Crude Oil Inventory Surprisingly Increased for First Time in 3 Months
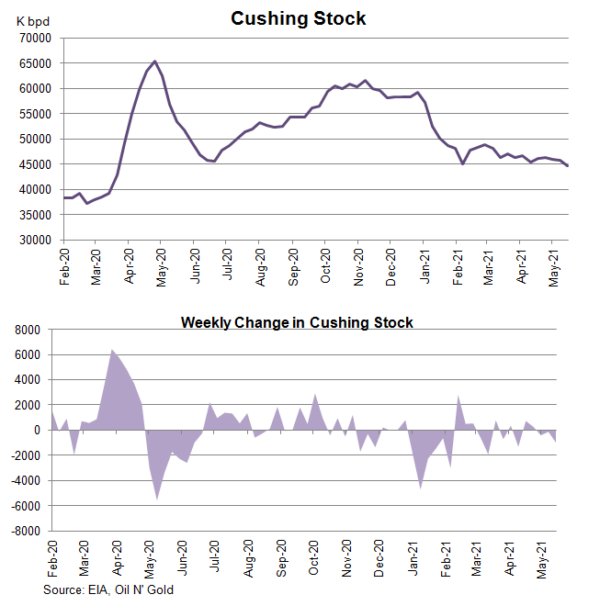
The report from the US Energy Information Administration (EIA) shows that total crude oil and petroleum products (ex. SPR) stocks rose +4.42 mmb to 1275.28 mmb in the week ended June 16. Crude oil inventory increased, for the first time since mid-April, by +2.11 mmb (consensus: -4.47 mmb) to 439.69 mmb. Stockpile increased in 3 out of 5 PADDs. PADD 3 (Gulf Coast) saw growth of +1.9 mmb. Cushing stock sank -1.35 mmb to 36.71 mmb. Utilization rate decreased -0.4 percentage points to 91.4% while crude production steadied at 11.4M bpd for the week. Crude oil imports increased +0.88M bpd to 7.1M bpd in the week.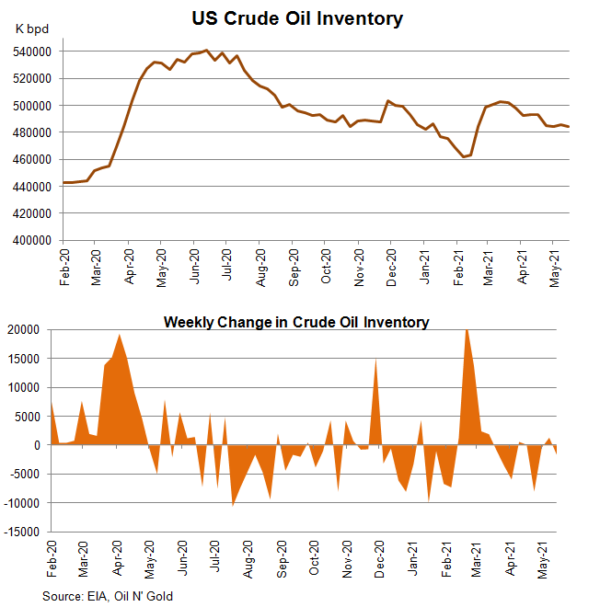
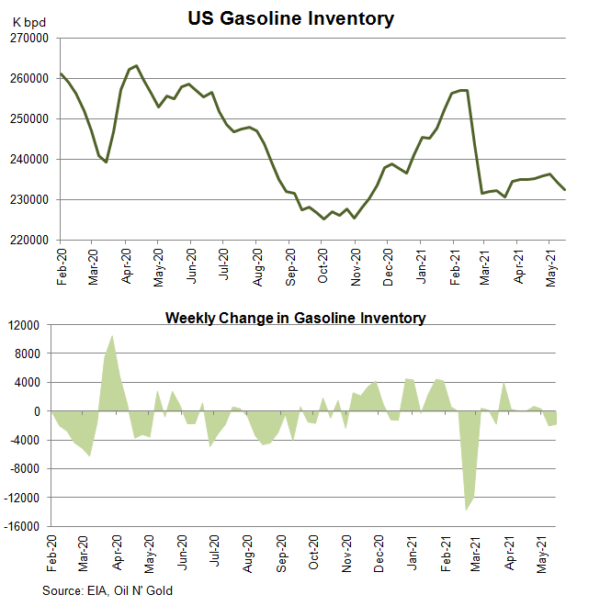
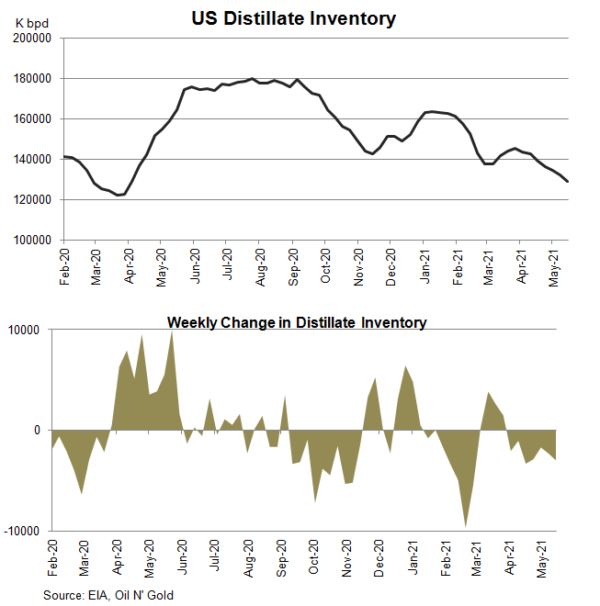
 Concerning refined oil product inventories, gasoline inventory slipped -0.12 mmb to 236.41 mmb as demand added +0.13% to 9.3M bpd. The market had anticipated a -1.04 mmb fall in stockpile. Production dropped -7.38% to 9.13M bpd while imports were up +31.61% to 1.37M bpd during the week. Distillate stockpile dropped -1.35 mmb to 141 mmb. The market had anticipated a +0.56 mmb increase. Demand jumped +24.05% to 3.93M bpd. Production dipped -0.49% to 4.9 mmb while imports rose +12.99% to 0.087M bpd during the week
A day earlier, the industry-sponsored API estimated that crude oil inventory was up +0.81 mmb. Gasoline stockpile gained +3.31 mmb, while that for distillate dropped -1.23 mmb
GBPJPY powers up as negative risks endure
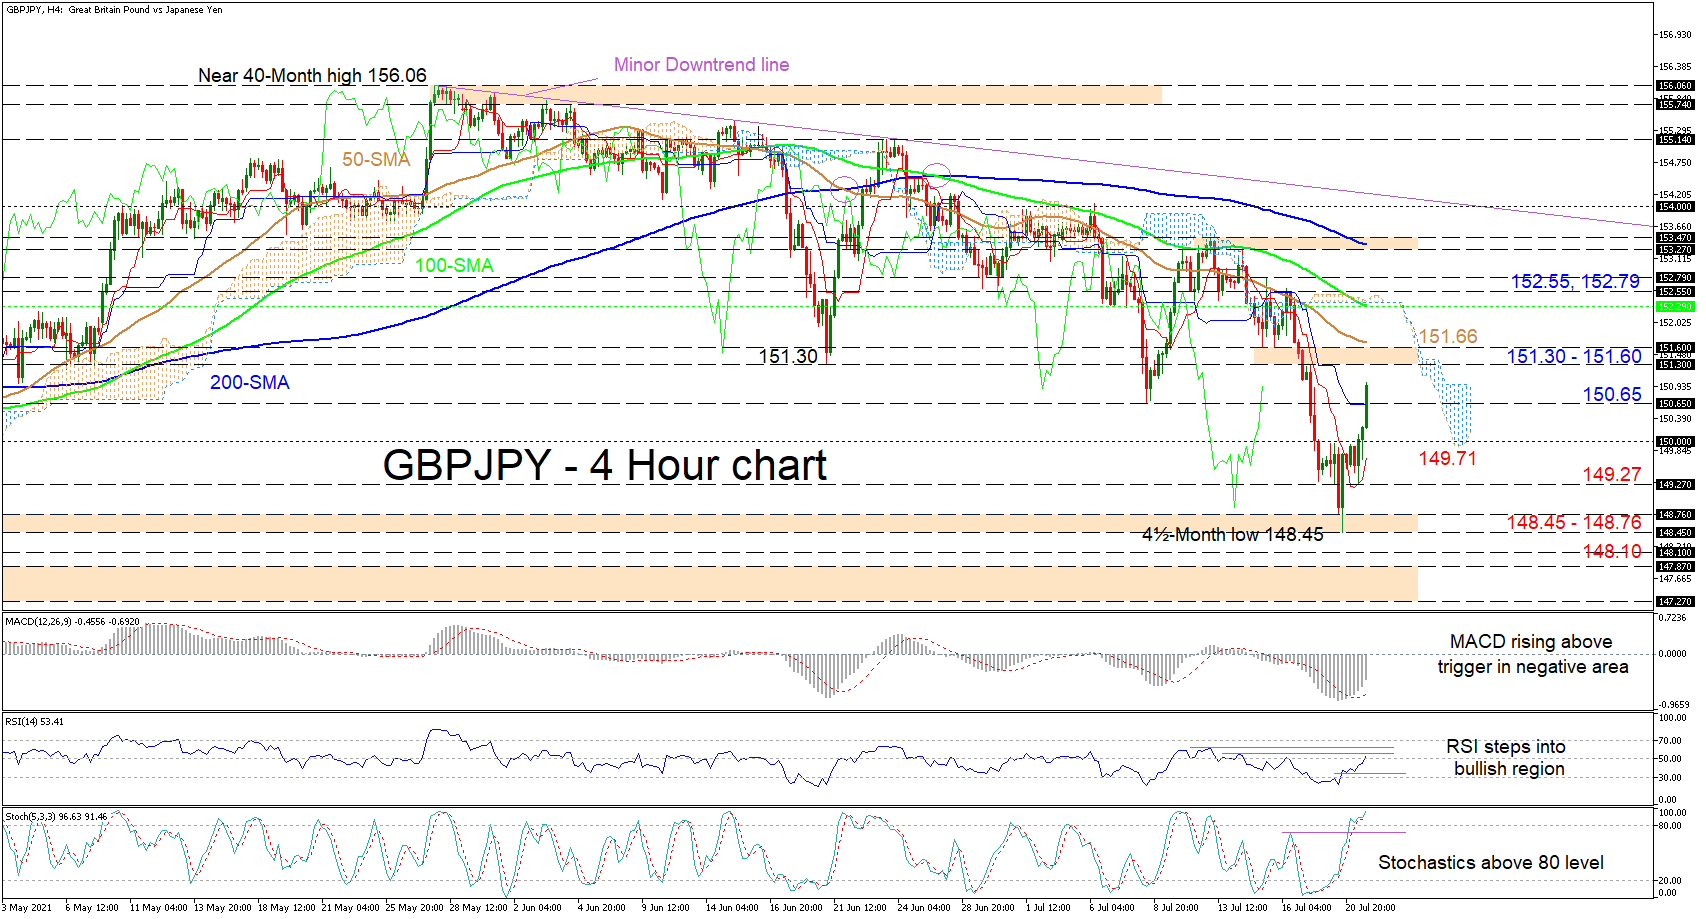
GBPJPY has pushed over the 150.65 barrier and is making efforts to test the resistance band of 151.30-151.60. The falling simple moving averages (SMAs) are defending the broader bearish move, while the uptick in the red Tenkan-sen line is suggesting robust buying interest off the four-and-a-half-month bounce.
The short-term oscillators are indicating growing upside momentum, although the bearish structure still maintains the upper hand. The MACD below zero is improving above its red trigger line, while the upward pointing RSI has broken above the 50 threshold. Backing additional positive price action is the stochastic oscillator, which is sustaining its positive charge in the overbought territory.
If buyers manage to sustain their advantage, tough upside constraints may commence from the 151.30-151.60 region, reinforced by the approaching 50-period SMA overhead at 151.66. Making additional headways, the bulls may then meet resistance around the 100-period SMA at 152.29 near the Ichimoku cloud, while the neighbouring highs of 152.55 and 152.79 could make it even harder for buyers to tilt the bias more in their favour.
If sellers retake control, initial friction may emanate from the 150.65 barrier before the bears test the 150.00 handle. Sinking beneath this round number, support could develop around the red Tenkan-sen line at 149.71 ahead of the 149.27 low. If negative pressures gain more power, the obstacle to beat becomes the buffer zone of 148.45-148.76, a break of which may revive the downward trajectory quickly testing the March 2 low of 148.10.
Summarizing, in the short-term timeframe, GBPJPY’s bearish bearing remains intact as long as the price persists below the 151.30-151.60 boundary and the SMAs.