

Sample Category Title
Dollar Rises Against Yen as Sentiments Recover Further
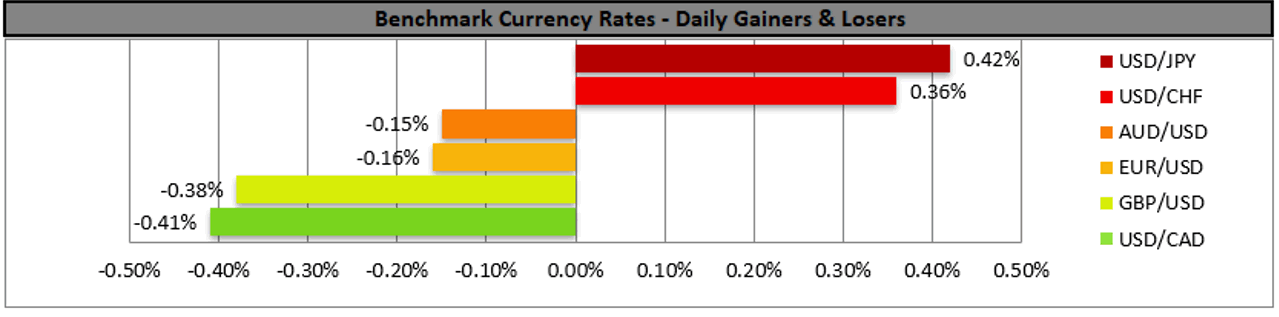
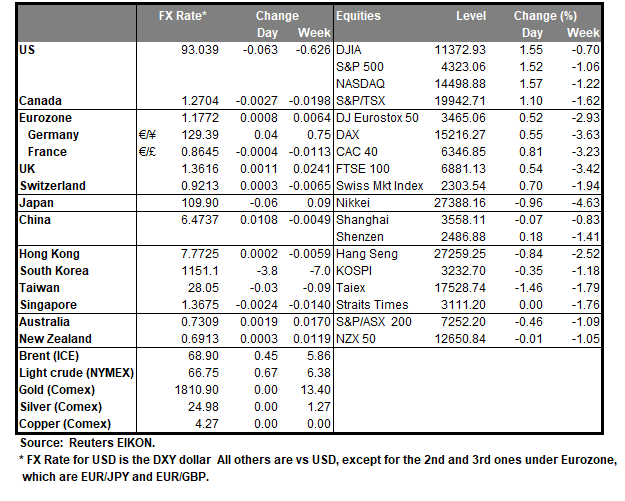
The forex markets appear to be turning into a consolidative phase for now. Yen is trading broadly lower as European indexes and US futures rebound further. Canadian Dollar is the strongest one with WTI crude oil reclaiming 68 handle. Aussie and Sterling are following as the next strongest for the day. But after all, there is not much change in the weekly picture, as Dollar and Yen are still the strongest while commodity currencies are the weakest.
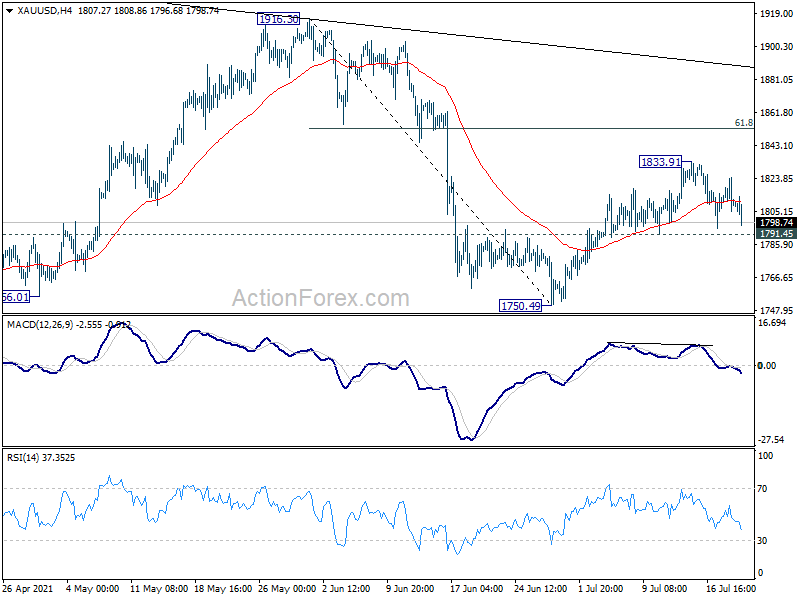
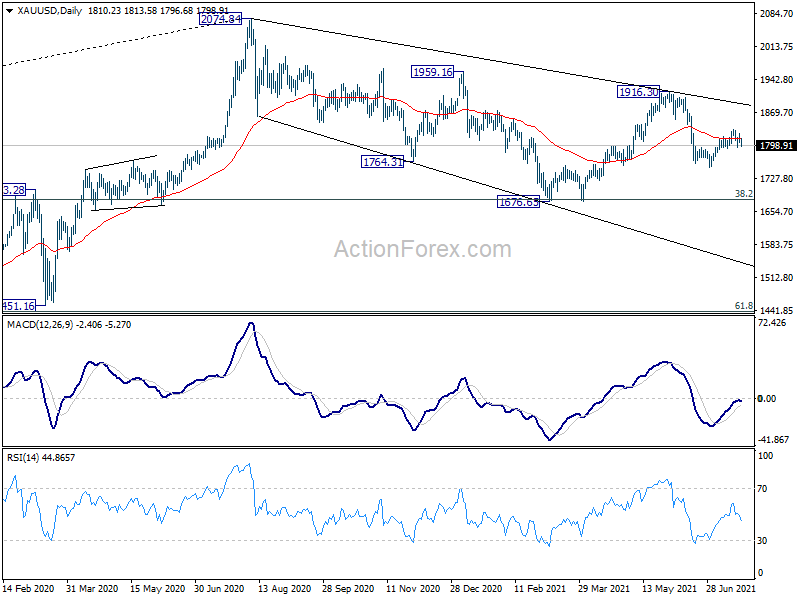
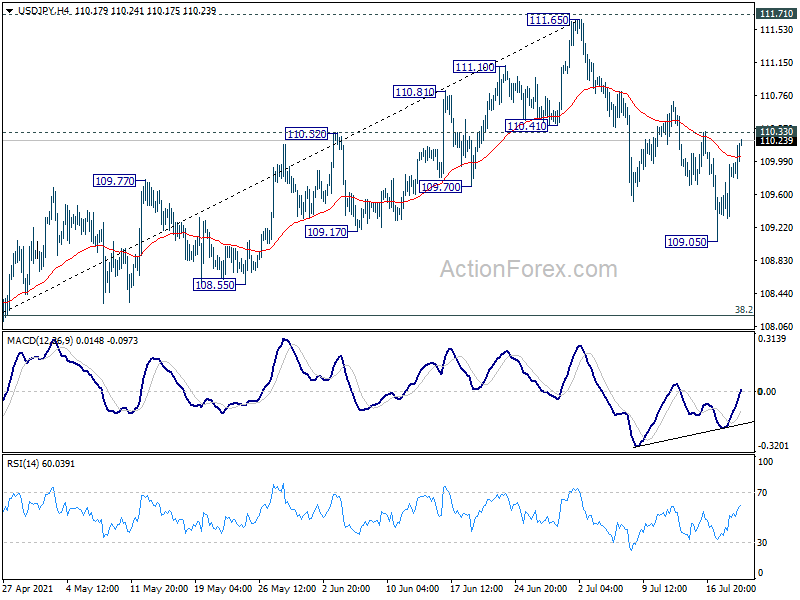
Technically, USD/JPY's strong rebound is worth a note. Eyes are now on 110.33 resistance. Break there will argue that corrective fall from 111.65 has completed at 109.05. Stronger rise would then be seen back to retest 111.65 high. At the same time, Gold is back below 1800 handle, with eyes on 1791.45 support. Break will indicate completion of rebound from 1750.49, and bring retest of this support. Both developments, if happen together, could indicate stronger rally in Dollar elsewhere.
In Europe, at the time of writing, FTSE is up 1.52%. DAX is up 0.85%. CAC is up 1.37%. Germany 10-year yield is down -0.002 at -0.410. Earlier in Asia, Nikkei rose 0.58%. Hong Kong HSI dropped -0.13%. China Shanghai SSE rose 0.73%. Singapore Strait Times rose 0.25%.
Gold back below 1800, but staying in range
Gold drops notably again today, and it's back below 1800 handle at the time of writing. Though down is still contained above 1791.45 support. Focus will remain on this support level. As long as 1791.45 support, rebound from 1750.49 is still in favor to resume. Break of 1833.91 will target 61.8% retracement of 1916.30 to 1750.49 at 1852.96.
However, firm break of 1791.45 would likely resume the decline from 1916.30. Further break of 1750.49 would confirm this bearish case and target 1676.65 support again.
BoJ Masayoshi: Inflation sluggish and powerful easing necessary
BoJ Deputy Governor Amamiya Masayoshi said speech, an uptrend in private consumption is expected to "become evident" as the impact of COVID-19 wanes gradually and employee income increases". The "virtuous cycle" in the "corporate sector" will spread to the "household sector", and "intensifying the cycle in the overall economy." Nevertheless, the baseline scenario entails "high uncertainties" with risks "skewed to the downside" on the spread of variants. But activity could improve more than expected as vaccine rollout accelerates.
Masayoshi also said that it will "take time" to achieve price stability target of 2% inflation. He added, "while the inflation rate has risen clearly of late in the United States and other countries, it has been sluggish in Japan." Giver this, "it is necessary for the Bank to persistently continue to conduct powerful monetary easing with a view to achieving the price stability target."
Japan exports rose 48.6% yoy in Jun, 4th month of double-digit growth
Japan's exports rose 48.6% yoy to JPY 7220B in June. That;s the fourth straight month of double-digit growth, even though it's largely exaggerated by the pandemic plunge last year. By destination, exports to China jumped 27.7% yoy, led by demand for chip-making equipment, raw materials and plastic. Exports to US also rose 85.5% yoy, driven by cars, auto parts and motors. Imports rose 32.7% yoy to JPY 6837B. Trade surplus came in at JPY 383B.
In seasonally adjusted terms, exports rose 2.4% mom to JPY 7040B. Imports rose 4.0% mom to JPY 7130B. Trade balance turned into deficit of JPY 0.09T, versus expectation of JPY 0.02T surplus.
Australia retail sales dropped -1.8% mom in Jun on return to restrictions
According to preliminary estimate, Australia retail sales dropped -1.8% or AUD -515.1m in June 2021. Comparing to June 2020, sales rose 2.9% yoy. Victoria (-3.5 per cent) led the state falls in June, with the impact of the state's fourth lockdown more pronounced in June than May (-0.9 per cent). New South Wales (-2.0 per cent) and Queensland (-1.5 per cent) also fell due to stay-at-home restrictions and reduced interstate mobility.
Ben James, Director of Quarterly Economy Wide Surveys, said: "June's fall in turnover was due to the impact of coronavirus restrictions across multiple states. Victoria saw restrictions from the start of the month, which were gradually eased from the 11th of June. New South Wales, in particular Greater Sydney, saw stay-at-home orders issued towards the end of the month. Other states and territories saw interrupted trade due to mini-lockdowns, as well as reduced mobility between states with the tightening of border restrictions."
Australia Westpac leading index dropped to 1.34, RBA to use flexibility in asset purchases
Australia Westpac leading index slowed from 1.68% to 1.34% in June. The index peaked at 5% back in November last year and then gradually fallen back. It's still comfortably above zero and signals outlook for above trend growth. Still, Westpac expected -3.1% contraction in GDP in Q3 in New South Wales and -0.1% in Victoria due to renewed lockdowns.
Westpac added that RBA would be advised of significant downward revisions for Q3 growth at the meeting on August 3. It said it's an "appropriate time" for RBA to use the "flexibility" on asset purchases. At the least it could announce to defer the tapering from AUD 5B to AUD 4B a week, which is scheduled to start in September. Further, "a decision to immediately lift purchases to $6 billion per week would certainly send the right signal that the Bank is responsive to economic developments and is prepared to use its new flexible policy tool accordingly."
USD/JPY Mid-Day Outlook
Daily Pivots: (S1) 109.47; (P) 109.72; (R1) 110.10; More...
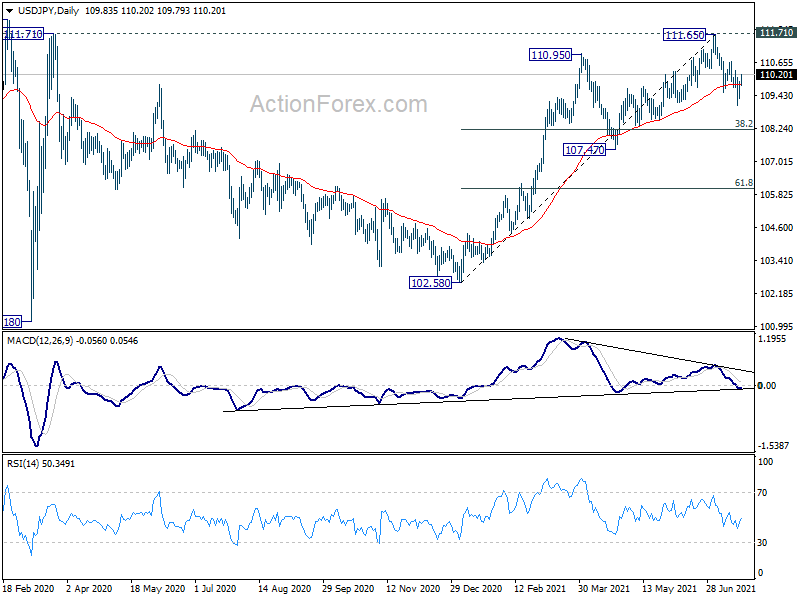
Intraday bias in USD/JPY remains neutral at this point. Further fall will remain in favor as long as 110.33 resistance intact. On the downside, break of 109.05 will target 38.2% retracement of 102.58 to 111.65 at 108.18. However, on the upside, break of 110.33 will argue that the choppy fall from 111.65 has completed, and turn bias back to the upside for retesting this high.
In the bigger picture, medium term outlook is staying neutral with 111.71 resistance intact. Sustained trading below 55 day EMA would argue that the pattern from 101.18 is starting another falling leg, that could head back to 102.58 support and below. For now, outlook won't turn bullish as long as 111.71 resistance holds, even in case of strong rebound.
Economic Indicators Update
| GMT | Ccy | Events | Actual | Forecast | Previous | Revised |
|---|---|---|---|---|---|---|
| 23:50 | JPY | Trade Balance (JPY) Jun | -0.09T | 0.02T | 0.04T | 0.02T |
| 23:50 | JPY | BoJ Minutes | ||||
| 0:30 | AUD | Westpac Leading Index M/M Jun | -0.10% | -0.10% | 0.10% | |
| 1:30 | AUD | Retail Sales M/M Jun P | -1.80% | -0.50% | 0.40% | |
| 6:00 | GBP | Public Sector Net Borrowing (GBP) Jun | 22.0B | 21.5B | 23.6B | 19.9B |
| 12:30 | CAD | New Housing Price Index M/M Jun | 0.60% | 1.10% | 1.40% | |
| 14:30 | USD | Crude Oil Inventories | -7.9M |
Gold back below 1800, but staying in range
Gold drops notably again today, and it's back below 1800 handle at the time of writing. Though down is still contained above 1791.45 support. Focus will remain on this support level. As long as 1791.45 support, rebound from 1750.49 is still in favor to resume. Break of 1833.91 will target 61.8% retracement of 1916.30 to 1750.49 at 1852.96.
However, firm break of 1791.45 would likely resume the decline from 1916.30. Further break of 1750.49 would confirm this bearish case and target 1676.65 support again.
USD Takes A Break
The greenback continued to gain against a number of its counterparts yesterday yet at a more eased pace while gold prices ended to remain relatively stable and US stockmarkets reversed course and regained a substantial part of Monday’s losses. In regard to US stockmarkets it seems that investors took the opportunity to buy at low levels as confidence over the US economic recovery allowed them to see through the fog created by the spreading of the disease. The spreading of the pandemic is ongoing, and particularly the contagious Delta variant, continues to torment especially Asian economies but other parts of the world as well, with new lockdowns being deployed. It should be noted that the improvement in investors’ confidence was also depicted in US yields and characteristically the US 10-year yield rose to reach 1.21%, despite a downward trend still being present. Given the lack of high impact financial releases, we expect fundamentals taking the lead and should the market’s optimism grow, safe havens could retreat and vice versa.
Dow Jones reversed its downward course and reverted also a substantial part of Mondays’ losses yesterday by breaking the 34100 (S2) and the 34400 (S1) resistance lines, both now turned to support, before stabilising. As the index’s direction has reversed, we abandon our or bearish outlook for Dow jones and adopt a bias for a sideways motion initially until the index decides on the direction of its next leg given the index’s stabilisation in the late session yesterday. We note that the RSI indicator below our 1 hour chart is between the readings of 50 and 70, implying a slight advantage for the bulls. Should the bulls actually take charge of Dow Jones’ direction once again we may see it breaking the 34700 (R1) resistance line which reversed the upward motion of Dow Jones on the 7th of July, and aim for the 35100 (R2) resistance level, which marks an all-time high for the index. Should the bears take over, we may see the index breaking the 34400 (S1) support line and aim which stopped the index’s drop on the 6th of July and aim for the 34100 (S2) support level.
CAD gains on investors’ confidence
The Looney strengthened against the USD but also against the pound yesterday as the commodity currency benefited from the investors’ confidence overspilling north of the US border. As economically sensitive stocks performed a comeback on Tuesday, and oil, one of Canada's major exports, tended to stabilize somewhat after the steep drop performed on Monday for oil prices, reaching an almost two-month low, the looney was supported. It should be noted that oil prices tended to stabilize despite a surprise built up of US oil inventories which turns oil traders attention towards the EIA weekly crude oil inventories figure. Also, Canadian government bond yields sent some mixed signals overall, following though the U.S. Treasuries as the 10-year yield rose reaching 1.18% after dropping on Monday. We expect oil prices along with fundamentals to provide direction for the Looney today, despite some financial data from Canada being also released.
USD/CAD dropped yesterday reflecting the strengthening of the CAD and broke the 1.2745 (R1) support line, now turned to resistance. Despite the drop we tend to remain rather bullish for the pair, and for it to change we would require a clear breaking of the 1.2650 (S1) support line currently. Also note that the RSI indicator below our 4-hour chart is between the readings of 50 and 70 underscoring the presence of the bulls for the pair. Should buyers regain control over the pair, we may see it breaking the 1.2745 (R1) resistance line and aim for the 1.2835 (R2) level. Should a selling interest be displayed for the pair, we may see it breaking the 1.2650 (S1) support line and aim for the 1.2560 (S2) level.
Other economic highlights today and the following Asian session:
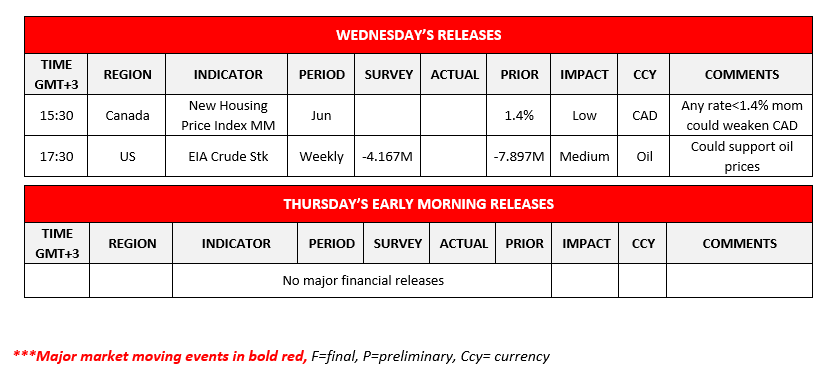
Today we have a light calendar, yet we note during the American session the release of the US EIA crude oil inventories figure.
US 30 Cash H1 Chart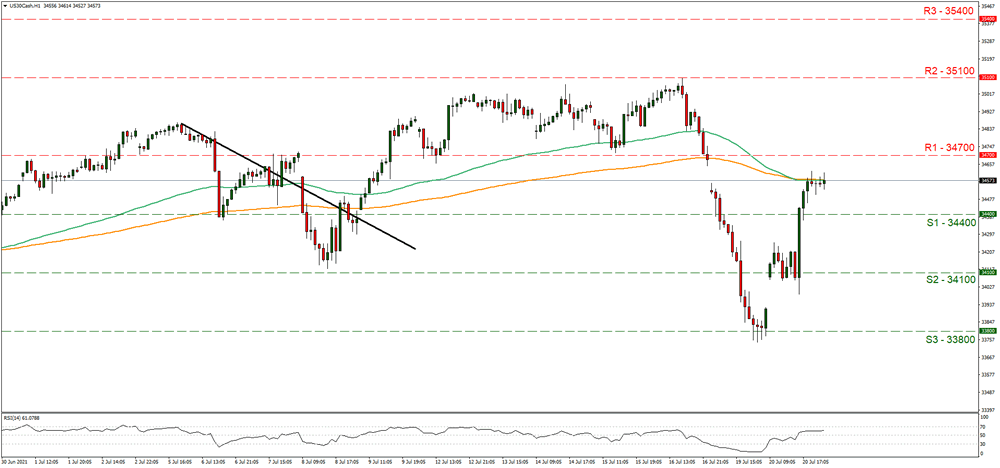
Support: 34400 (S1), 34100 (S2), 33800 (S3)
Resistance: 34700 (R1), 35100 (R2), 35400 (R3)
USD/CAD H4 Chart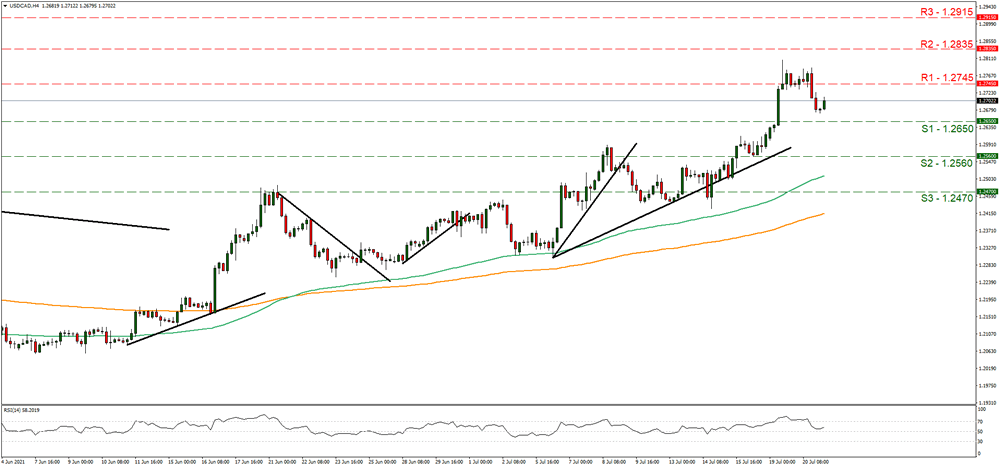
Support: 1.2650 (S1), 1.2560 (S2), 1.2470 (S3)
Resistance: 1.2745 (R1), 1.2835 (R2), 1.2915 (R3)
Aussie Extends Slide As Retail Sales Slip
The Australian dollar is seeing all red, with the currency in decline for a fifth consecutive day. Currently, AUD/USD is trading at 0.7316, down 0.18% on the day. The pair fell below the 73-level earlier in the day.
Australian retail sales weaker than forecast
Australia retail sales for June (preliminary estimate) disappointed, as the decline of -1.8% was worse than the consensus of -0.5% and below the May reading of 0.4%. The release could make investors nervous about the health of the economy for two reasons. First, the decline was much sharper than expected. Secondly, it marked the first drop since January. The weak reading reflects the June lockdowns in Victoria and New South Wales, both of which showed significant declines in retail sales. With some half of Australians currently under lockdown, July could also register a decline.
Is Aussie headed to 72-territory?
The Australian dollar is experiencing a nasty downturn, having plunged 2.2% in less than a week. Although the economy has recovered to pre-Covid levels, some institutions have downgraded growth for H2 of 2021. This will likely have a chilling effect on any plans at the RBA to tighten policy, which means that the struggling Aussie won’t be getting any support from the central bank.
The RBA minutes did not contain any surprises, although it was of interest to learn that the decision to taper the bond purchase programme from AUD 5 billion to 4 billion was hotly debated. There is a lesson here – the taper, which was a tightening of policy, lifted the Australian dollar. However, the rise was short-lived, as the RBA has remained dovish, even with the taper. Clearly, a taper does mean that a central bank has changed into a hawk; in the case at hand, the RBA said at its meeting that stimulus was still necessary and that rate hikes were a long way off, even while tapering at the same time. This means that even when the headlines are blaring about a central bank tapering, it’s critical for investors and traders to block out the noise and listen carefully to what policymakers are saying with regard to monetary policy.
AUD/USD Technical
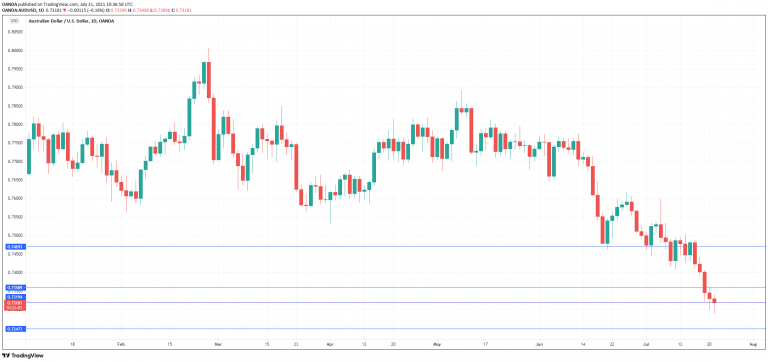
- AUD/USD is testing support 0.7319. Below, there is support at 0.7247
- There is weak resistance at 0.7358, followed by resistance at 0.7469
USD/JPY Outlook: Recovery Probes Above 110 Pivot, Underpinned By Bear-Trap
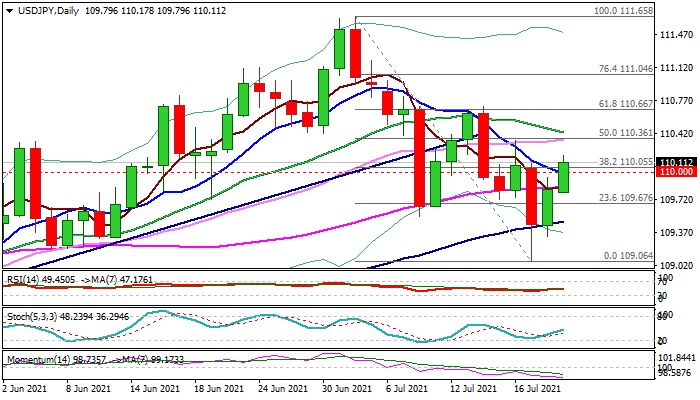
Bulls regained control as bounce from Monday’s seven-week spike low extends into second straight day and probe above pivotal 110 barrier (psychological/Fibo 38.2% of 111.65/109.09 fall).
Strong downside rejection on Monday formed a bear-trap under 100DMA that supports recovery, underpinned by rising daily cloud.
Close above 110 pivot is needed to generate bullish signal and open way for further advance.
Mixed daily studies so far lack clearer direction signal, rising bearish momentum suggests that recovery is still fragile, with failure to clearly break 110 resistance zone to keep the downside vulnerable.
Res: 110.17, 110.36, 110.66, 111.04.
Sup: 110.00, 109.79, 109.48, 109.06.
Risk Appetite Finds Some Footing
Notes/Observations
- UK Spending data showed that the Treasury paid £8.7B in interest in June (a record) as Inflation helping to drive interest payments on government debt to unprecedented levels (Note: A quarter of government debt is linked to inflation indexes).
- UK government to set out its proposals for post-Brexit arrangements for Northern Ireland (Note: likely put the UK on another collision course with the EU).
- US yields move off recent 5-month lows as risk appetite finds some fresh tailwinds.
- Companies due to report during the NY morning include Anthem, Baker Hughes, Comerica, Interpublic, JNJ, Knight-Swift Transportation, Coca-Cola, Lithia Motors, NASDAQ, Northern Trust, Seagate Technology, Universal Stainless & Alloy Products, Verizon.
Asia
- BOJ June Meeting Minutes (two decisions ago): Members agree to not hesitate to add easing if needed.
- BOJ Dep Gov Amamiya reiterated the overall assessment that the domestic economy picking up as a trend; risks to the economic outlook were skewed to the downside. A chance economic activity might overshoot expectations if vaccinations speed up. Would continue to conduct appropriate policy and reiterated the stance that was prepared to considering additional easing steps depending on economic conditions.
- Japan markets are closed for a holiday on Thursday and Friday (Jul 22-23rd).
Coronavirus
- Currently, about 50% of Australia is in some sort of lockdown or restriction due to COVID.
Europe
- UK Brexit Sec Frost said to outline a strategy that sought to eliminate most of the checks on the Irish Sea border. To warn that Britain could suspend the Northern Ireland protocol if the EU did not give way.
- EU Commission published a proposal that Spanish border guards should be placed along the Gibraltar border.
Americas
- US Senate expected to vote on President Biden’s infrastructure bill.
- Senate Democrats said to be considering a Plan B if bipartisan infrastructure talks fail, adding ~$600B the Reps have already accepted to the Dems $3.5T plan, the overall price tag will be $4.1T.
Energy
- Weekly API Crude Oil Inventories: +0.8M v -4.1M prior (1st build in 9 weeks).
- US said to be close to a deal with Germany to resolve disputes over the Nord Stream 2 pipeline.
Speakers/Fixed income/FX/Commodities/Erratum
Equities
- Indices [Stoxx600 +1.08% at 451.42, FTSE +1.40% at 6,977.75, DAX +0.69% at 15,321.30, CAC-40 +1.18% at 6,421.99, IBEX-35 +1.95% at 8,521.00, FTSE MIB +1.54% at 24,479.50, SMI +0.36% at 11,989.21 , S&P 500 Futures +0.39%].
- Market Focal Points/Key Themes: European indices open higher across the board and advanced further into the green as the session progressed; better-performing sectors lead by consumer discretionary and materials; the only sector starting the day in the red was industrials; DAX weighed by disappointing earnings from SAP, Daimler; energy sector under pressure following unexpected build in inventories in the US; reportedly CDR looking to make an offer for Morrisons; earnings expected during the upcoming US session include Anthem, Coca-Cola, Comerica, and Harley Davidson.
Equities
- Consumer discretionary: Next [NXT.UK] +9% (trading update), Royal Mail [RMG.UK] -2% (trading update).
- Materials: Akzo Nobel [AKZA.NL] -2% (earnings).
- Healthcare: Novartis [NOVN.CH] +2% (earnings).
- Industrials: Daimler [DAI.DE] -1% (earnings; cites chip shortage issue to persist in H2).
- Technology: ASML [ASML.NL] +4% (earnings), SAP [SAP.DE] -2% (earnings; raises outlook).
- Utilities: Iberdrola [IBE.ES] +1% (earnings).
Speakers
- Germany Fin Min Scholz: Flood assistance around €400M with relief coming out of the current budget.
- Poland Central Bank's Zubelewicz stated that needed to abandon the ultra-loose monetary policy and QE. The goal of bond-buying had been more than achieved Believed that only a rate hike motion from Gov Glapinski could succeed.
- China National Reserve Administration (SRB) said to sell the 2nd batch of base metals on July 29th.
- Philippines Fin Min Dominguez stated that Govt had room to cut banks’ reserve requirement ratio as the economy recovered from the effects of the pandemic.
Currencies/Fixed Income
- USD initially maintained a firm tone in the session continue to be aided by safe-haven flows due to fears the spread of the delta coronavirus variant could derail the global economic recovery. Greenback gave back most of the gains as risk appetite found some tailwinds.
- EUR/USD tested 1.1752 before rebounding to 1.1780 with a focus on Thursday’s ECB decision.
- GBP/USD slumped to test below 1.36 as UK govt was set out its proposals for post-Brexit arrangements for Northern Ireland and likely butt heads with EU on the topic. UK Brexit Sec Frost said to have warned that Britain could suspend the Northern Ireland protocol if the EU did not give way.
Economic data
- (UK) Jun Public Finances (PSNCR): £11.3B v £21.7B prior; Public Sector Net Borrowing: £22.0B v £21.5Be; Central Government NCR: £19.2B v £23.9B prior; PSNB (ex-banking groups): £22.8B v £21.9Be.
- (JP) Japan Jun Final Machine Tool Orders Y/Y: 96.6% v 96.6% prelim.
- (CH) Swiss Jun M3 Money Supply Y/Y: 3.5% v 4.2% prior.
- (IT) Italy May Industrial Sales M/M: -1.0% v 3.3% prior; Y/Y: 40.2% v 105.1% prior.
- (ZA) South Africa Jun CPI M/M: 0.2% v 0.2%e; Y/Y: 4.9% v 4.8%e (4th month within target band).
- (ZA) South Africa Jun CPI Core M/M: 0.3% v 0.2%e; Y/Y: 3.2% v 3.1%e.
- (PL) Poland Jun Real Retail Sales M/M: 3.5% v 8.2% prior; Y/Y: 8.6% v 9.2%e; Retail Sales Y/Y: 13.0% v 13.1%e.
- (PL) Poland Jun Construction Output Y/Y: 4.4% v 7.0%e.
- (PL) Poland July Consumer Confidence: -13.5% v -14.8 prior.
Fixed income Issuance
- (ID) Indonesia opened its book to sell EUR-denominated 8-year bonds; guidance saw +150bps to mid-swaps.
- (CH) Chile opened its book to sell EUR-denominated 5-year and 15-year bonds.
- (DK) Denmark sold total DKK1.96B in 2024 and 2031 DGB Bonds.
Looking Ahead
- 05:25 (EU) Daily ECB Liquidity Stats.
- 05:30 (DE) Germany to sell €1.0B in 1.25% Aug 2048 Bunds.
- 05:30 (PT) Portugal Debt Agency (IGCP) to sell 12-month bills.
- 05:30 (HU) Hungary Debt Agency (AKK) to sell 12-month Bills.
- 05:30 (ZA) South Africa announces details of the next bond auction (held on Tuesdays).
- 06:00 (RU) Russia to sell RUB20B in 6.9% 2031 OFZ bonds.
- 06:45 (US) Daily Libor Fixing.
- 07:00 (US) MBA Mortgage Applications w/e July 16th: No est v 16.0% prior.
- 07:00 (UK) Weekly PM Question time in House.
- 08:00 (UK) Daily Baltic Dry Bulk Index.
- 09:45 (UK) BOE to buy £1.147B in APF Gilt purchase operation (7-20 years).
- 10:00 (BR) Brazil Jun Tax Collections (BRL): 139.8Be v 142.1B prior.
- 10:30 (US) Weekly DOE Oil Inventories.
- 13:00 (US) Treasury to sell 20-Year bonds.
- 15:00 (AR) Argentina Jun Trade Balance: $1.0Be v $1.6B prior.
- 15:00 (AR) Argentina May Economic Activity Index (Monthly GDP) M/M: -2.0%e v -1.2% prior; Y/Y: 17.5%e v 28.3% prior.
- 18:00 (NL) Netherlands Jun House Price Index M/M: No est v 2.0% prior; Y/Y: No est v 12.9% prior.
- 21:00 (CN) China Jun Swift Global Payments (CNY): No est v B prior.
- 21:30 (AU) Australia Q2 Business Confidence: No est v 17 prior.
- 21:30 (AU) Australia Preliminary June Merchandise Trade: No est v A$9.7B prior.
The Analytical Overview Of The Main Currency Pairs
The EUR/USD currency pair
Technical indicators of the currency pair:
Prev Open: 1.1797
Prev Close: 1.1780
% chg. over the last day: -0.14%
The fundamental picture on the EUR/USD currency pair plays in favor of the growth of quotes, but the dollar index, which has an inverse correlation, is slowly growing, which has a negative impact on the euro.
Trading recommendations
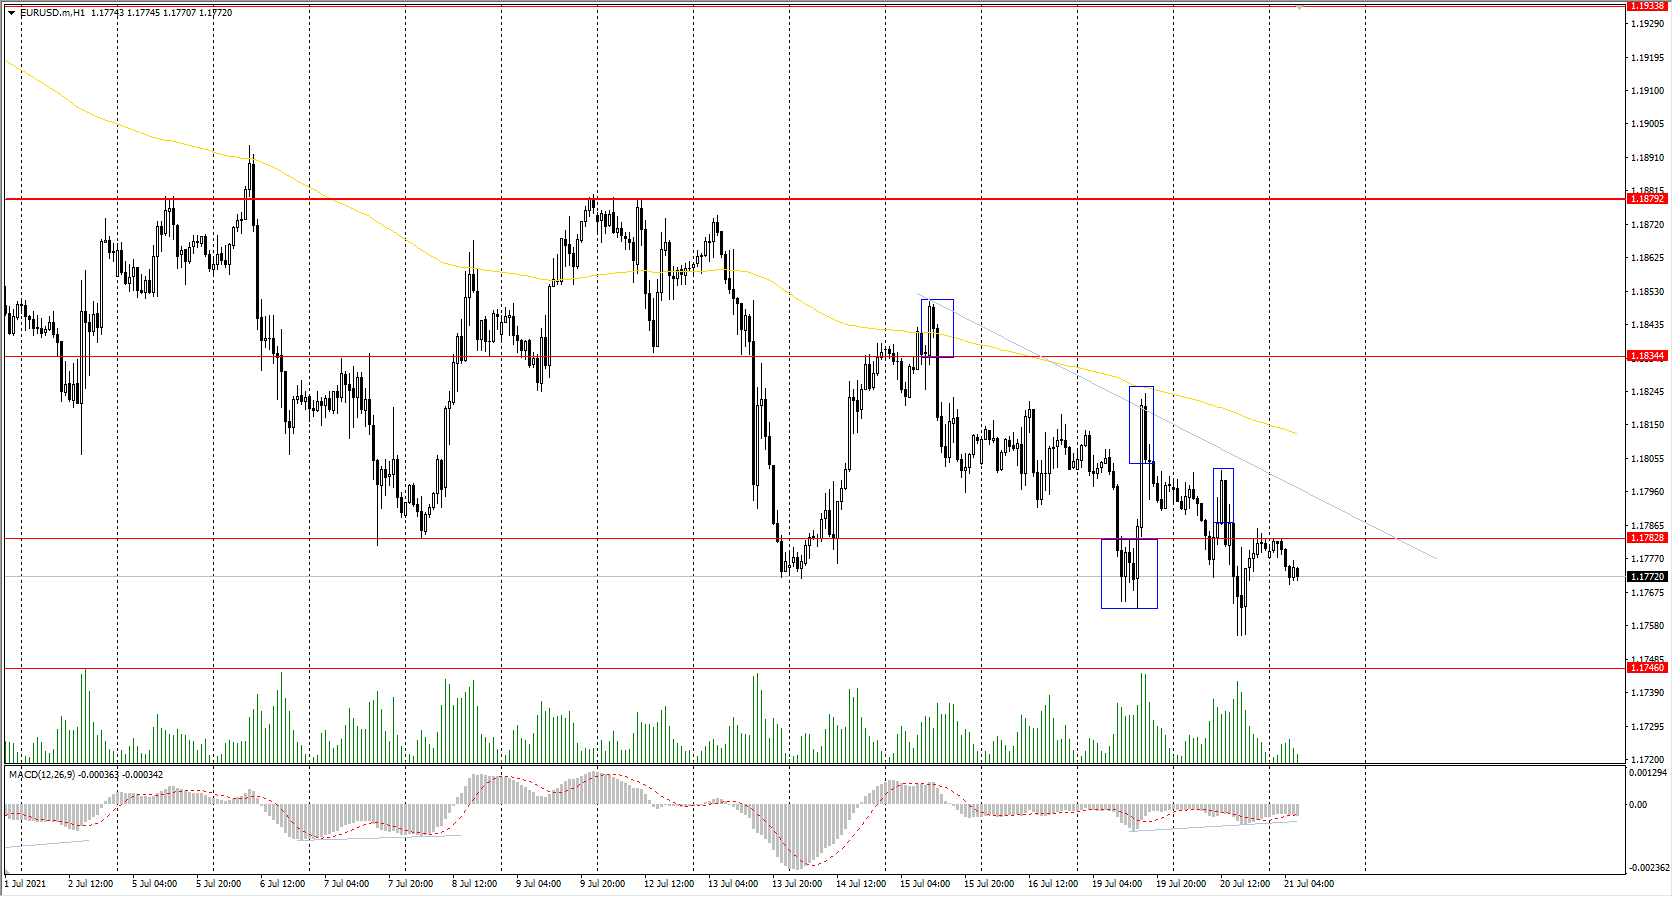
Support levels: 1.1746, 1.1609
Resistance levels: 1.1783, 1.1834, 1.1879, 1.1934, 1.1969
From the technical point of view, the trend is still bearish. But it should be noted that sellers' pressure gets weaker because each next downward break updates the price minimum very insignificantly. And that demonstrates the weakness of the sellers. On the other hand, there is no initiative from the buyers either. With a high probability, till the ECB meeting, which will take place tomorrow, the situation will remain unchanged. Under such market conditions, traders should look for intraday deals because there are no optimal entry points on the H1 timeframe right now.
Alternative scenario: if the price breaks through the 1.1879 resistance level and fixes above, the general uptrend is likely to be resumed.
The GBP/USD currency pair
Technical indicators of the currency pair:
Prev Open: 1.3773
Prev Close: 1.3628
% chg. over the last day: -1.06%
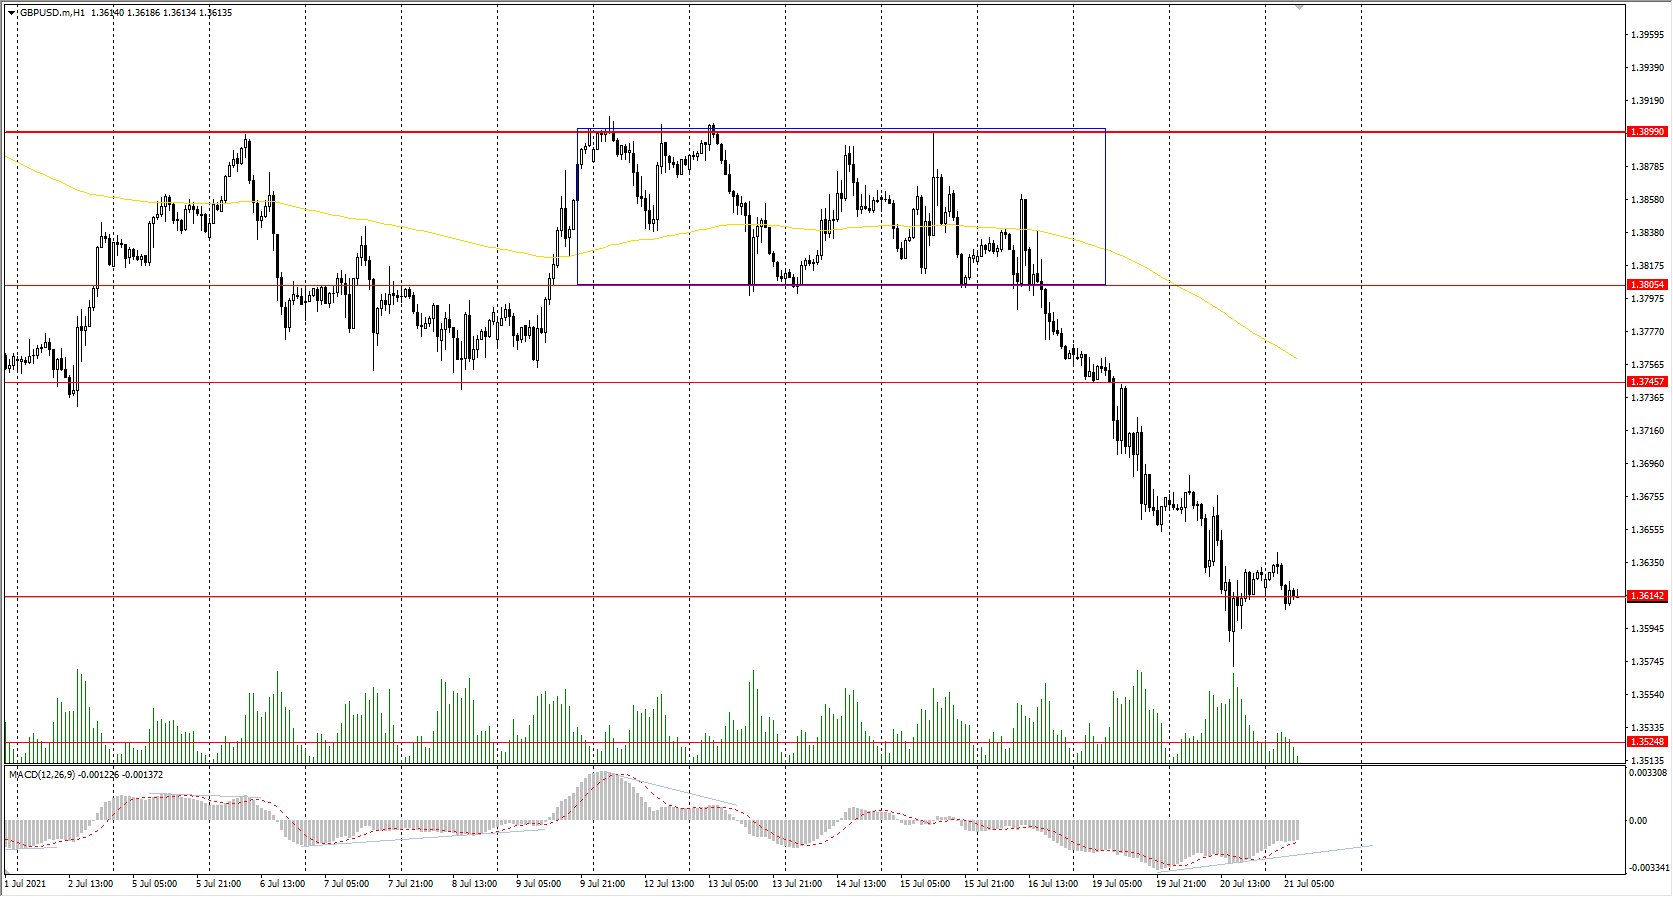
The British pound, unlike the euro, is falling steadily. The following factors put pressure on the GBP/USD quotes: 1) falling oil prices (the UK is the largest exporter of Brent oil), 2) there is an open issue of trade relations between the UK and the European Union, 3) increase in the number of disease cases after the lifting of restrictions. On the other hand, more than 52% of the UK adult population has already been fully vaccinated, with nearly 68% receiving the first dose of vaccine. The number of deaths decreased by almost 10 times. Considering the full opening of the economy, the prospects for economic growth in the country are huge, which will undoubtedly affect the strengthening of the course.
Trading recommendations
Support levels: 1.3614, 1.3525
Resistance levels: 1.3745, 1.3805, 1.3899, 1.3923, 1.4002, 1.4075, 1.4101
On the hour timeframe, the trend on the GBP/USD currency pair is strictly downward. The MACD indicator went into the negative zone, but there is a divergence on the H1 and H4 timeframes. Under such market conditions, traders are better to look for both sell deals from the resistance levels within the trend and buy deals from the support levels, but only on the intraday timeframes and with short targets.
Alternative scenario: if the price breaks through the 1.3899 resistance level and consolidates above, the bearish scenario is likely to be canceled.
The USD/JPY currency pair
Technical indicators of the currency pair:
Prev Open: 109.39
Prev Close: 109.85
% chg. over the last day: +0.42%
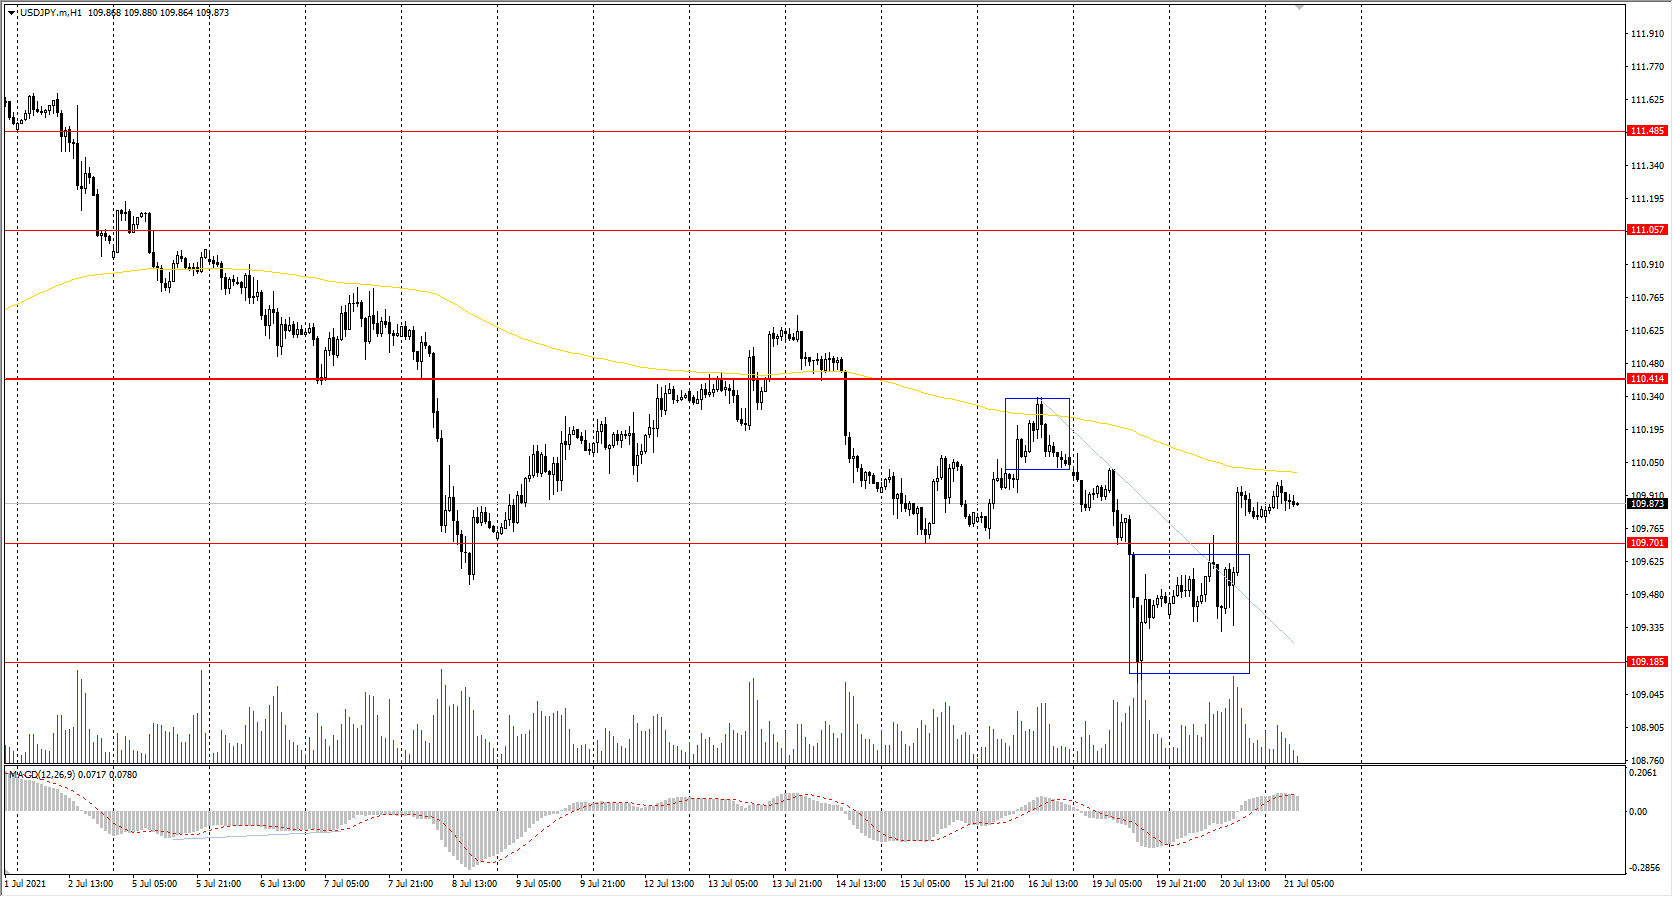
The USD/JPY currency pair began to show signs of reversal. Amid a slight strengthening of Tokyo's Nikkei 225 index, the futures on the Japanese yen slightly declined, which, together with the rise in the dollar index, led to an increase in the USD/JPY quotes. By the end of the week, the USD/JPY will correlate even more with the dollar index, as there will be a bank holiday in Japan.
Trading recommendations
Support levels: 109.70, 109.19, 108.65
Resistance levels: 110.41, 110.73, 111.06, 111.48, 110.73, 112.18
From the point of view of technical analysis, the situation has not changed. There is a downward trend on the H1 timeframe, as the price is still trading below the priority change level and the moving average. The MACD indicator has returned to the positive zone. Under such market conditions, traders should look for both selling from the resistance levels and buying from the support levels, but only with short targets.
Alternative scenario: if the price rises above 110.41, the uptrend is likely to be resumed.
The USD/CAD currency pair
Technical indicators of the currency pair:
Prev Open: 1.2740
Prev Close: 1.2679
% chg. over the last day: -0.48%
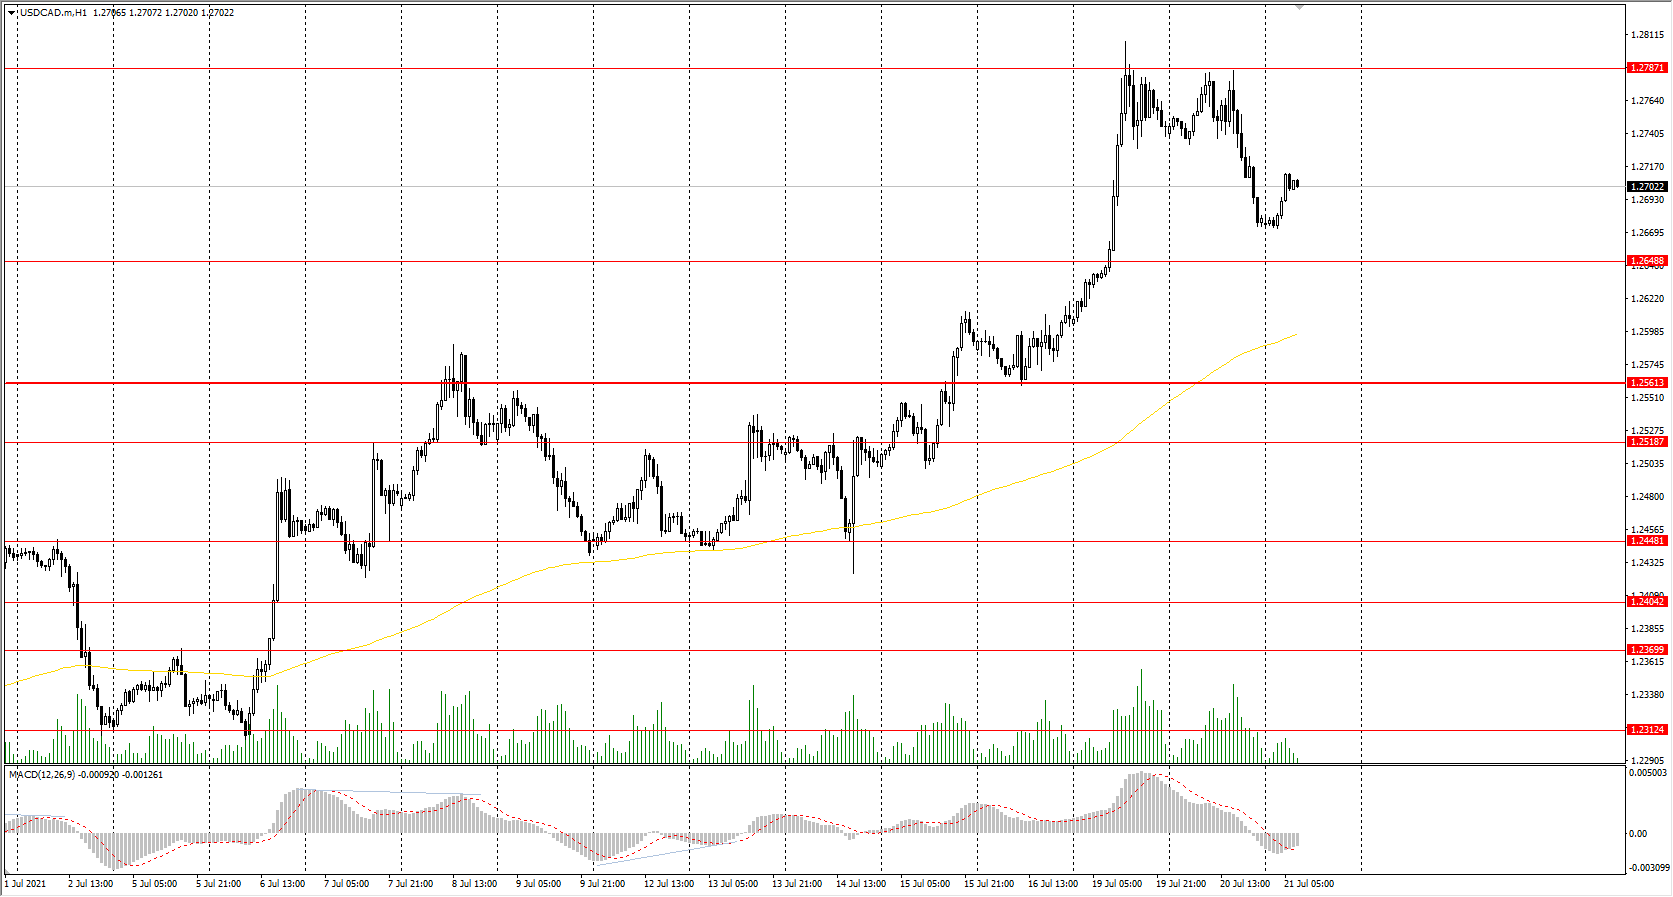
Yesterday, the USD/CAD currency pair slightly corrected after a 4-day rally. There is a large inverse correlation observed between oil and USD/CAD, and it is not surprising since the Canadian dollar is a commodity currency. The US crude oil inventories data will be released today. An increase in oil prices will have a positive effect on the Canadian futures while the USD/CAD will decrease. Conversely, a drop in oil prices will continue the upward trend in the USD/CAD.
Trading recommendations
Support levels: 1.2649, 1.2561, 1.2519, 1.2448, 1.2404, 1.2347, 1.2312
Resistance levels: 1.2787, 1,2951
Technically, the trend remains bullish. The sellers finally showed initiative at the 1.2787 resistance level. The MACD indicator has become inactive. Under such market conditions, it is better to trade intraday. Buy positions should be looked for at the nearest support levels, but it is better to buy when there is a confirmation. There are no optimal entry points for sell positions right now.
Alternative scenario: if the price breaks through the 1.2561 support level and fixes below, the downtrend is likely to be resumed.
Optimism From Investors Returned To Financial Makrets, But The Situation Still Remains Uncertain
The US stock indices closed in the green zone yesterday. All three indices increased steadily at the end of the day. The biggest gain was shown by Dow Jones, which increased by 1.62%. The S&P 500 added 1.52% and the Nasdaq increased by 1.57%. Optimism has returned to the markets a little, but the situation is still uncertain. On the one hand, many economies are showing good signs of recovery. On the other hand, a new wave of coronavirus could slow these growth rates and lead to new lockdowns. In the meantime, investors are looking for profitable opportunities in stock markets, as there are practically no investment alternatives today. As long as the Fed's monetary policy remains unchanged, indices will continue to rise. But in August, there will be a new meeting of the Fed, and traders should be very careful, because firstly, the Fed is going to cut the QE program, and secondly, August and September are statistically very weak months for the indices.
The European stock market ended Tuesday's trading on the positive side, despite the rise in the Delta strain cases in Europe. Yesterday, the spokesperson of the French government, Gabriel Attal, said that it’s the fourth wave of the COVID-19 pandemic in their country. The UK government lifted all domestic restrictions related to the coronavirus starting from Monday. The UK Prime Minister Boris Johnson said that he intends to require nightclubs and event organizers in England to allow only fully vaccinated visitors in from the end of September.
The American Petroleum Institute (API) data, published on Tuesday, indicated an increase in crude oil stocks by 806,000 barrels in the US over the previous week. This is another reason why oil quotes started to decline, and supply started to catch up with demand. Japan, which is the world's 4th largest importer of oil, cut oil imports by 1.2% in annualized terms. The US crude oil weekly inventories data will be released today. Increased reserves can lead to a further decrease in oil quotes.
The price of gold and silver is highly correlated (inverse correlation) with the US Treasury bond yields. Yesterday, government bond yields increased in price, which caused the fall of gold. But the current US monetary policy has a negative effect on the government bond yields. That's the reason why investors are confident that the prices for precious metals will continue to rise, at least until the Fed meeting in August.
Yesterday, the deputy governor of the Bank of Japan said that the economy might grow faster than expected if the coronavirus vaccination accelerates. But the current situation in Tokyo, which is hosting the Olympics, shows that the number of infection cases has increased, forcing the government to declare a state of emergency in the city and impose new restrictions. On the other hand, Japan's exports have been increasing for four months in a row. The shipment of transport equipment abroad increased by 68.1%. The export of semiconductor components increased by 24.7%, machinery - by 42%, steel and steel products - by 73%. This indicates a gradual recovery in global trade.
Main market quotes:
- S&P 500 (F) 4,323.06 +64.57 (+1.52%)
- Dow Jones 34,511.99 +549.95 (+1.62%)
- DAX 15,216.27 +83.07 (+0.55%)
- FTSE 100 6,881.13 +36.74 (+0.54%)
- USD Index 92.96 +0.07 (+0.08%)
Important events for today:
- Japan Monetary Policy Meeting Minutes at 02:50 (GMT+3);
- Australia Retail Sales (m/m) at 04:30 (GMT+3);
- US Crude Oil Inventories (w/w) at 17:30 (GMT+3).
Dollar Breaks The Bullish Trend Of The Markets
S&P500 gained 1.5% on Tuesday after global markets found a support level. Positive vibrations continue to spread across on Wednesday morning, causing the growth of European indices.
However, from the dynamics of the major currencies, it more and more seems that the peak of the bullish trend has already been passed. For now, cautious purchases on the downturns remain, but the methodical growth of the dollar indicates that yesterday's calm is just a small respite in the framework of a wide curtailment of risk positions.
The dollar index exceeded 93, overcame the resistance of the converging range, and get closer to the area of this year's highs that we saw four months ago. This speaks of a technical breakdown, however, to confirm it, we should wait for an increase above the maximum values in March at 93.4.
In the largest currency pairs' dynamics, the growth of the dollar prevails, which, together with the fall in the yield of US debt securities, indicates a broad craving for defensive assets.
On the EURUSD chart, methodical selling on intraday growth is clearly visible, and the general downtrend was formed in early June. Worse, there is a death cross hanging over the pair as the 50-day moving average falls below the 200-day. And that will happen in the coming days, which, as a rule, sharply intensifies the sale.
GBPUSD was below 1.3600 in the morning, having fallen below the support line at 1.3700 and its 200-day moving average earlier this week. The pound is often directly correlated with the stock market, so the current trend is in favor of a recovery in sales.
AUDUSD is also in the grip of bears, having pulled back to 0.7300, the lowest since last November. The Chinese yuan stands out from this trend, gaining strength against the dollar for the second day in a row. Selling USDCNH began to intensify as it approached the 200-day moving average.
As we have seen many times, the stock market can go up by inertia, but very often it joins the dynamics of debt and currency markets.
Gold develops a decline after failing to break the 200-day moving average. Silver ended a long period of consolidation, plummeting to $25. It seems that speculators in the precious metals market maintain a bearish mood, which can spread to gold very quickly.
Oil Price Broke The Key $70.00 Support Level To Move Into A Bearish Zone
Crude oil price started a major downward move from well above the $74.00 level against the US Dollar. The price broke the key $70.00 support level to move into a bearish zone.
The price even broke the $68.00 support zone and it settled below the 50 hourly simple moving average. It traded as low as $64.95 and it is now consolidating losses. An initial resistance on the upside is near the $66.80 level.
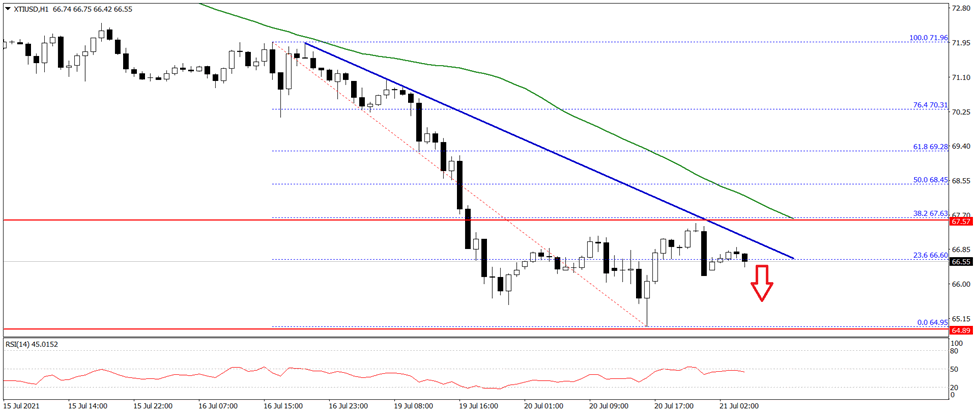
There is also a major bearish trend line with resistance near $66.85 level on the hourly chart. A clear break above the $68.80 and $68.85 levels could start a fresh increase in the near term.
On the downside, an initial support is near the $66.00 level. The first major support is near the $65.20 on FXOpen, below which there is a risk of more losses. In this case, the price could even test $62.00 in the near term.