Sample Category Title
EUR/JPY Daily Outlook
Daily Pivots: (S1) 128.86; (P) 129.18; (R1) 129.75; More....
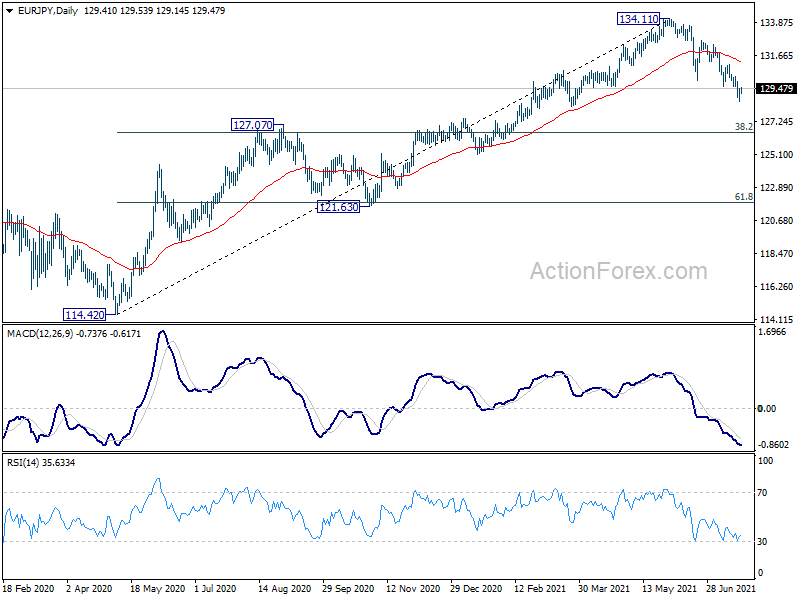
Intraday bias in EUR/JPY is turned neutral as it recovers after hitting 128.58. Some consolidations could be seen first. but further decline is expected as long as 131.07 resistance holds. Break of 128.58 will resume the fall from 134.11. Such decline is seen as correcting whole up trend from 114.42. Deeper fall would be seen to 127.07 resistance turned support next.
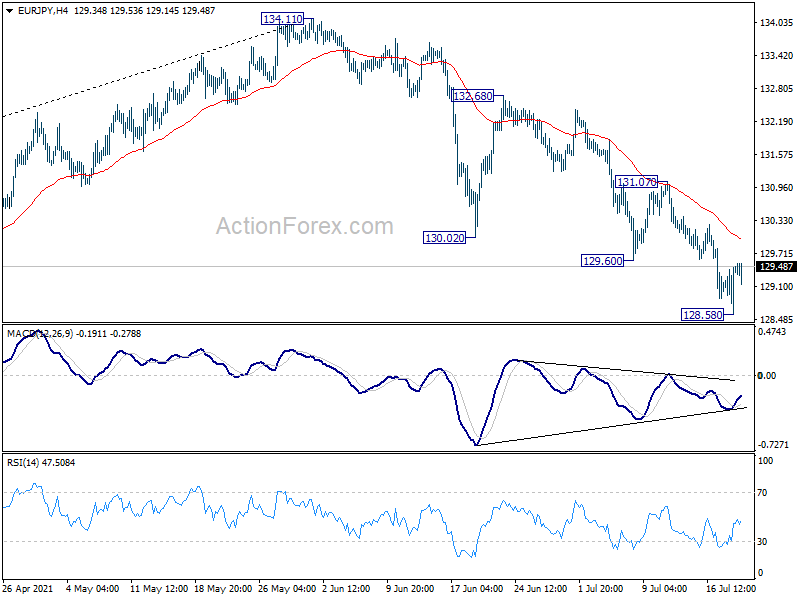
In the bigger picture, rise from 114.42 is seen as a medium term rising leg inside a long term sideway pattern. As long as 127.07 resistance turned support holds, further rise is still expected to retest 137.49 (2018 high) However, firm break of 127.07 will argue that the medium term trend has reversed, and open up the case for retesting 114.42.
EUR/GBP Daily Outlook
Daily Pivots: (S1) 0.8620; (P) 0.8645; (R1) 0.8670; More...
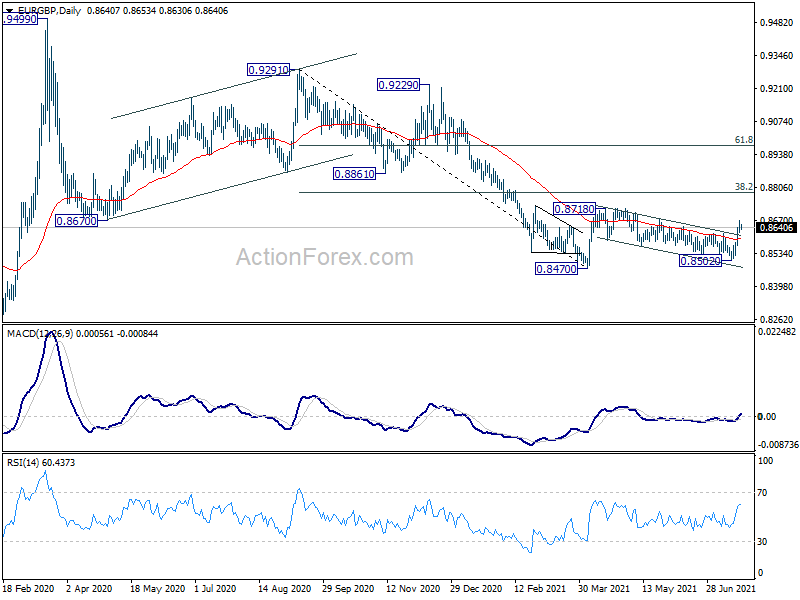
Intraday bias in EUR/GBP stays on the upside for the moment. Firm break of 0.8670 resistance will affirm the case that whole rebound from 0.8470 is resuming through 0.8718 resistance. On the downside, though, break of 0.8614 minor support will turn intraday bias neutral again first.
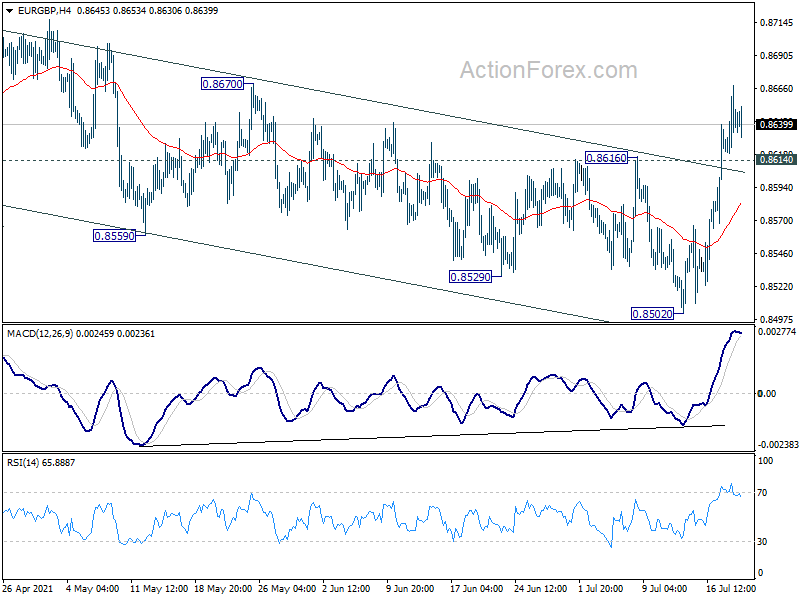
In the bigger picture, price actions from 0.9499 are still seen as developing into a corrective pattern. That is, up trend from 0.6935 (2015 low) would resume at a later stage. This will remain the favored case as long as 0.8276 support holds. However, firm break of 0.8276 support will suggest that rise from 0.6935 has completed and turn medium term outlook bearish.
AUD/USD Outlook: Aussie Falls To 8-Month Low
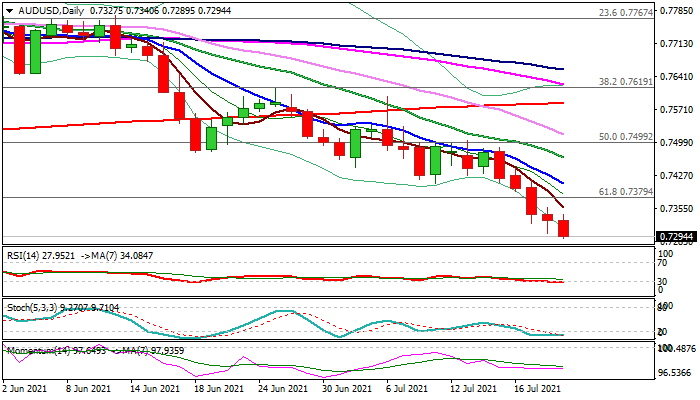
The Australian dollar dipped below 0.73 support in early European trading on Wednesday, extending steep fall into the fifth straight day, pressured by rising US dollar.
A much stronger than expected drop in Australia’s June retail sales, caused by new lockdowns, contributed to Aussie’s weakness.
Bears eye target at 0.7231 (200WMA/Fibo 76.4% of 0.6991/0.800 upleg), violation of which would add to negative stance.
Daily moving averages are in full bearish setup and rising negative momentum points to a continuation of the downtrend, but oversold conditions generate an initial signal that bears may run out of steam soon.
Upticks are expected to offer better selling opportunities as long as falling 10DMA (0.7409) caps, while break here would ease bearish pressure and signal stronger correction.
Res: 0.7340, 0.7389, 0.7409, 0.7444.
Sup: 0.7231, 0.7204, 0.7158, 0.7115.
EUR/AUD Daily Outlook
Daily Pivots: (S1) 1.6039; (P) 1.6076; (R1) 1.6111; More...
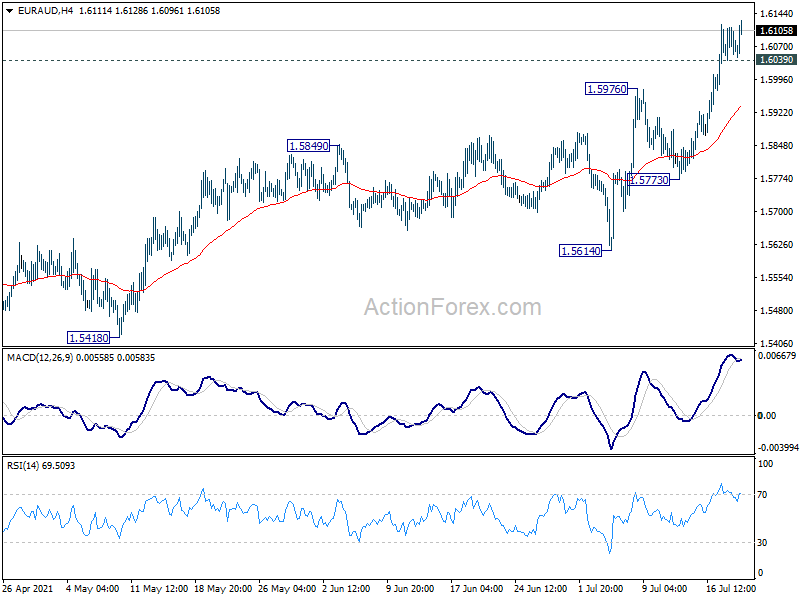
Intraday bias in EUR/AUD remains on the for moment. Current rise from 1.5250 is at least correcting the whole fall from 1.9799. Further rise should be seen to 1.6827 resistance next. On the downside, below 1.6039 minor support will turn intraday bias neutral first. But further rise is expected as long as 1.5773 support holds, in case of retreat.
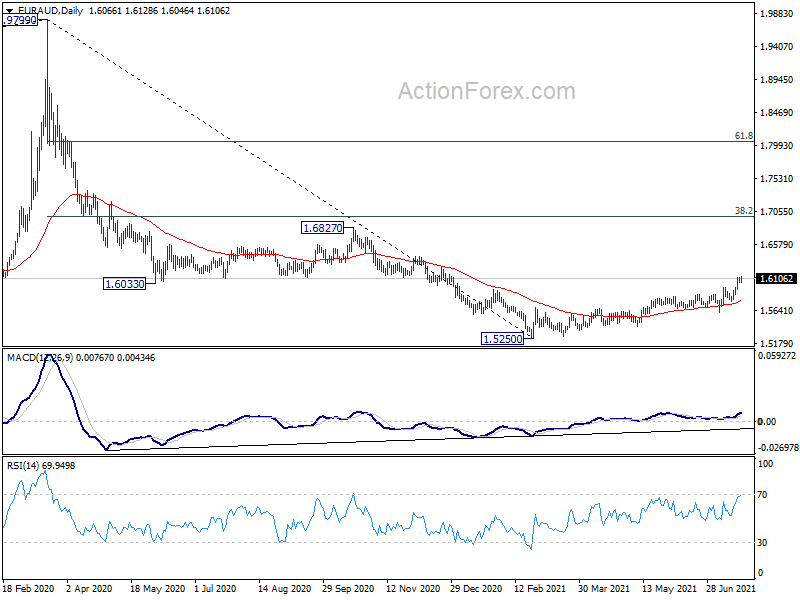
In the bigger picture, outlook stays bearish with 1.6033 support turned resistance intact for now. Fall from 1.9799, as a correction to to long term up trend from 1.1602 (2012 low) is still in favor to resume through 1.5250 later. However, firm break of 1.6033 will argue that such decline has completed. Stronger rebound would then be seen 38.2% retracement of 1.9799 to 1.5250 at 1.6988.
EUR/CHF Daily Outlook
Daily Pivots: (S1) 1.0831; (P) 1.0845; (R1) 1.0867; More....
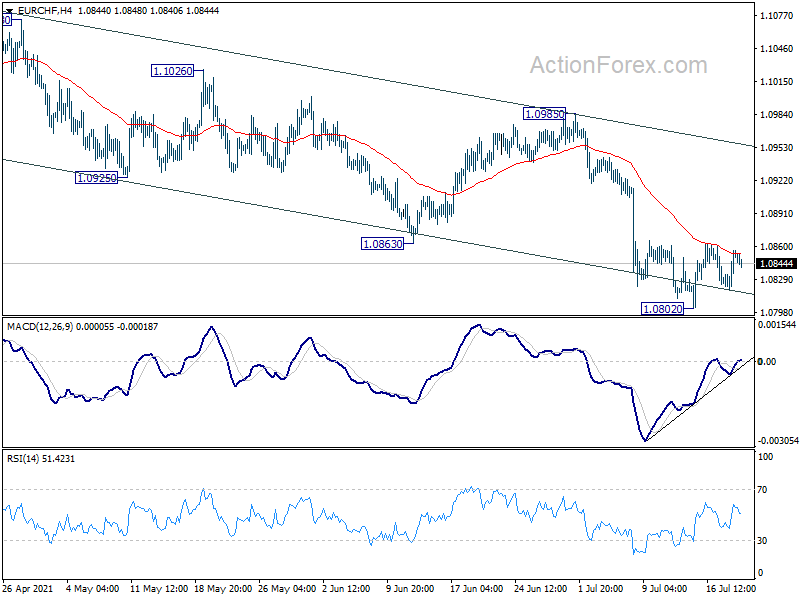
Intraday bias in EUR/CHF remains neutral and consolidation form 1.0802 is still extending. Outlook remains bearish as long as 1.0985 resistance intact. On the downside, break of 1.0802 will resume the decline from 1.1149, to 1.0737 cluster support next.
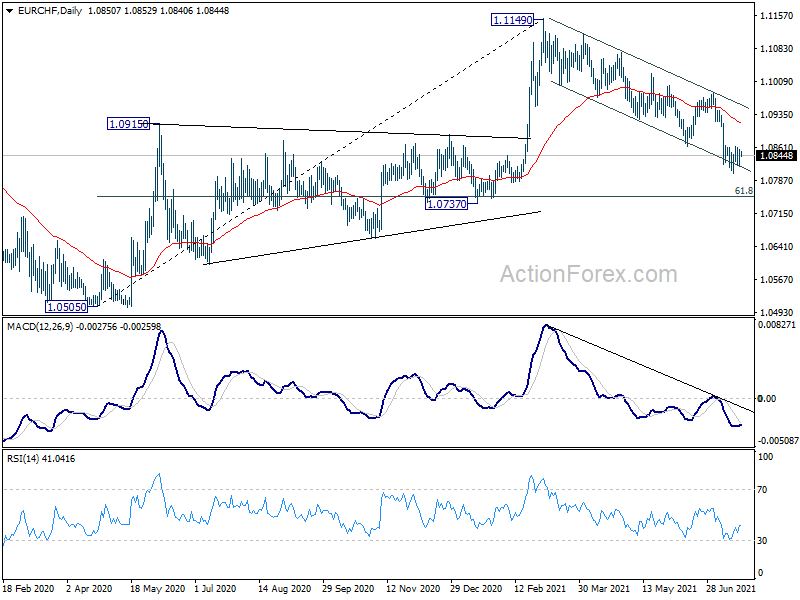
In the bigger picture, current development argues that rebound from 1.0505 (2020 low) might be completed with three waves up to 1.1149 already. Sustained trading below 55 week EMA (now at 1.0882) will affirm this bearish case. Further break of 1.0737 cluster support (61.8% retracement of 1.0505 to 1.1149 at 1.0751) will bring retest of 1.0505 low.
XRPUSD Neutral Bias
Technical analysis
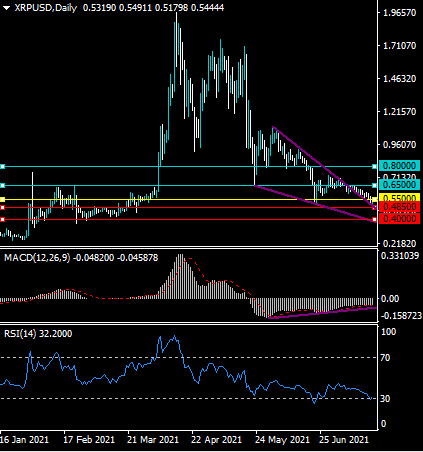
The daily time frame shows that the XRPUSD pair continues to maintain a bullish breakout from a falling wedge pattern, despite suffering heavy weekly losses.
The MACD on the daily time frame continues to show significant amounts of bullish price divergence. The RSI indicator on the mentioned time frame has just formed a bullish double-pattern.
What the possible outcomes are
In our most likely scenario, the XRPUSD pair will start to stabilize above the 0.5500 resistance level as a meaningful recovery from the current weekly low starts to gather momentum.
Alternatively, the XRPUSD pair will continue its create bearish lower lows on the daily time frame, and eventually fall back towards the 0.4850 support level over the coming trading sessions.
Key levels
Support 0.5500 0.6500
Resistance 0.4850 0.4000
BTCUSD Bullish Bias
Technical analysis
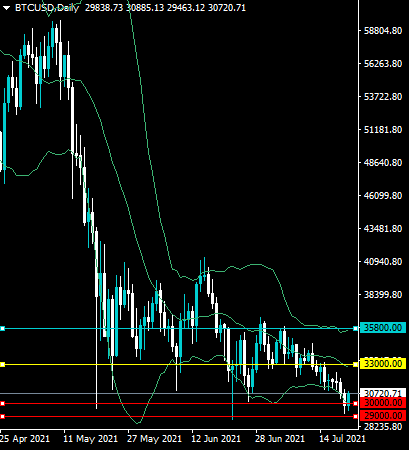
BTCUSD has recovered above its lower Bollinger Band on the daily time frame. If this continues bulls could rally the BTCUSD pair towards the mid-line of even the upper daily Bollinger Band.
Sellers were repeatedly unable to break the $29,000 support level this week. This is bullish because it means that the BTCUSD pair has stopped forming new monthly trading lows.
What the possible outcomes are
In our most likely scenario, the BTCUSD pair will eventually recover back towards the $33,000 resistance level or the mid-line of the Bollinger Band indicator on the daily time frame.
Alternatively, the BTCUSD could reverse back towards the $29,000 support level and perform yet another key technical test of the June monthly trading low.
Key levels
Support $30,000 $29,000
Resistance $33,000 $35,800
NZDUSD Forms A Bearish Move Near 8-Month Low
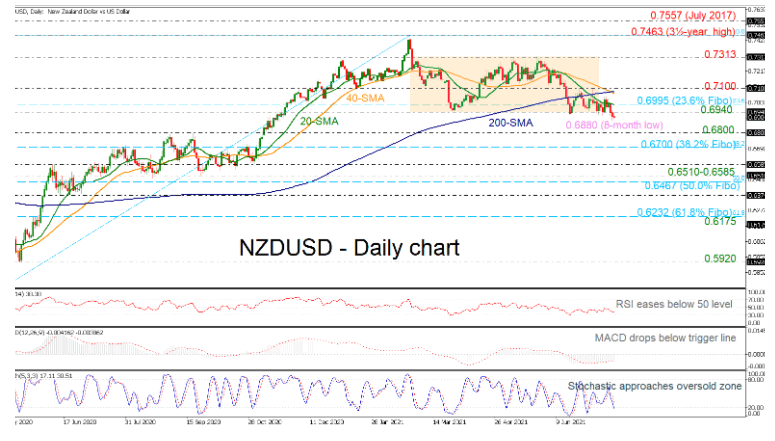
NZDUSD plummeted to a fresh eight-month low at 0.6880 on Tuesday, breaking below the sideways channel that had been holding since February 26. The 40-day simple moving average (SMA) crossed the 200-day SMA to the downside, indicating more losses in the near term. The RSI and the MACD are slipping in the negative territories and the stochastic oscillator is entering the oversold zone.
More downside moves could take the market towards the 0.6800 psychological number ahead of the 38.2% Fibonacci retracement level of the up leg from 0.5970 to 0.7463 at 0.6700. Even lower, the market could touch the 38.2% Fibonacci of 0.6700 and the 0.6510-0.6585 zone.
Alternatively, a climb above the 0.6940 support and the 23.6% Fibonacci at 0.6995 could hit the 0.7100 handle. Overcoming this obstacle and the SMAs could move the price action until 0.7313. Above this, the three-and-a-half-year high of 0.7463 could halt the bullish move.
To sum up, NZDUSD is creating a negative tendency in the short-term and in a longer-term timeframe, the pair is creating a neutral-to-bearish move.
EURCHF Aims For A Rebound As Bearish Trend Jitters Strengthen
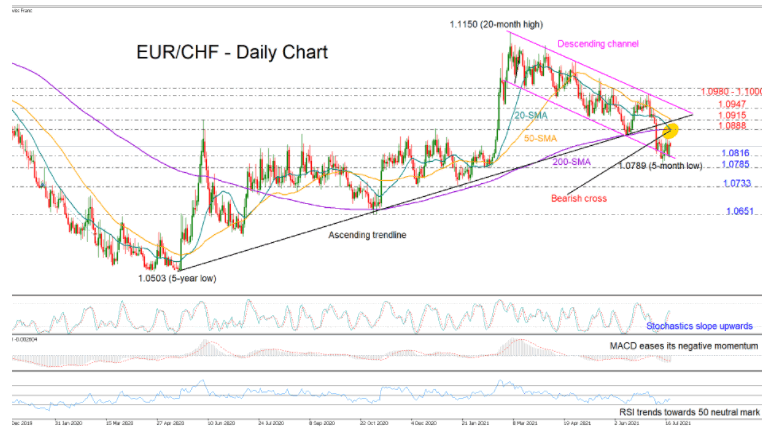
EURCHF paused again around the bottom of the four-month-old descending channel following the slump below the long-term supportive trendline and the dip towards a five-month low of 1.0789.
The ongoing consolidation could precede another upside reversal and the positive charge in the RSI and the Stochastics, which are deviating above their oversold levels, is endorsing that bullish scenario.
The bearish part of the story, however, is that the plunge below the trendline and the progressing negative cross between the 20- and 200-day simple moving averages (SMAs) foresee further deterioration in the short-term downward pattern.
A clear close below 1.0816 could raise negative risks in the market, likely bringing the 1.0785 support area next into view. Another extension lower may head for the 1.0733 region, which has been a major base to upside movements. Breaching that floor, the price may slide to meet the October low of 1.0651.
Should the bulls take control, traders will be looking for a break above the 1.0888 – 1.0915 zone before they target the channel’s upper line seen at 1.0947. Beyond that, the pair may push towards the 1.0980 – 1.1000 with scope to reverse the downtrend.
Summarizing, EURCHF is setting the stage for an upside correction, though the strengthening bearish trend signals reduce the case for a major improvement.
USD/CAD Daily Outlook
Daily Pivots: (S1) 1.2640; (P) 1.2713; (R1) 1.2752; More...
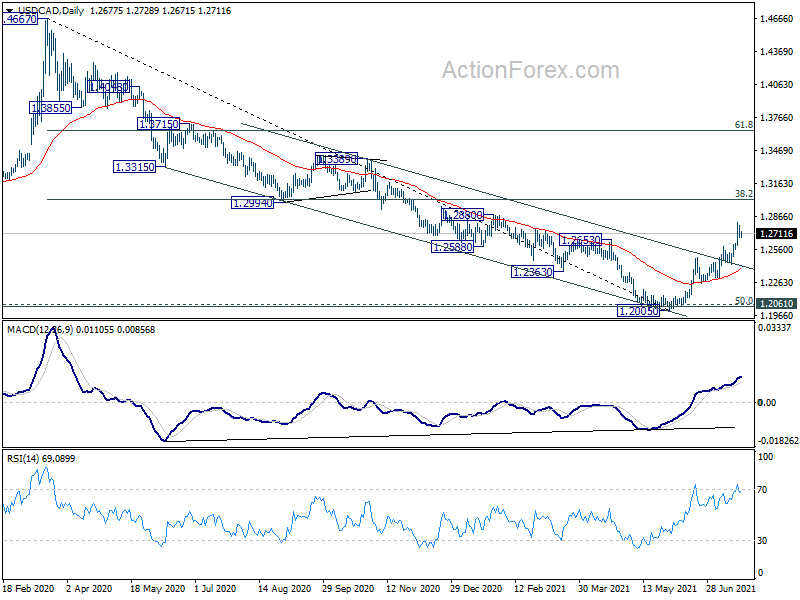
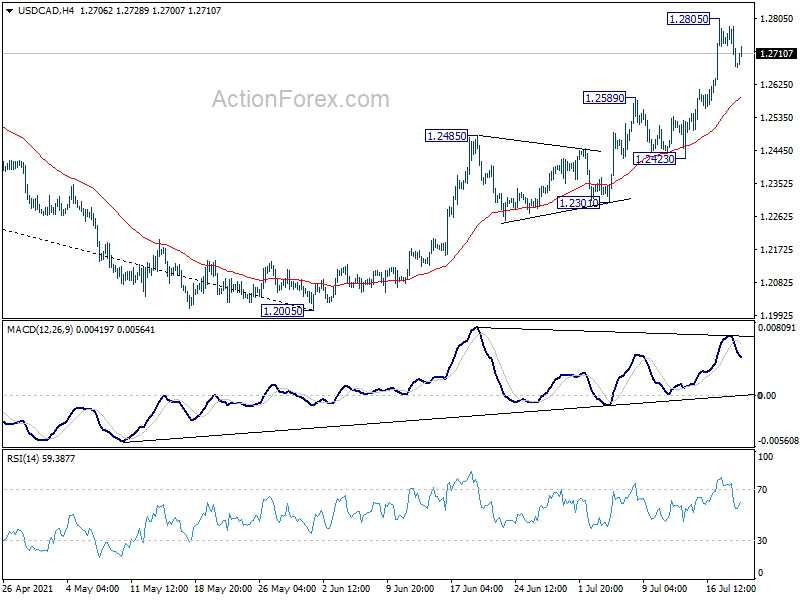
Intraday bias in USD/CAD is turned neutral as it retreated after hitting 1.2805. Some consolidations could be seen but further rise is expected as long as 1.2485 resistance turned support holds. On the upside, above 1.2805 will resume the rise from 1.2005 to 1.3022 medium term fibonacci level next.
In the bigger picture, fall from 1.4667 is seen as the third leg of the corrective pattern from 1.4689 (2016 high). It should have completed after hitting 1.2061 (2017 low) and 50% retracement of 0.9406 to 1.4689 at 1.2048. Sustained break of 38.2% retracement of 1.4667 to 1.2005 at 1.3022 will pave the way to 61.8% retracement at 1.3650 and above. Overall, medium term outlook remains neutral at worst with 1.2048/61 support zone intact.