Sample Category Title
GBP/JPY Analysis: Potential Target At 150.50
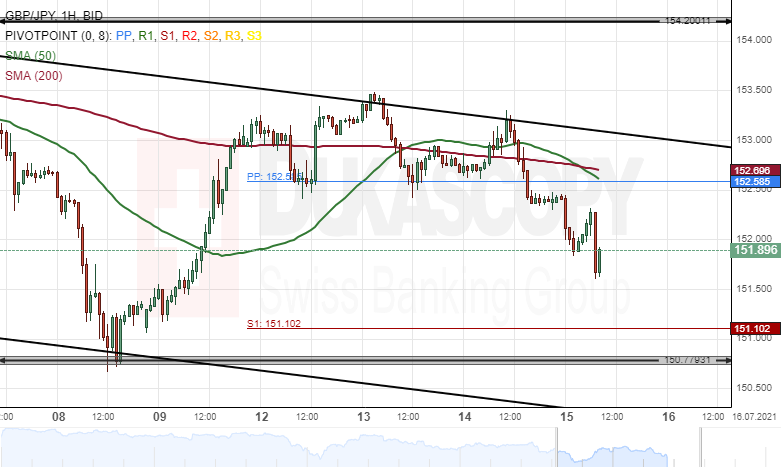
The British Pound plunged by 92 pips or 0.60% against the Japanese Yen on Wednesday. The currency pair breached the 50– and 200– hour SMAs during Wednesday's trading session.
Everything being equal, the exchange rate could continue to trend lower during the following trading session. The potential target for the GBP/JPY pair will be near the 150.50 area.
However, the weekly support level at 151.10 might provide support for the currency exchange rate within this session.
AUD/USD Analysis: Remains Near 200– Hour SMA
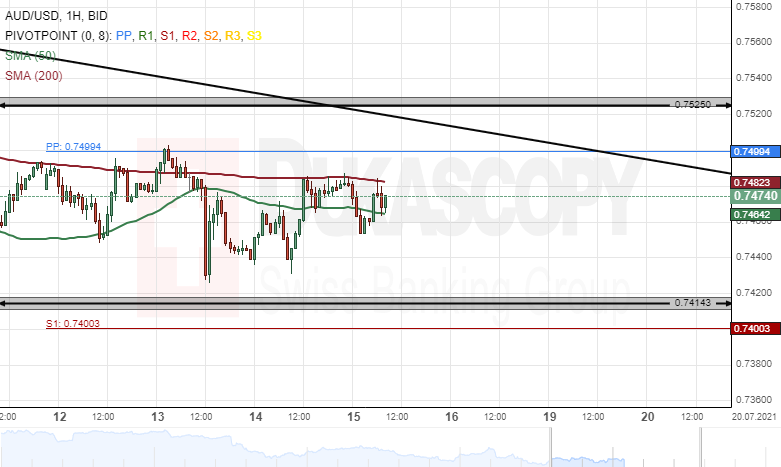
The Australian Dollar grew by 46 pips or 0.61% against the US Dollar on Wednesday. The surge was stopped by the 200– hour simple moving average at 0.7483 during Wednesday's trading session.
As for the near future, the AUD/USD currency pair could continue to edge higher. Bullish traders might target the upper line of a descending channel pattern at 0.7520 within this session.
However, a resistance level formed by the 200– hour SMA at 0.7483 could still provide a barrier for the currency exchange rate during the following trading hours.
EUR/JPY Analysis: Decline Likely To Continue
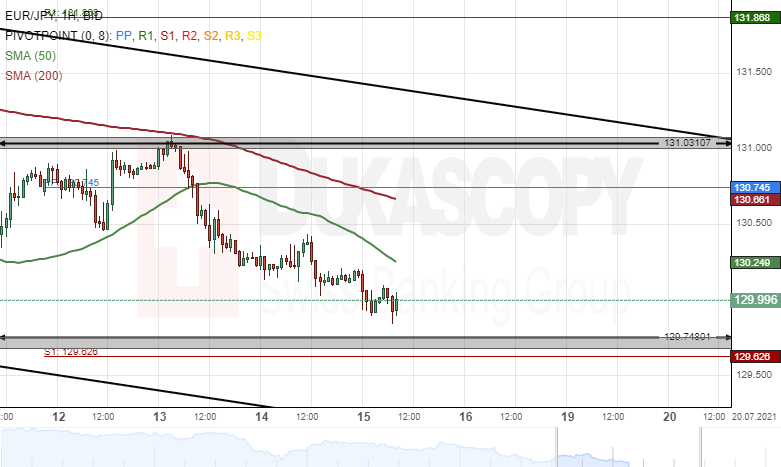
The common European currency declined by 47 pips or 0.36% against the Japanese Yen on Wednesday. The currency pair breached the 130.00 level during Wednesday's trading session.
All things being equal, the exchange rate is likely to continue to trend bearish during the following trading session. The potential target for the EUR/JPY pair will be near the 129.30 area.
However, the weekly support level at 129.62 could provide support for the currency exchange rate in the shorter term.
EURUSD Hovers In Declining Channel With Flat Momentum
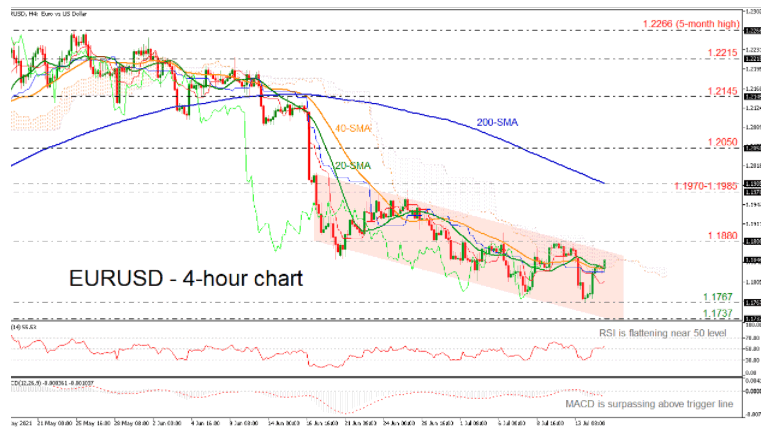
EURUSD has been travelling in a downward sloping channel since June 17, standing around the 20- and 40-period simple moving averages (SMAs). The RSI is moving horizontally around its mid-level; however, the MACD is still developing above its trigger line in the negative region.
Following a successful decline below the SMAs, the 1.1767 barrier could provide immediate support before meeting the lower surface of the declining channel at 1.1737. Further down, the five-month low of 1.1700 could serve as a strong support for the bearish pattern.
An advance over the Ichimoku cloud's upper surface, on the other hand, could reach the 1.1880 resistance before settling at the 1.1970-1.1985 resistance.
Concluding, EURUSD is in a bearish structure and any declines below 1.1700 could take the market into steeper negative moves. However, a jump above 1.1880 could switch the outlook to neutral.
WTI Futures Recoil Below Ichimoku Lines
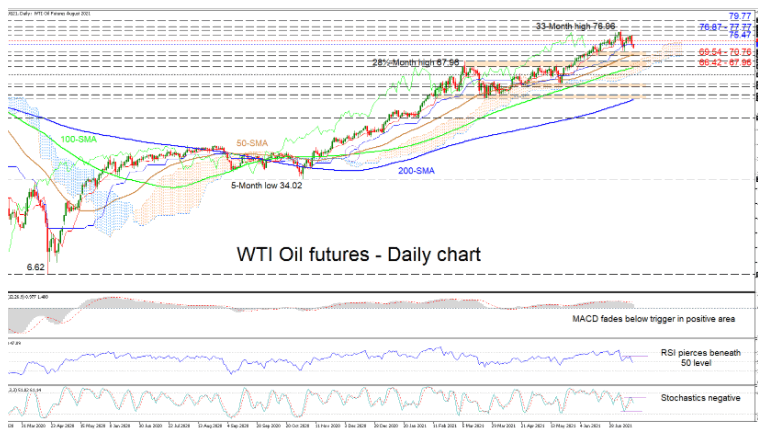
WTI oil futures’ upside momentum is looking feeble as the price of the commodity retreated beneath the Ichimoku lines for a second time, ever since logging a 33-month peak just shy of the 77.00 handle. That said, the steadily advancing simple moving averages (SMAs) are defending the broader uptrend, while the flattening Ichimoku lines are indicating dwindling in the price's bullish drive.
The short-term oscillators are suggesting negative momentum is gaining pace. The MACD, in the position zone, is deviating further below its red trigger line, while the diving RSI has plunged into bearish territory. Moreover, the stochastic oscillator has recently regained a negative charge and is endorsing a rise in downside price pressures.
If sellers remain in the driver’s seat, they could swiftly encounter a support base constructed between the July 8 trough of 70.76 and the June 17 low of 69.54, an area which also encapsulates the 50-day SMA. Should bearish forces continue to grow, the bears may then face the challenging border of 66.42-67.96, which overlaps with the Ichimoku cloud and is receiving reinforcements from the 100-day SMA lingering just beneath.
Otherwise, if buyers find traction off the 69.54-70.76 area, initial upside constraints could develop in the vicinity of the Ichimoku lines at 72.79 and 73.83 respectively. Exceeding these averages, the price may then meet the 75.47 high, while any overshoot of this level could inspire buyers to pilot for the 76.87-77.77 resistance section that also contains the multi-year peak of 76.96. In the event WTI futures remain buoyant, the price may hurl towards the 79.77 border, observed in November 2014.
Summarizing, WTI futures' bigger picture remains relatively bullish above the SMAs and the 61.54 trough. That said, the near-term snapshot signals waning in positive impetus and a breach of the nearby support foundation of 69.54-70.76, could impair the positive outlook.
AUDUSD Tries To Gain Ground In Near Term
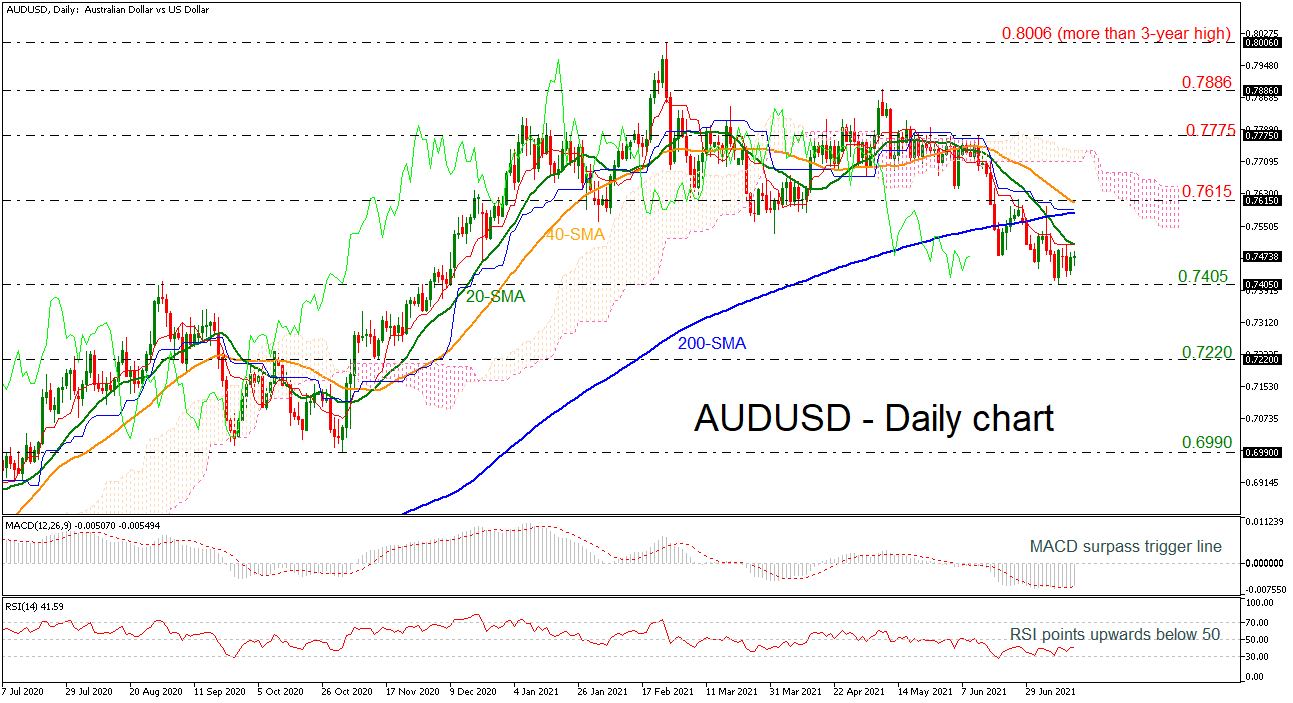
AUDUSD is battling the 20-day simple moving average (SMA) to create more gains, though the price is still holding above the 0.7405 support level. The RSI indicator is pointing upwards in the negative territory, while the MACD is surpassing its trigger line in the bearish zone. However, the pair is hovering well below the Ichimoku cloud and the red Tenkan-sen and blue Kijun-sen lines.
If the price overcomes the 20-day SMA, immediate resistance could come from the 200-day SMA at 0.7585 ahead of the 0.7615 resistance, which overlaps with the 40-day SMA. Breaking these lines, the 0.7775 barrier may pause the upside structure as it was acting as significant resistance in the previous sessions.
In the negative scenario, a move beneath 0.7405 could drive the market price until the next support at 0.7220, registered in November 2020. Steeper declines could open the way for a rest around 0.6990, achieved in November 2020 as well.
Summarizing, AUDUSD has been in a declining mode over the last two months, despite that in the last couple of days it has been trying to move higher.
GBP/JPY Daily Outlook
Daily Pivots: (S1) 152.07; (P) 152.68; (R1) 153.03; More...
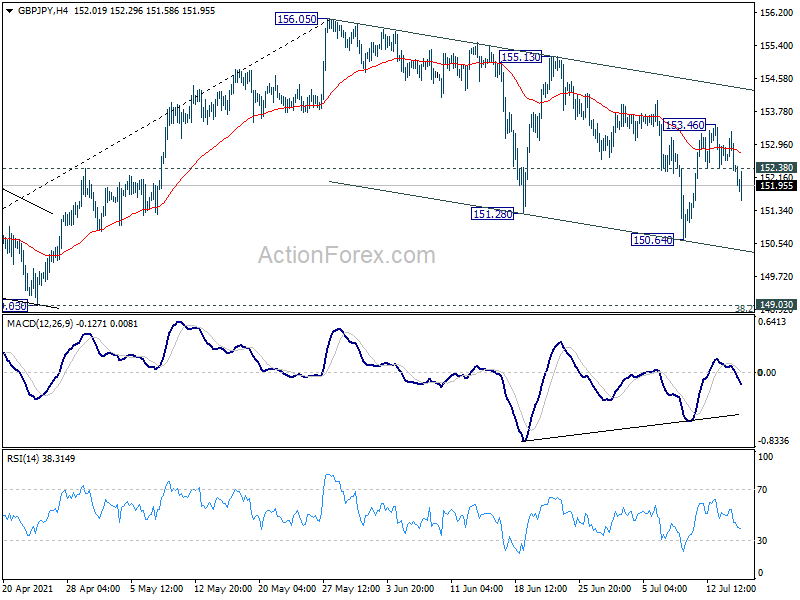
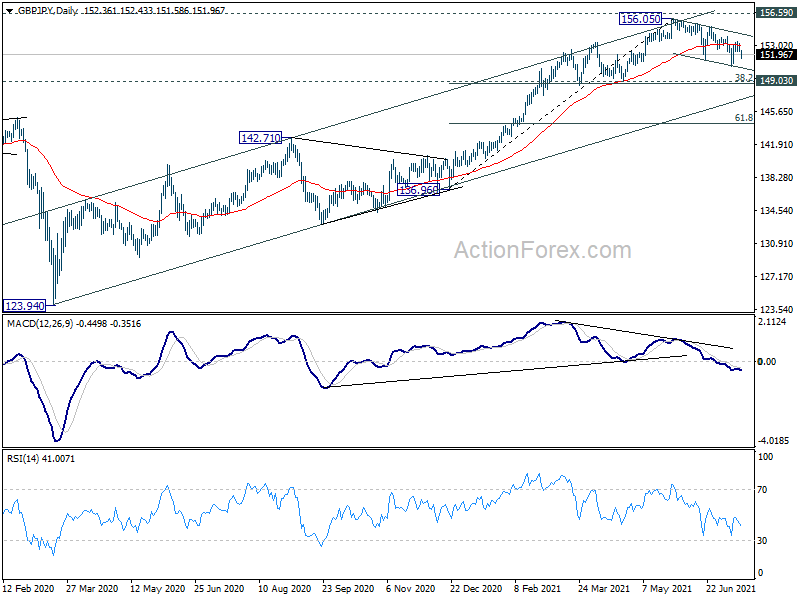
Intraday bias in GBP/JPY is turned neutral again with break of 152.38 minor support. Correction from 156.05 could still extend lower. Break of 150.64 will target 149.03 cluster support level. On the upside, break of 153.46 will turn bias back to the upside for 155.13/156.05 resistance zone.
In the bigger picture, rise from 123.94 is seen as the third leg of the pattern from 122.75 (2016 low). Focus remains on 156.59 resistance (2018 high). Sustained break there should confirm long term bullish trend reversal. Next target is 61.8% retracement of 195.86 (2015 high) to 122.75 at 167.93. On the downside, break of 149.03 support is needed to be the first sign of completion of the rise from 123.94. Otherwise, outlook will remain bullish even in case of deep pull back.
EUR/JPY Daily Outlook
Daily Pivots: (S1) 129.96; (P) 130.20; (R1) 130.37; More....
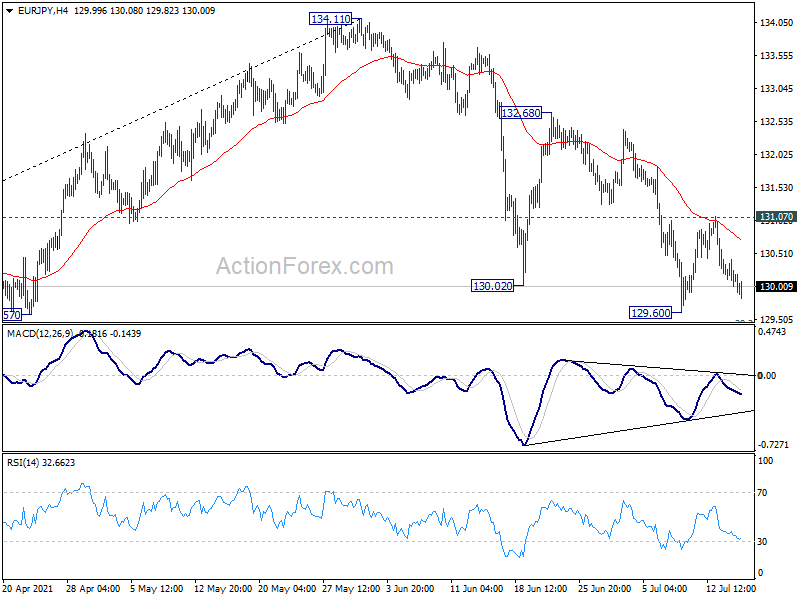
Intraday bias in EUR/JPY remains neutral for the moment. On the downside, break of 129.60 will resume the the correction from 134.11. But we'd expect strong support from 38.2% retracement of 121.63 to 134.11 at 129.34 to bring rebound. On the upside, break of 131.07 resistance should argue that the correction has completed. Intraday bias will be turned back to the upside for 132.68 resistance and above.
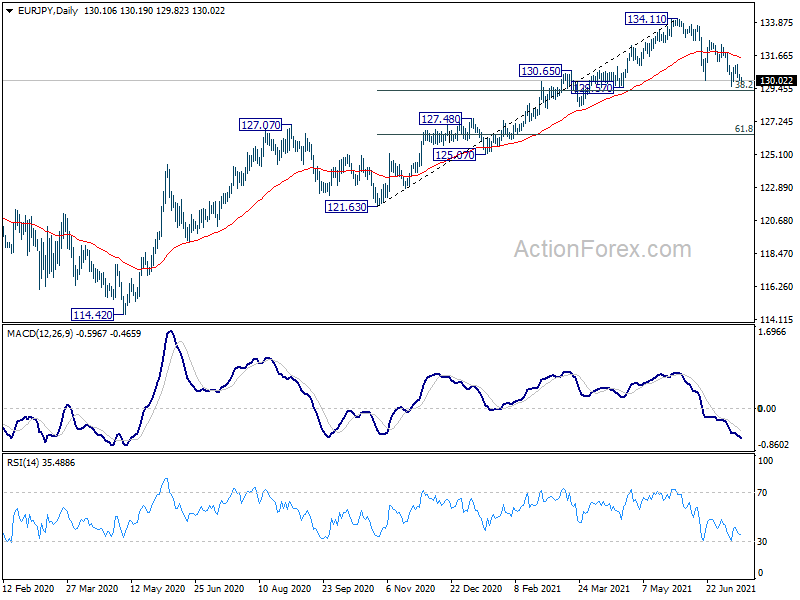
In the bigger picture, rise from 114.42 is seen as a medium term rising leg inside a long term sideway pattern. Next target is 137.49 (2018 high). Decisive break there will open up the possibility that it's indeed resuming the up trend from 94.11 (2012 low). For now, outlook will stay bullish as long as 127.07 resistance turned support holds, in case of pull back.
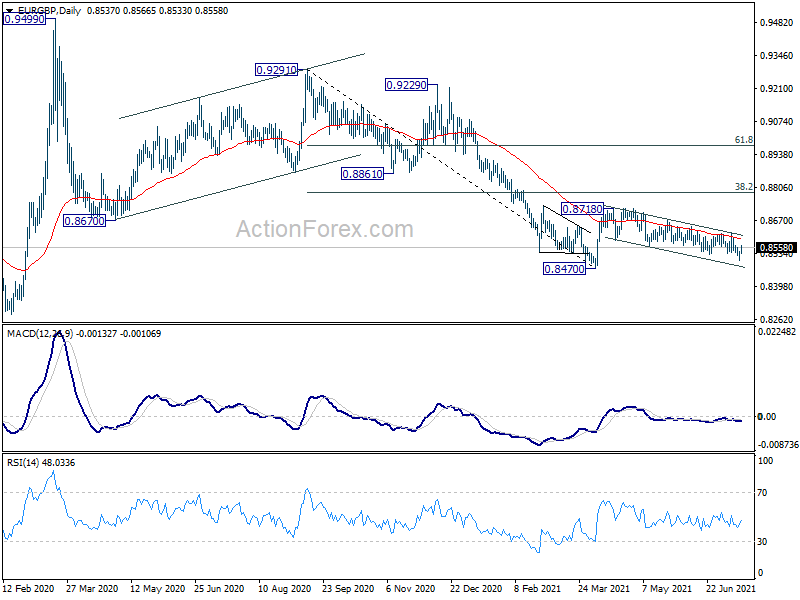
EUR/GBP Daily Outlook
Daily Pivots: (S1) 0.8514; (P) 0.8529; (R1) 0.8554; More...
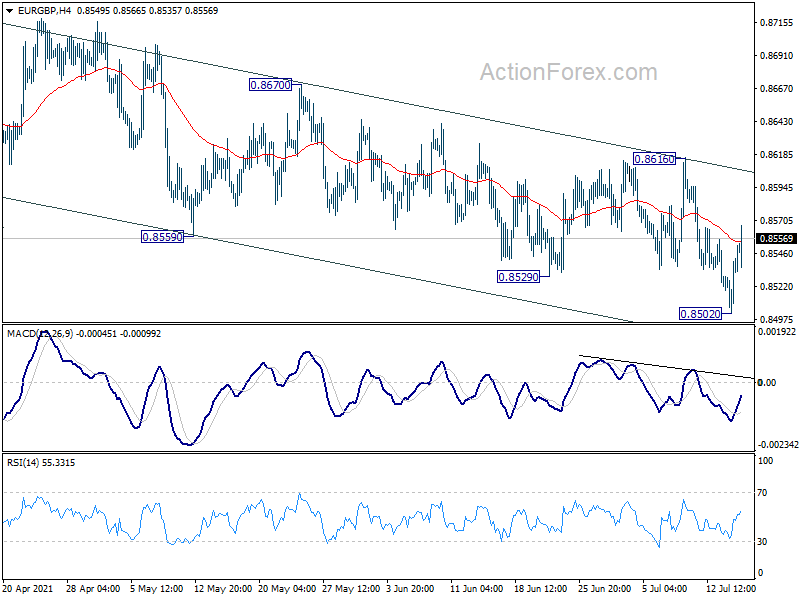
Intraday bias in EUR/GBP is turned neutral again with current recovery. On the downside, break of 0.8520 will extend the choppy fall from 0.8718 to retest 0.8470 low. On the upside, though, break of 0.8616 resistance will indicate completion of the correction from 0.8718, and turn bias back to the upside.
In the bigger picture, price actions from 0.9499 are still seen as developing into a corrective pattern. That is, up trend from 0.6935 (2015 low) would resume at a later stage. This will remain the favored case as long as 0.8276 support holds. However, firm break of 0.8276 support will suggest that rise from 0.6935 has completed and turn medium term outlook bearish.
EUR/AUD Daily Outlook
Daily Pivots: (S1) 1.5781; (P) 1.5814; (R1) 1.5852; More...
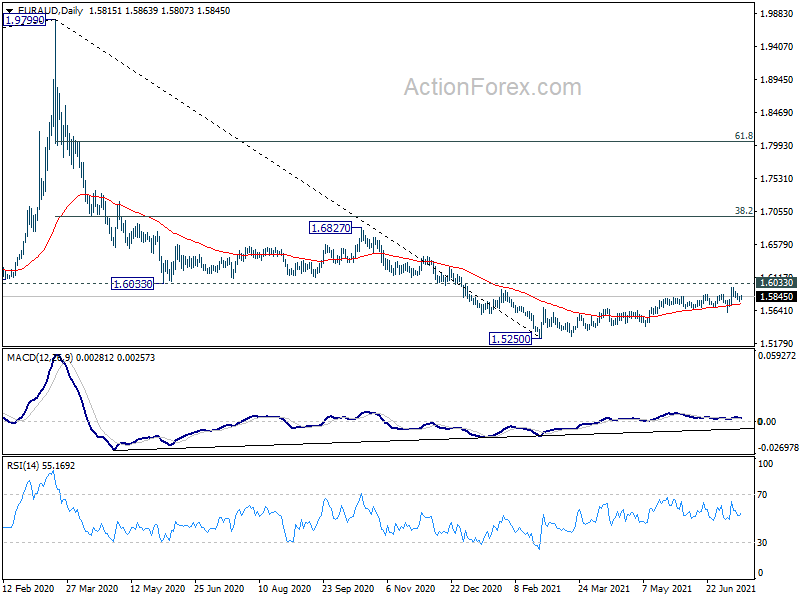
Outlook in EUR/AUD remains unchanged and intraday bias stays neutral first. Another rise could be seen with 1.5614 support intact. On the upside, break of 1.5976 will resume the choppy rise from 1.5250 to 1.6033 key support turned resistance next. Sustained break there will argue that longer term trend has reversed, and target 1.6827 resistance for confirmation.
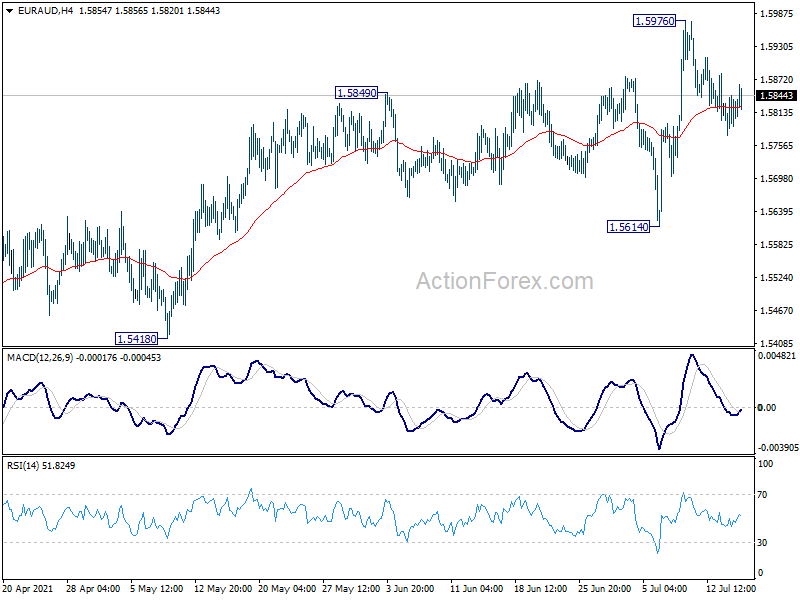
In the bigger picture, outlook stays bearish with 1.6033 support turned resistance intact for now. Fall from 1.9799, as a correction to to long term up trend from 1.1602 (2012 low) is still in favor to resume through 1.5250 later. However, However, firm break of 1.6033 will argue that such decline has completed. Stronger rebound would then be seen 38.2% retracement of 1.9799 to 1.5250 at 1.6988.