Sample Category Title
Daily Tecnical Analysis
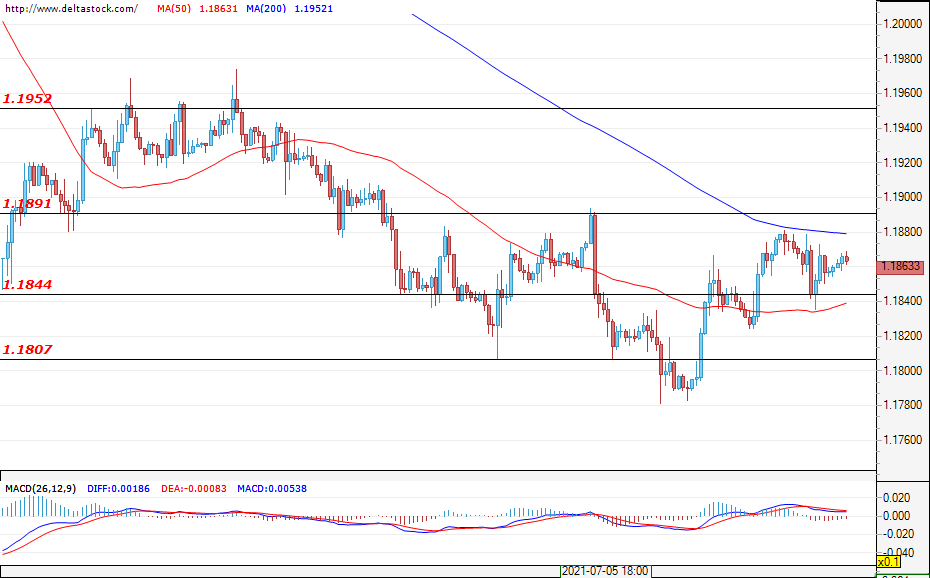
EUR/USD
Current level - 1.1875
The currency pair continues to trade within the narrow range between the support at 1.1800 and the resistance at 1.1890. At the moment, the market has no clear direction and the bulls might try to take the trade to 1.1950. Their daily support will be the zone at 1.1844 and their first resistance remains 1.1890. It is likely that the market will need a catalyst before it starts moving in its future direction. This could be the announcement of the consumer price index for the United States today at 12:30 GMT.
| Resistance | Support | ||
| intraday | intraweek | intraday | intraweek |
| 1.1890 | 1.1950 | 1.1840 | 1.1750 |
| 1.1950 | 1.2130 | 1.1800 | 1.1716 |
USD/JPY
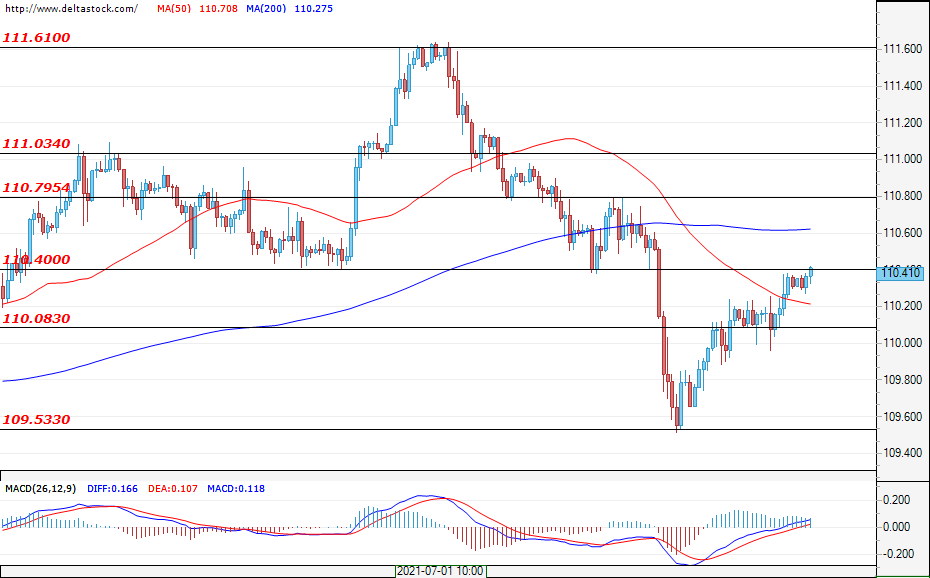
Current level - 110.08
The Greenback continues to recover against the yen and, in the early hours of today, trading has reached the resistance zone at 110.40. Even if the bullish rally continues, the expectations are that the movement will be limited to the zone of 110.60-110.80. Bulls can expect their first support at around 110.08. A new test of the support at 109.50 can also be expected when the bearish pressure resumes.
| Resistance | Support | ||
| intraday | intraweek | intraday | intraweek |
| 110.40 | 111.03 | 110.08 | 109.00 |
| 110.80 | 111.61 | 109.53 | 108.50 |
GBP/USD
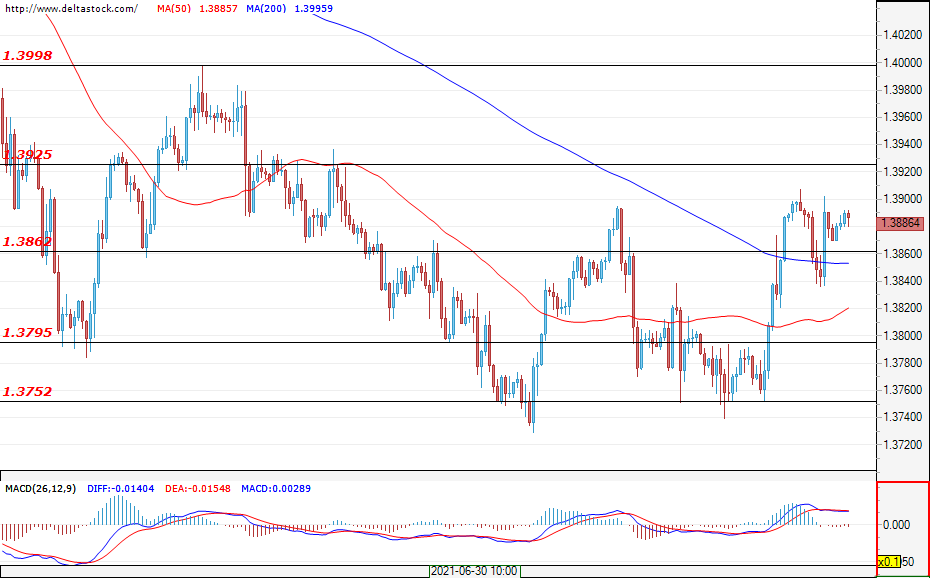
Current level - 1.3905
The sterling is about to reverse the downtrend and a breach above the resistance of 1.3925 seems a likely scenario as the bears are noticeably losing strength, while the bulls are becoming more aggressive. It is possible that the market will briefly consolidate around the current levels before buyers try to breach 1.3925. The first support for them is the area between 1.3840-1.3860. The most substantial support remains 1.3750.
| Resistance | Support | ||
| intraday | intraweek | intraday | intraweek |
| 1.3925 | 1.4000 | 1.3860 | 1.3750 |
| 1.4000 | 1.4118 | 1.3795 | 1.3610 |
EUR/USD Daily Outlook
Daily Pivots: (S1) 1.1838; (P) 1.1859; (R1) 1.1882; More...
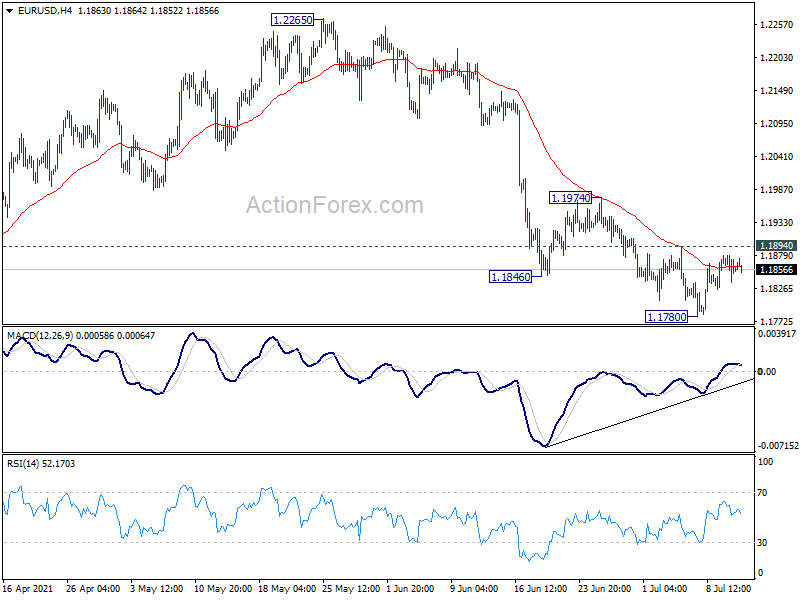
Intraday bias in EUR/USD remains neutral for the moment. Considering bullish convergence condition in 4 hour MACD, beak of 1.1894 minor resistance will indicate short term bottoming at 1.1780. Corrective pattern from 1.2348 might have completed too. Intraday bias will be turned back to the upside for 1.1974 resistance for confirmation. Sustained break there will pave the way back to 1.2265/2348 resistance zone. On the downside, break of 1.1780 will extend the correction to retest 1.1703 support instead.
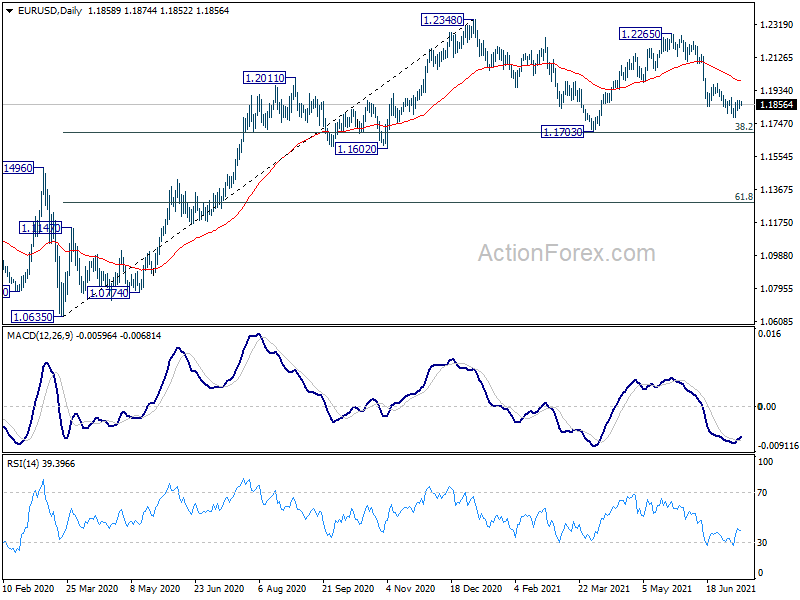
In the bigger picture, rise from 1.0635 is seen as the third leg of the pattern from 1.0339 (2017 low). Further rally could be seen to cluster resistance at 1.2555 next, (38.2% retracement of 1.6039 to 1.0339 at 1.2516). This will remain the favored case as long as 1.1602 support holds. Reaction from 1.2555 should reveal underlying long term momentum in the pair. However sustained break of 1.1602 will argue that the rise from 1.0635 is over, and turn medium term outlook bearish again.
GBP/USD Daily Outlook
Daily Pivots: (S1) 1.3845; (P) 1.3878; (R1) 1.3916; More....
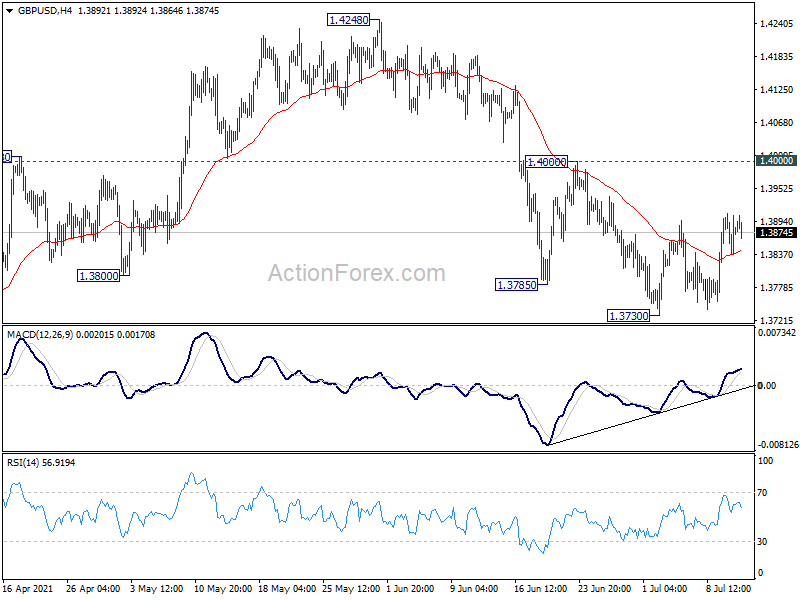
Intraday bias in GBP/USD remains neutral at this point. On the downside, break of 1.3730 will resume the fall from 1.4248, as the third leg of the consolidation pattern from 1.4240, to 1.3668 support and possibly below. On the upside, break of 1.4000 will turn bias back to the upside for retesting 1.4240/8 resistance zone instead.
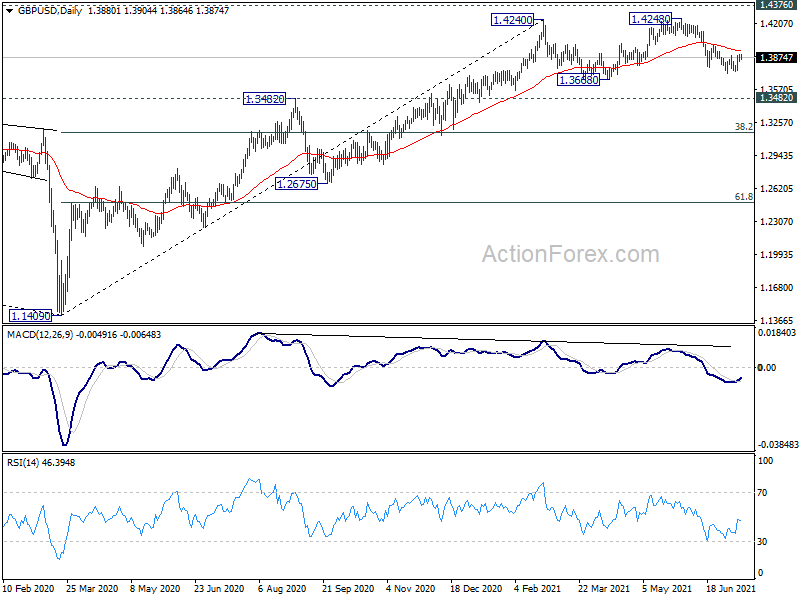
In the bigger picture, as long as 1.3482 resistance turned support holds, up trend from 1.1409 should still continue. Decisive break of 1.4376 resistance will carry larger bullish implications and target 38.2% retracement of 2.1161 (2007 high) to 1.1409 (2020 low) at 1.5134. However, firm break of 1.3482 support will argue that the rise from 1.1409 has completed and bring deeper fall to 1.2675 support and below.
USD/CHF Daily Outlook
Daily Pivots: (S1) 0.9132; (P) 0.9152; (R1) 0.9170; More....
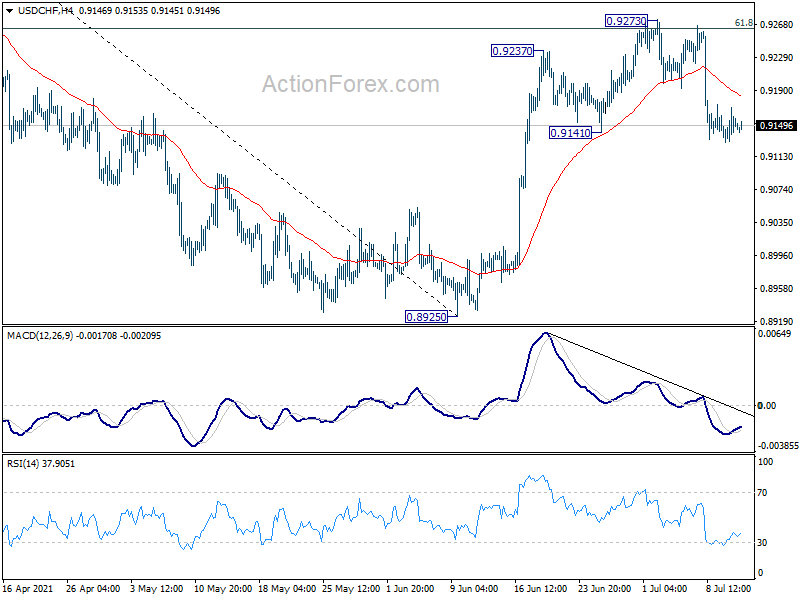
USD/CHF is losing some downside momentum but risk remains on the downside with 0.9273 resistance intact. Rebound form 0.8925 could completed completed at 0.9273, after rejection by 61.8% retracement of 0.9471 to 0.8925 at 0.9262. Sustained trading below 55 day EMA (now at 0.9123) will pave the way back to retest 0.8925 low.
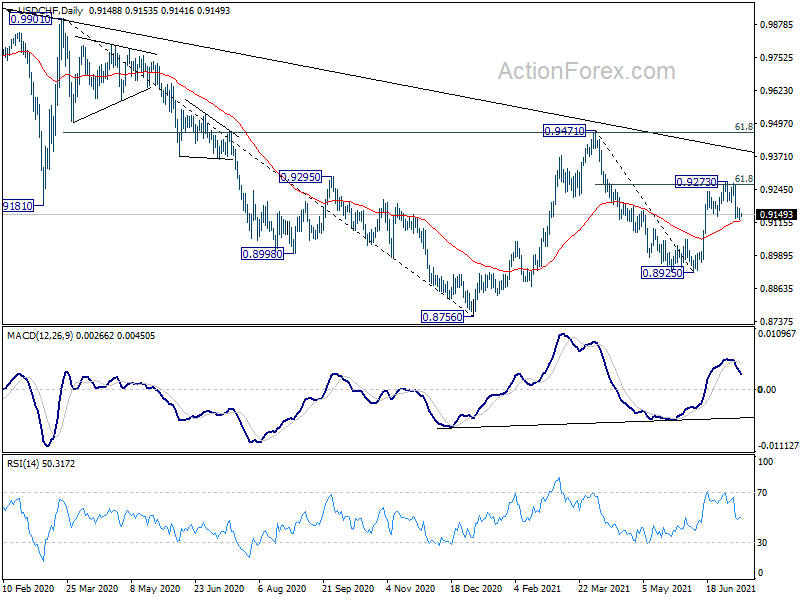
In the bigger picture, medium term outlook is currently neutral with focus on 0.9471 resistance. Sustained break there will indicate completion of whole decline from 1.0342 (2016 high). Medium term outlook will be turned bullish for a test on 1.0342 high. But, rejection by 0.9471 again will revive bearishness for another fall through 0.8756 low.
AUD/USD Daily Report
Daily Pivots: (S1) 0.7455; (P) 0.7475; (R1) 0.7502; More...
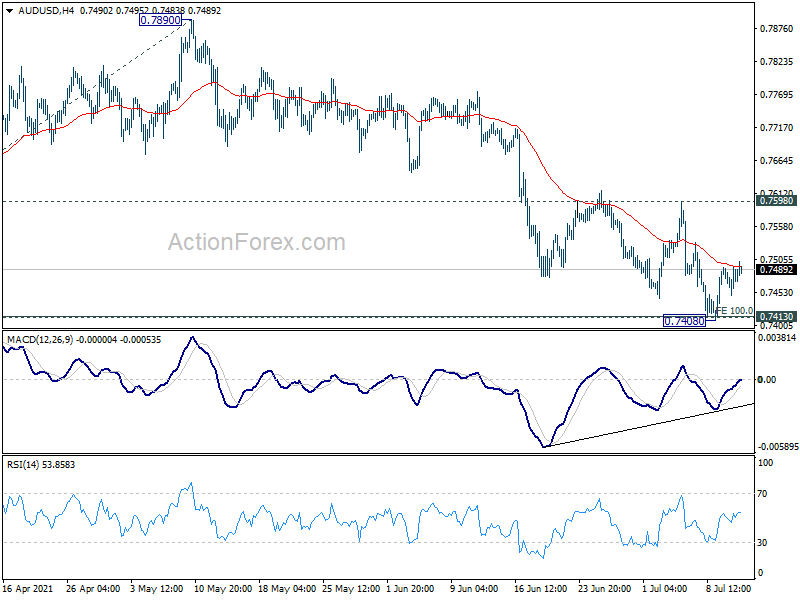
Intraday bias in AUD/USD remains neutral and outlook is unchanged. We're continue to expect strong support from 100% projection of 0.8006 to 0.7530 from 0.7890 at 0.7414 to complete the correction from 0.8006. On the upside, break of of 0.7598 resistance will turn bias back to the upside for 0.7890 resistance first. However, sustained break of 0.7414 will argue it's at least in larger scale correction, and target 161.8% projection of 0.8006 to 0.7530 from 0.7890 at 0.7120 next.
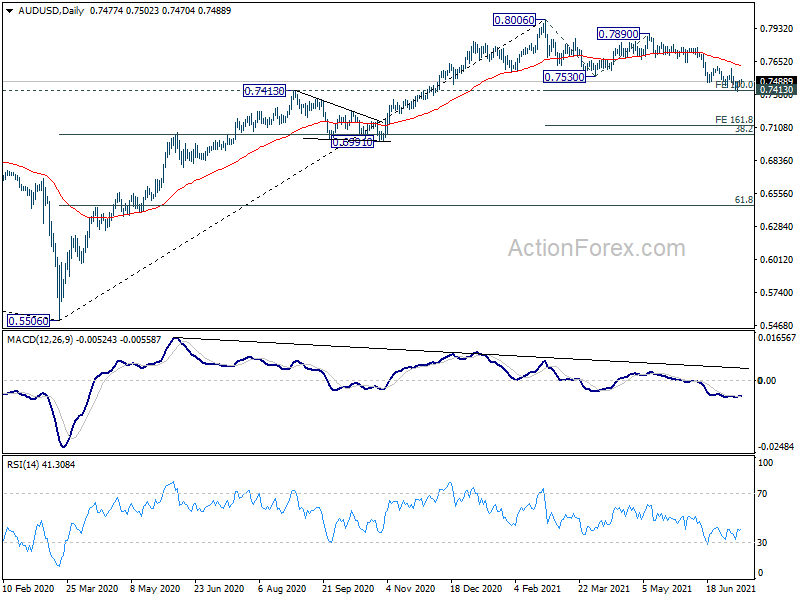
In the bigger picture, rise from 0.5506 medium term bottom could either be the start of a long term up trend, or a corrective rise. Reactions to 0.8135 key resistance will reveal which case it is. Rejection by 0.8135 key resistance, followed by firm break of 0.7413 resistance turned support, will favor the latter case. Deeper decline would be seen to 38.2% retracement of 0.5506 to 0.8006 at 0.7051 first.
Dollar Stays Tight, Building Up Strength For Breakout
Moderately positive stock market dynamics yesterday was combined with a slight 0.1% increase in the dollar index to 92.2 after two days of decline from 92.8.
The Dollar Index is now near the upper end of the converging trading range since last October. Also, a pullback is forming on the daily charts after touching the overbought area of the RSI index.
Therefore, the short-term technical picture is now on the side of the dollar bears, suggesting a further correction after last month's rally. Also, falling long-term bond yields are playing against the dollar. In contrast to last week, this move is increasingly linked to easing inflation fears and central bank actions pushing interest rates, including 120bn monthly Fed purchases.
At the same time, it is worth separating the short-term momentum from the longer-term trend. The latter could well be on the side of the dollar as the US economy recovers more strongly, and the Fed could prove to be the flagship of monetary policy normalisation.
Globally, the dollar has remained without a pronounced trend, forcing a closer look at the latest extremums. A firm break beyond these levels would be a signal for a further move in the breakout direction.
Short-term downward momentum is more plausible, causing us to look closer to the 200 SMA, which passes through 91.35. A decisive break below this level would open the way towards 89.60, the lower boundary area narrowing the trading range. Only a break of this area would revive bets on a global multi-year dollar decline.
The US advance on the stimulus rollback and solid economic growth leaves a moderately bullish scenario for the dollar on the table, whereby a pullback of the DXY to the 200-day average would once again attract buyers.
A slight pullback in the dollar might draw the buyers, ending a long consolidation by breaking through the upper 92.7 range boundary. A break-up will be confirmed by a move above 93.4 (previous peak area).
The balance between the bulls and the bears is very tight due to the pandemic heightened uncertainty. However, traders and investors should note that a prolonged consolidation leads to a compressed spring effect: the longer the range is compressed, the stronger the subsequent trend in the direction of the breakout will be.
The US Treasury Ends Its Mid-Month Refinancing Operation
Markets
Core bonds ended their first trading session of the week near opening levels with a slight underperformance of US Treasuries. US yields added 0.1 bp to 1.3 bps with the belly of the curve outperforming the wings. German yield changes varied between -0.4 bps and +0.2 bps. Recall last week’s stellar, but rather inexplicable, core bond bull run which only met with corrective downward action on Thursday and especially Friday. The long end of EU and especially US yield curves remain mysterious with the combination of rock-bottom real yields and topping off inflation expectations either pointing at a much bleaker economic future than generally assumed, a central bank unable/unwilling to revert policy settings to normal or a combination of both. The suggestion that investment/Treasury flows are interfering each day becomes harder to defend. Yesterday’s US 3-yr and especially 10-yr Note auction went well even if the 10y was awarded at the lowest yield since February. The US Treasury ends its mid-month refinancing operation tonight with a $24bn 30-yr Bond auction. Before we arrive at that debt sale, US NFIB Small Business Optimism and CPI inflation are scheduled for release. We obviously eye the inflation print.Consensus expects last month’s headline 5% Y/Y reading to have been the peak in the cycle with a small moderation to 4.9% Y/Y expected. 5%+ inflation tended to have a scary impact on markets, sending both bonds and stocks lower. Recent market action suggests that the inflation bogeyman at least for now isn’t top of mind anymore. It will be thus be telling if we might see some weakness on an at consensus or higher CPI print. The underlying core inflation probably hasn’t reached its peak yet with consensus eyeing a rise from 3.8% Y/Y to 4% Y/Y which would be the highest since the end of 1991. EUR/USD remains stuck in the 1.18-1.19 zone this month with the greenback slightly taking the upper hand yesterday. The pair closed at 1.1861. In case of a potential bond reaction to the US CPI print, it will be the underlying drivers that determine the USD reaction function. Via the (likeliest) inflation channel, it could weigh on USD whereas higher real yields (Fed normalization) hang on the other side of the balance. A wildcard on today’s agenda is the start of Q2 earnings season (JP Morgan, Goldman Sachs). European/US stock markets eventually managed positive closes yesterday, but (EU) sentiment has been sluggish of late.
News headlines
Chinese exports unexpectedly grew 20.2% y/y in June. Imports rose at a faster (than expected) 24.2%, leaving the total trade balance at CNY 332.75bn. The better than expected readings are supportive for an economy that’s seen slowing from the post-pandemic surge as suggest by for example PMI business confidence. Chinese Q2 GDP figures due Thursday therefore will be under market scrutiny. Consensus expects growth to have accelerated to 1% q/q (from 0.6% last Q1) but slowed down to 8% y/y (from 18.3%).
The US administration is debating proposals for a digital trade agreement that covers a range of Indo-Pacific economies including Canada, Chile, Japan, Australia, and others, people familiar with the plans disclosed. The deal could set out standards for a digital economy that stretches from rules on the use of data, trade facilitation, and electronic customs arrangements. Doing so would mean a clear break with policy under former president Trump, who decided to withdraw from negotiations for the Trans-Pacific Partnership trade deal in 2017.
The British Retail Consortium said retail sales were 13.1% higher in June this year compared to the same period in 2019. Summer clothing and footwear along with Euro 2020 demand for snack food, beer, and TVs fueled the spending spree. In all of the second quarter, sales jumped 10.4%, delivering retailers their best quarter ever as cash piled up at in bank accounts after more than a year of restrictions. The BRC added though that the sector still suffers from low footfall as commuters and tourist numbers remain well below pre-pandemic levels.
USD/CAD Daily Outlook
Daily Pivots: (S1) 1.2428; (P) 1.2471; (R1) 1.2496; More...
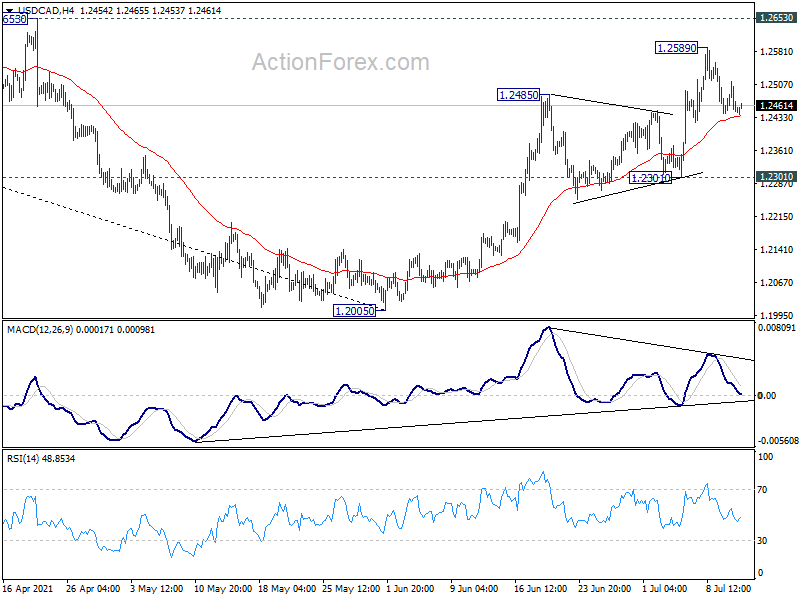
Consolidation from 1.2589 is still in progress and intraday bias in USD/CAD remains neutral at this point. Another rise is still in favor as long as 1.2301 support holds. Break of 1.2589 will target 1.2653 structural resistance to confirm larger bullish reversal. However, on the downside, break of 1.2301 support will dampen the bullish case and turn bias back to the downside for 1.2005 low instead.
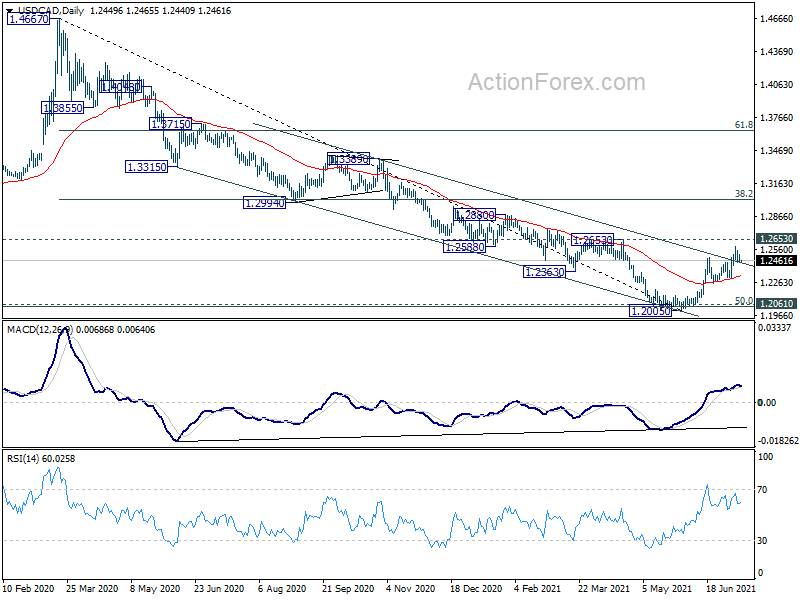
In the bigger picture, fall from 1.4667 is seen as the third leg of the corrective pattern from 1.4689 (2016 high). It might have completed after hitting 1.2061 (2017 low) and 50% retracement of 0.9406 to 1.4689 at 1.2048. Sustained break of 38.2% retracement of 1.4667 to 1.2005 at 1.3022 will pave the way to 61.8% retracement at 1.3650. Overall, medium term outlook remains neutral at worst with 1.2048/61 support zone intact.
XAUUSD Is Possibly Bullish
Technical analysis
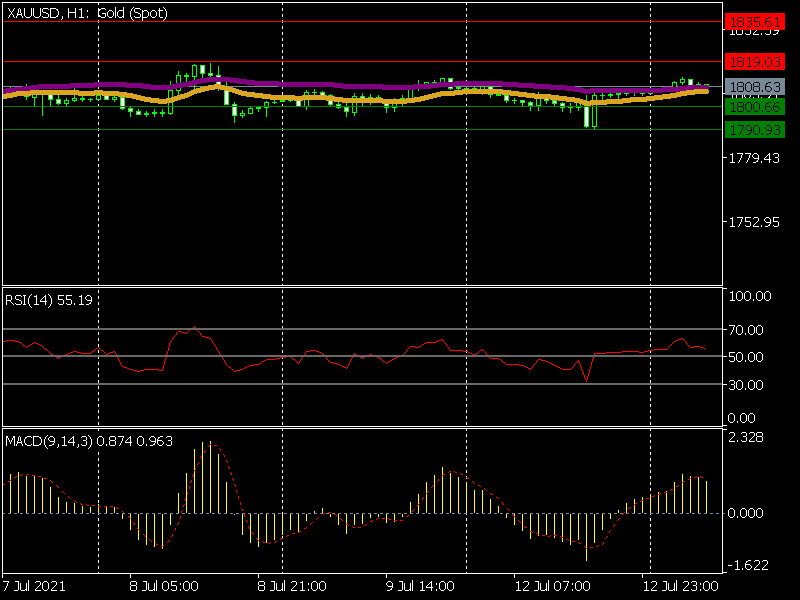
The EMA(50) and EMA(100) tend to cross, which may be suitable for opening trades
The MACD indicator is above 0 and is pointing up
The RSI is above 50.
What the possible outcomes are
The XAUUSD pair advanced the 1,800 price level and trades above it. Although, its next direction will depend on the U.S. CPI data due 12:30 GMT today. However, the current technical indicators refer to a possible uptrend potential.
If the price passes the initial resistance level of 1,819.03, it could test the next one at 1,835.61.
Alternatively, if the price reverses, then it could reach the first support level of 1,800.66. A pass below the first level can move bears lower toward 1,790.93.
Key levels
Support 1,800.66 1,790.93
Resistance 1,819.03 1,835.61
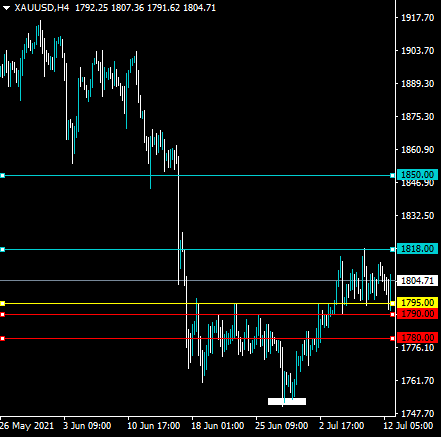
XAUUSD Could Test $1,850
Gold is still look bullish in the short-term as traders continue to scoop up any price dips in the yellow-metal below the $1,800 support level. The four-hour time frame continues to show that an inverted head and shoulders pattern with at least a $50.00 upside projection is in play. Inflation fears and weakness in the US dollar index should support further gains in the price of gold.
XAUUSD is only bullish while trading above the $1,795 level, key resistance is found at the $1,818 and the $1,850 levels.
If XAUUSD trades below the $1,795 level, sellers may test the $1,790 and $1,780 support levels.