

Sample Category Title
USD/CAD Weekly Outlook
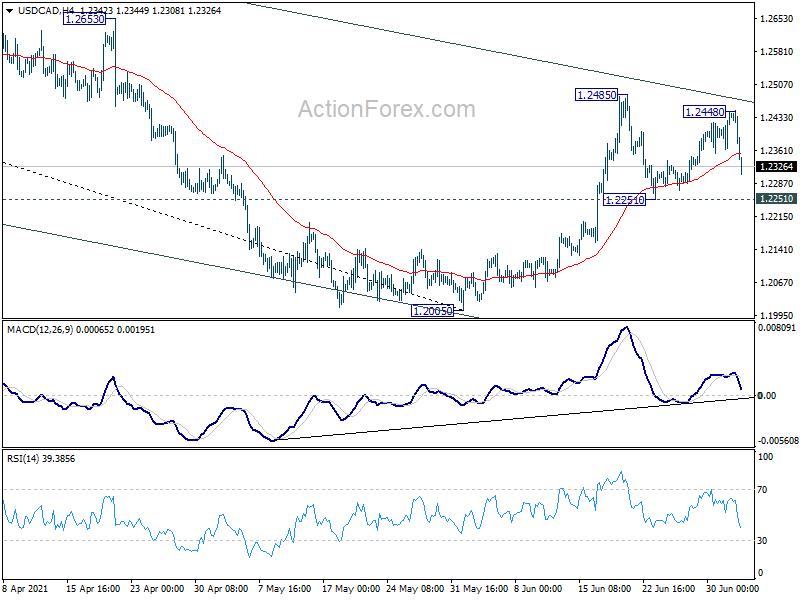
USD/CAD rebounded to 1.2448 last week but reversed from there. Initial bias is turned neutral this week first. On the upside, firm break of 1.2485 resistance will resume whole rise from 1.2005 for 1.2653 key structural resistance next. On the downside, break of 1.2251 support will argue that rebound from 1.2005 has completed after failing medium term channel resistance. Intraday bias will be back on the downside for retesting 1.2005.
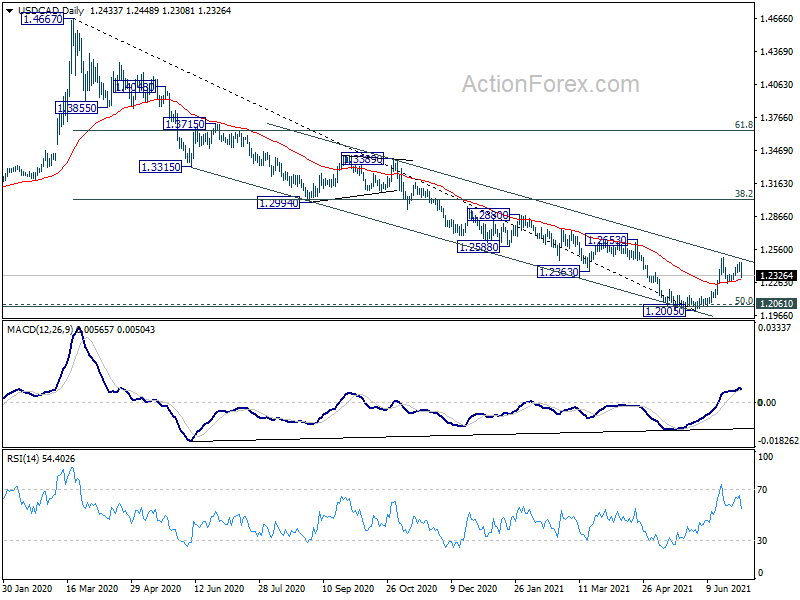
In the bigger picture, fall from 1.4667 is seen as the third leg of the corrective pattern from 1.4689 (2016 high). It might have completed after hitting 1.2061 (2017 low) and 50% retracement of 0.9406 to 1.4689 at 1.2048. Sustained break of 38.2% retracement of 1.4667 to 1.2005 at 1.3022 will pave the way to 61.8% retracement at 1.3650. Overall, medium term outlook remains neutral at worst with 1.2048/61 support zone intact.
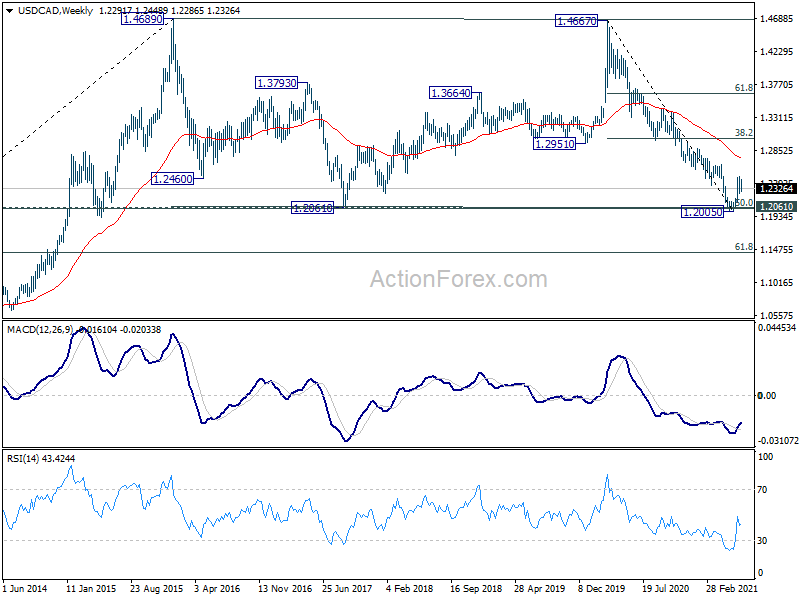
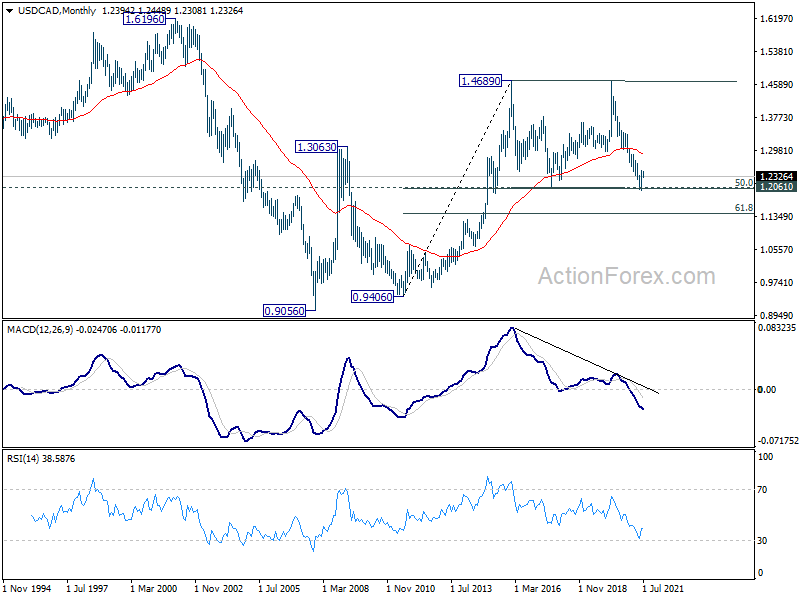
In the longer term picture, we're viewing price actions from 1.4689 as a consolidation pattern. Thus, up trend from 0.9506 (2007 low) is still expected to resume at a later stay. This will remain the favored case as long as 1.2061 support holds, which is close to 50% retracement of 0.9406 to 1.4689 at 1.2048. However, sustained break of 1.2061 will be a sign of long term bearishness. Deeper fall would be seen to 61.8% retracement at 1.1424 and below.
GBP/JPY Weekly Outlook
GBP/JPY stayed familiar range last week and outlook is unchanged. Initial bias stays neutral this week first. On the downside, below 152.59 will likely extend the corrective pattern from 156.05 through 151.28 support. In this case, we'd expect strong support from 38.2% retracement of 136.96 to 156.05 at 148.75 to bring rebound. On the upside, above 155.13 will target a test on 156.05 high instead.
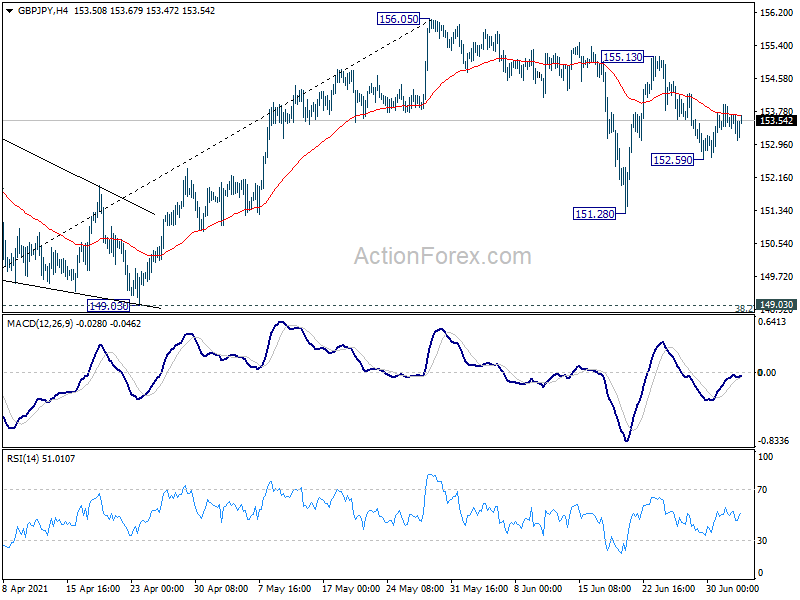
In the bigger picture, rise from 123.94 is seen as the third leg of the pattern from 122.75 (2016 low). Focus is now on 156.59 resistance (2018 high). Sustained break there should confirm long term bullish trend reversal. Next target is 61.8% retracement of 195.86 (2015 high) to 122.75 at 167.93. On the downside, break of 149.03 support is needed to be the first sign of completion of the rise from 123.94. Otherwise, outlook will remain bullish even in case of deep pull back.
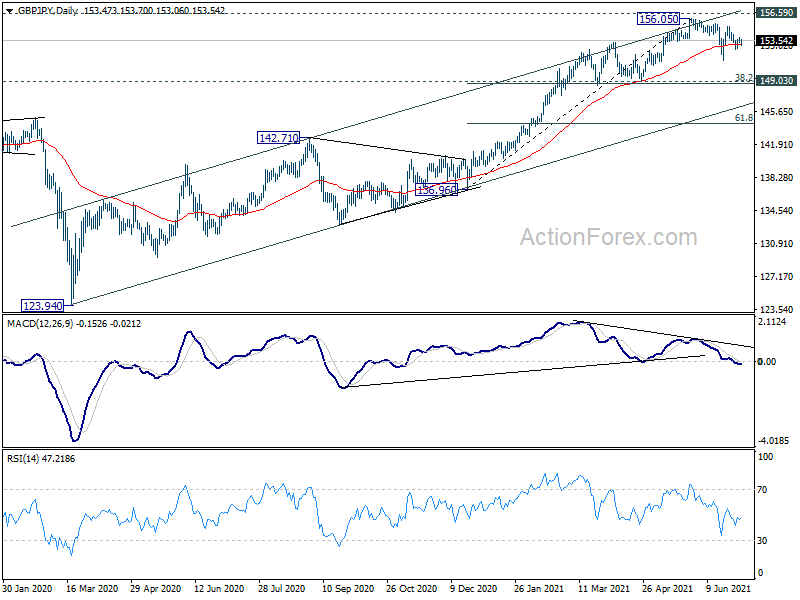
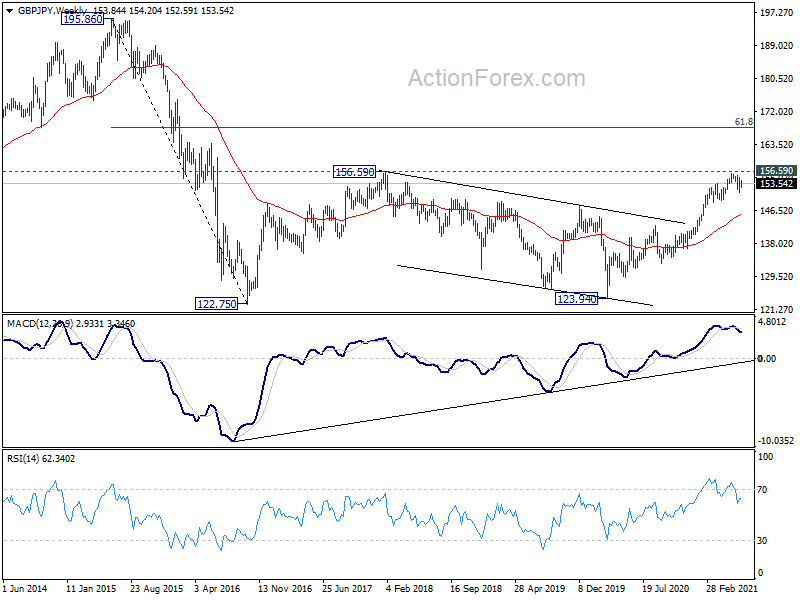
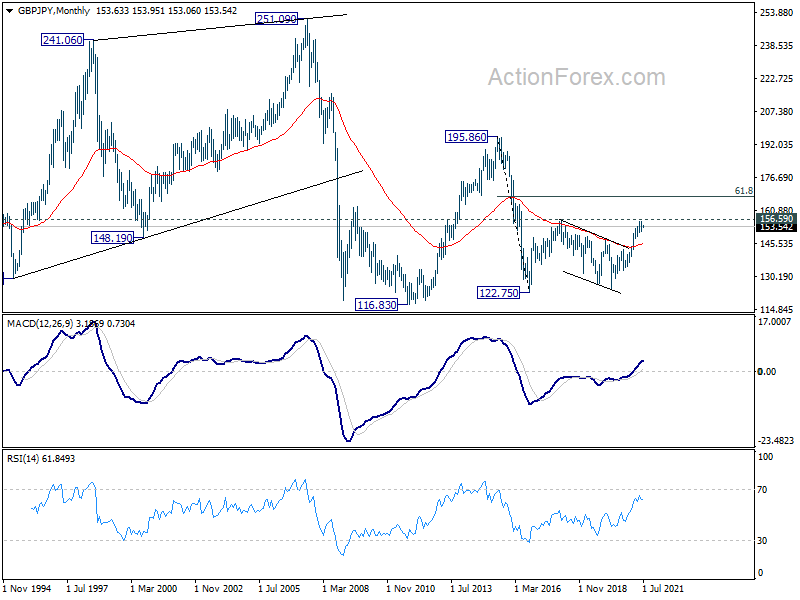
In the longer term picture, the strong break of 55 months EMA was an early sign of long term bullish reversal. Firm break of 156.69 resistance should now confirm the start of an up trend for 195.86 (2015 high).
EUR/JPY Weekly Outlook
EUR/JPY struggled in tight range last week and outlook is unchanged. Initial bias remains neutral this week first. On the downside, break of 131.21 support will likely extend the correction from 134.11 through 130.02. But in this case, we'd expect strong support from 38.2% retracement of 121.63 to 134.11 at 129.34 to bring rebound. On the upside, break of 132.68 will bring retest of 134.11 high instead.
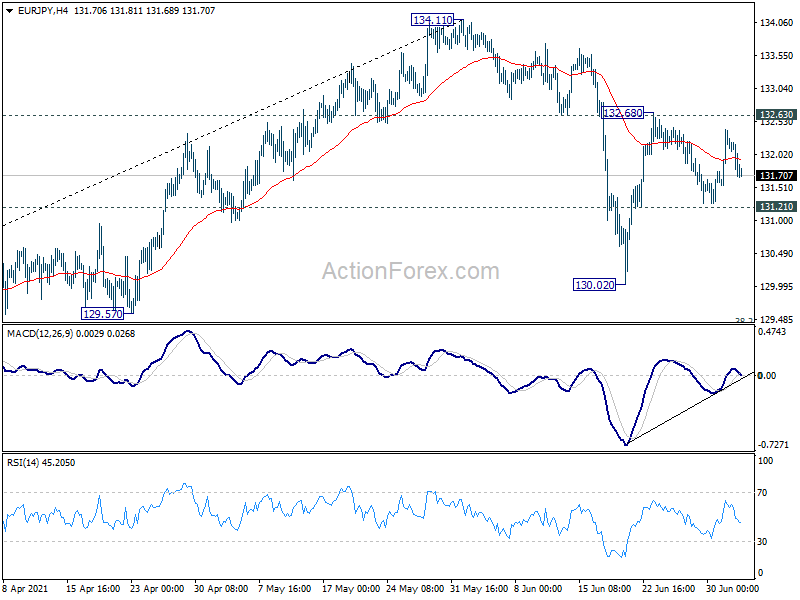
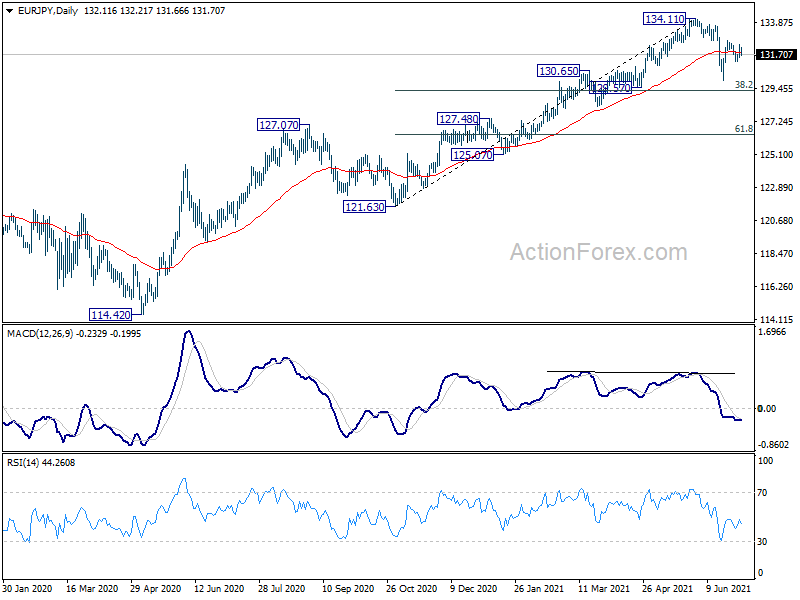
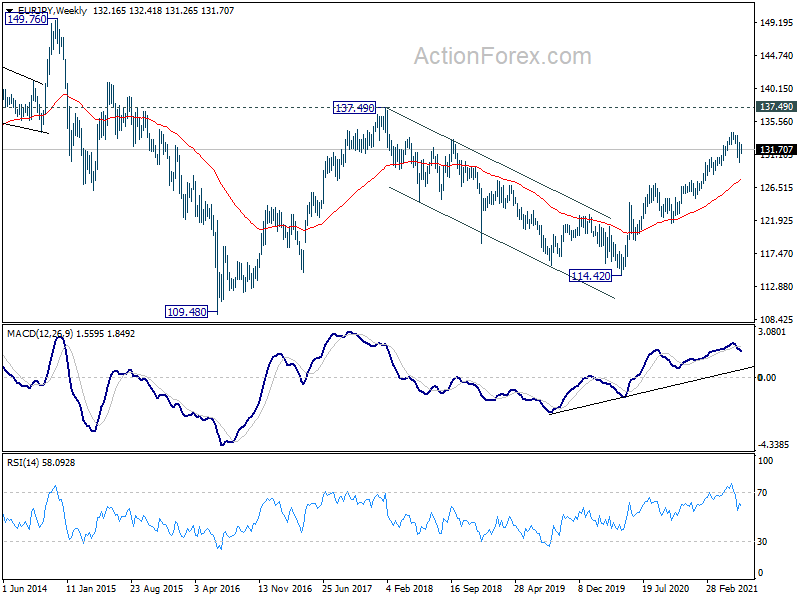
In the bigger picture, rise from 114.42 is seen as a medium term rising leg inside a long term sideway pattern. Next target is 137.49 (2018 high). Decisive break there will open up the possibility that it's indeed resuming the up trend from 94.11 (2012 low). For now, outlook will stay bullish as long as 127.07 resistance turned support holds, in case of pull back.
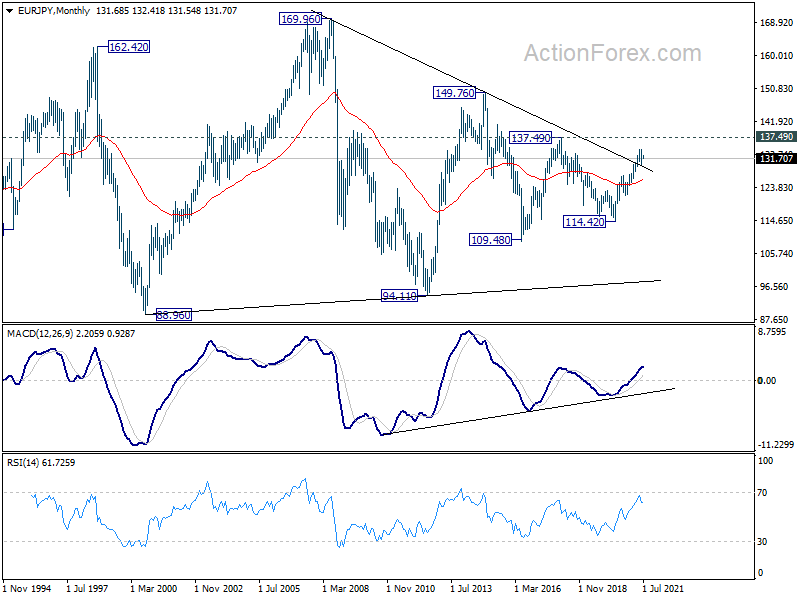
In the long term picture, EUR/JPY is staying in long term sideway pattern, established since 2000. Another rising leg in progress for 137.49 resistance and above.
EUR/GBP Weekly Outlook
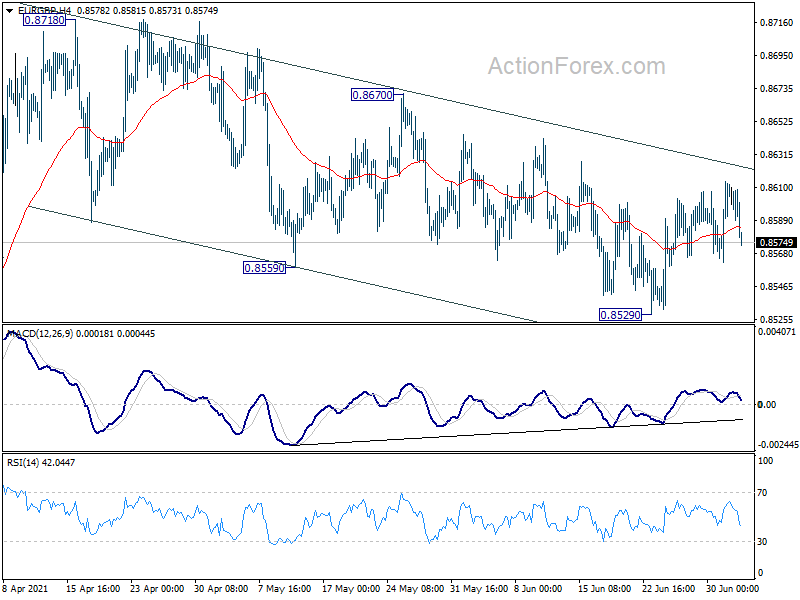
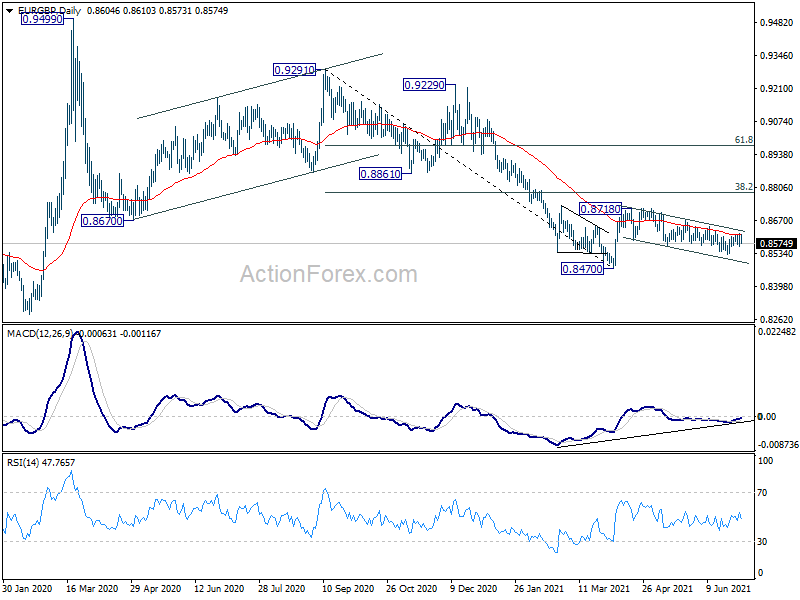
EUR/GBP continued to gyrate inside near term falling channel last week and outlook is unchanged. Initial bias stays neutral this week first. On the downside, break of 0.8529 will resume the choppy decline towards retesting 0.8470 low. On the upside, decisive break of 0.8670 will confirm that corrective fall from 0.8718 has completed. Further rise would be seen to resume the rebound from 0.8470.
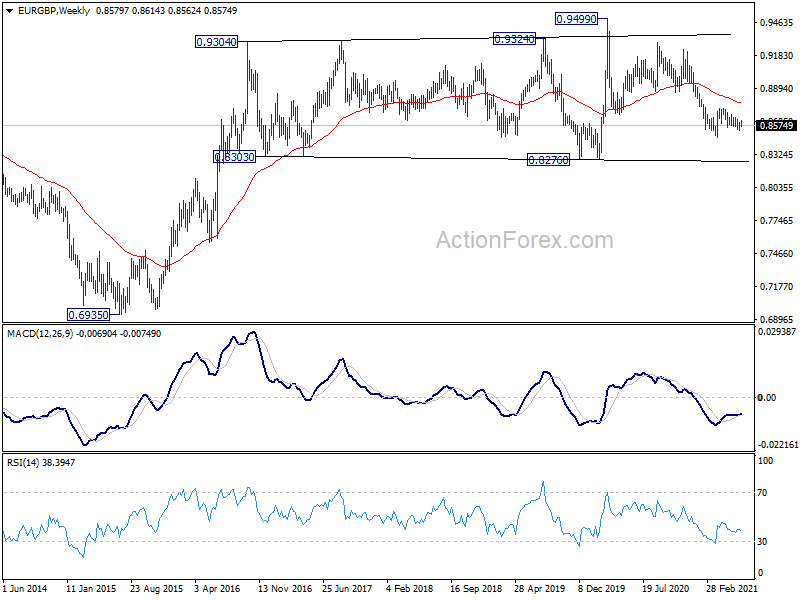
In the bigger picture, price actions from 0.9499 are still seen as developing into a corrective pattern. That is, up trend from 0.6935 (2015 low) would resume at a later stage. This will remain the favored case as long as 0.8276 support holds. However, firm break of 0.8276 support will suggest that rise from 0.6935 has completed and turn medium term outlook bearish.
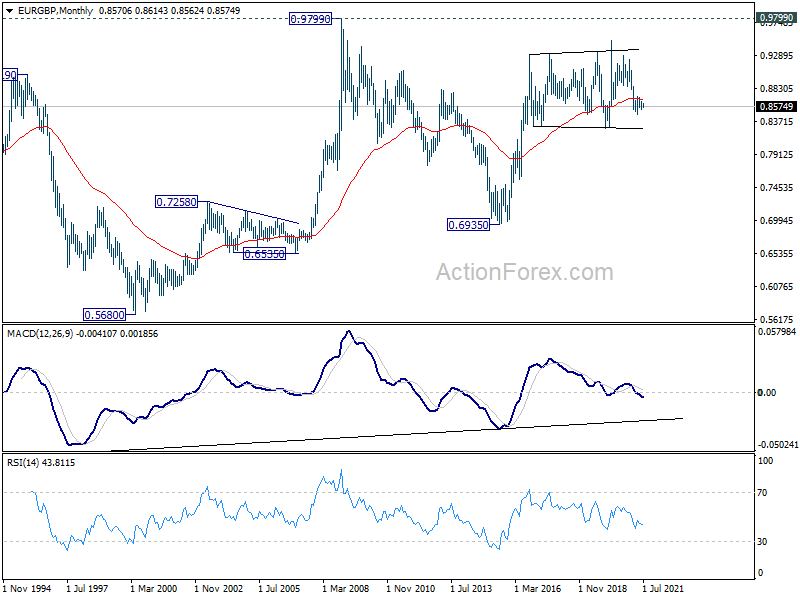
In the long term picture, rise from 0.6935 (2015 low) is still in progress. It could be resuming long term up trend from 0.5680 (2000 low). Break of 0.9799 (2008 high) is expected down the road, as long as 0.8276 support holds.
EUR/AUD Weekly Outlook
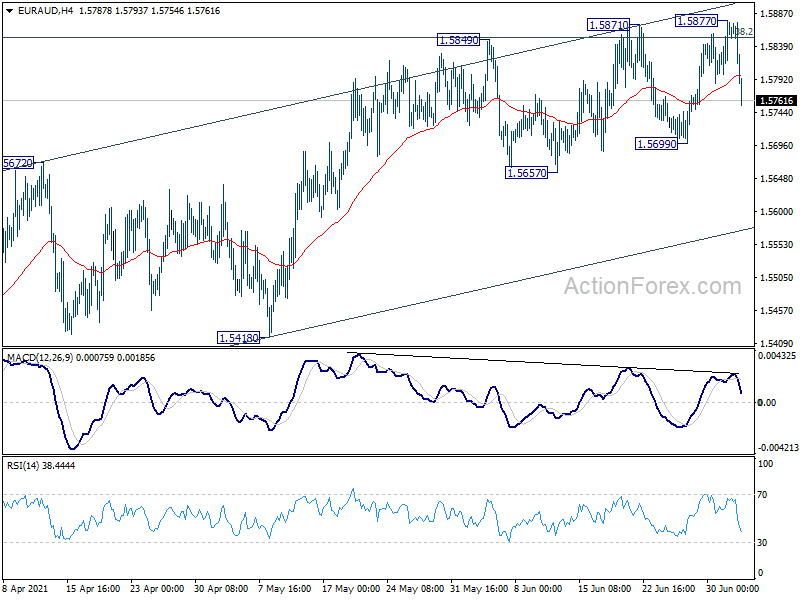
EUR/AUD edged higher to 1.5877 last week but again, failed to sustain above 38.2% retracement of 1.6827 to 1.5250 at 1.5852. Initial bias remains neutral this week first. On the downside, break of 1.5699 support will suggest rejection by 1.5852 fibonacci level. Intraday bias will be turned back to the downside for 1.5418 support first. Break there should confirm completion of consolidation pattern from 1.5250. On the upside, break of 1.5877 will extend the near term rebound to 1.6033 key support turned resistance.
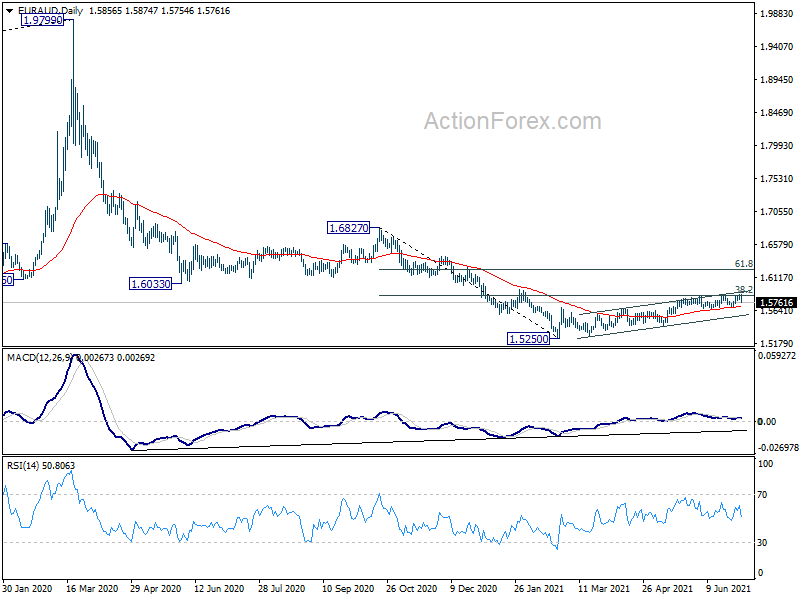
In the bigger picture, price actions from 1.9799 are developing into a deep correction, to long term up trend from 1.1602 (2012 low). Deeper fall would be seen to 61.8% retracement of 1.1602 to 1.9799 at 1.4733. Medium term outlook will remain bearish as long as 1.6033 support turned resistance holds, even in case of strong rebound. However, firm break of 1.6033 will argue that such decline has completed, and turn focus to 1.6827 structural resistance for confirmation.
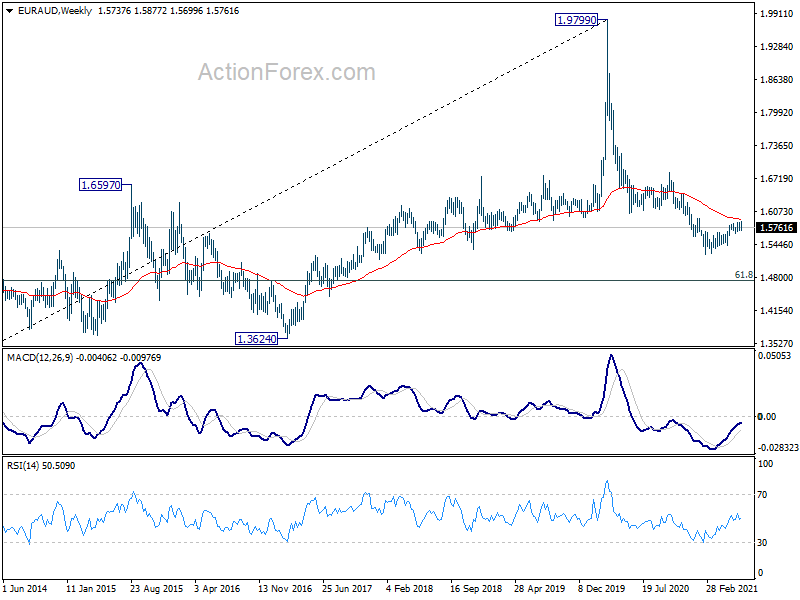
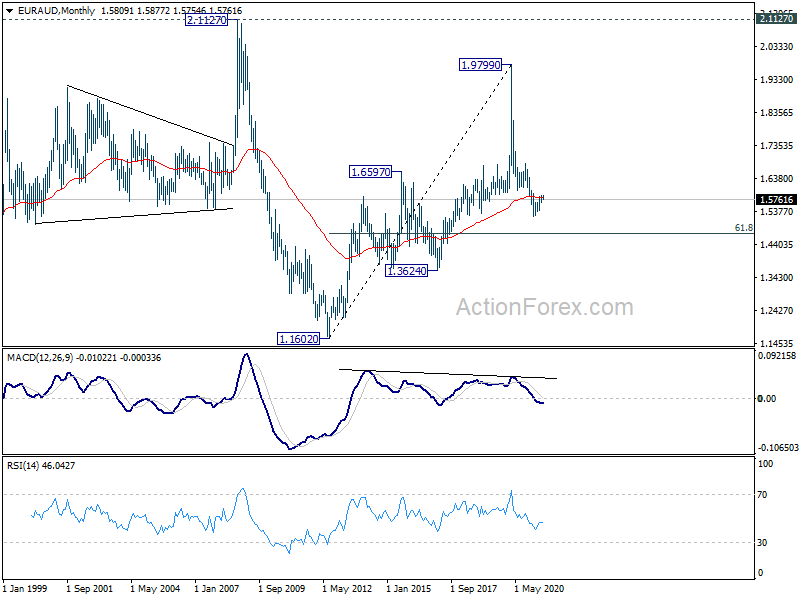
In the longer term picture, rise from 1.1602 (2012 low) should have already completed with three waves up to 1.9799 (2020 high). Fall from there is seen as a medium term to long term down leg as a long term down trend, or a sideway pattern. We'll assess the odds again at a later stage.
EUR/CHF Weekly Outlook
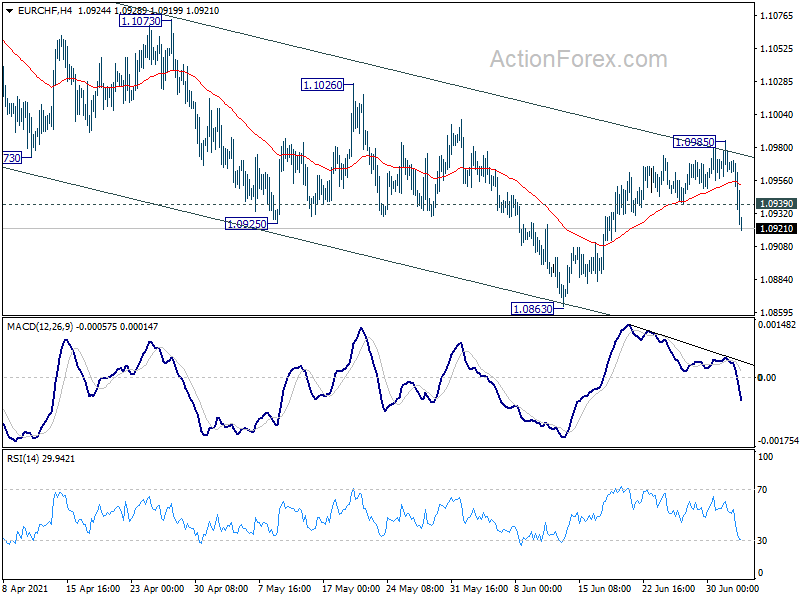
EUR/CHF edged higher to 1.0985 last week, but was rejected by medium term channel resistance and reversed from there. Rebound from 1.0863 might have completed already. Initial bias is now on the downside this week for 1.0863 support first. Break there will resume whole decline from 1.1149 to 1.0737 cluster support zone. For now, risk will be on the downside as long as 1.0985 holds.
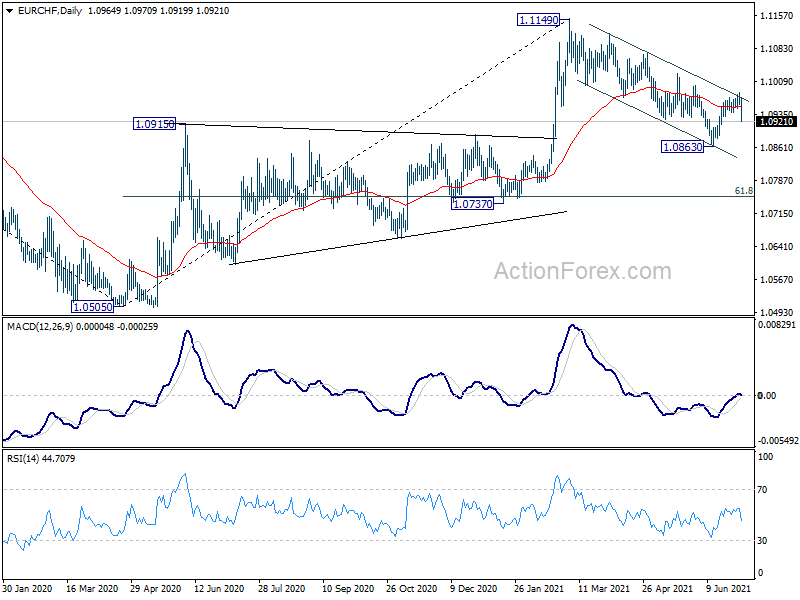
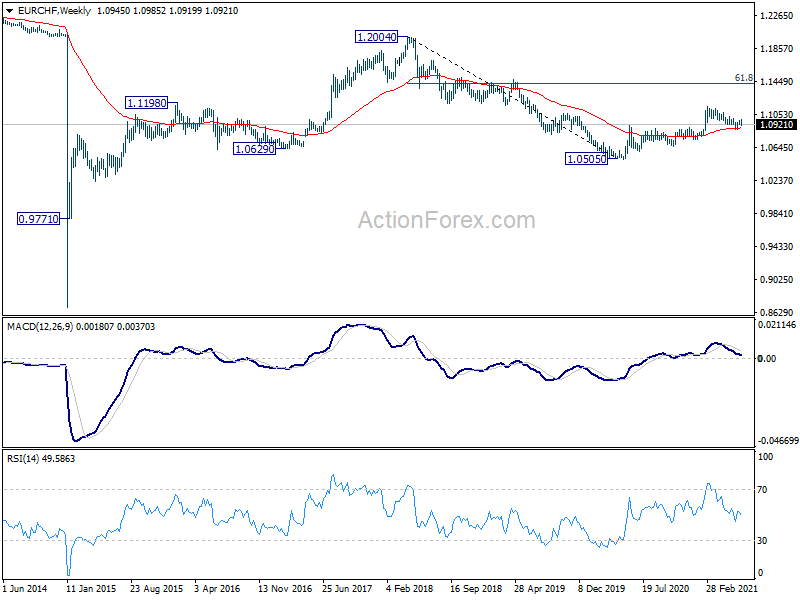
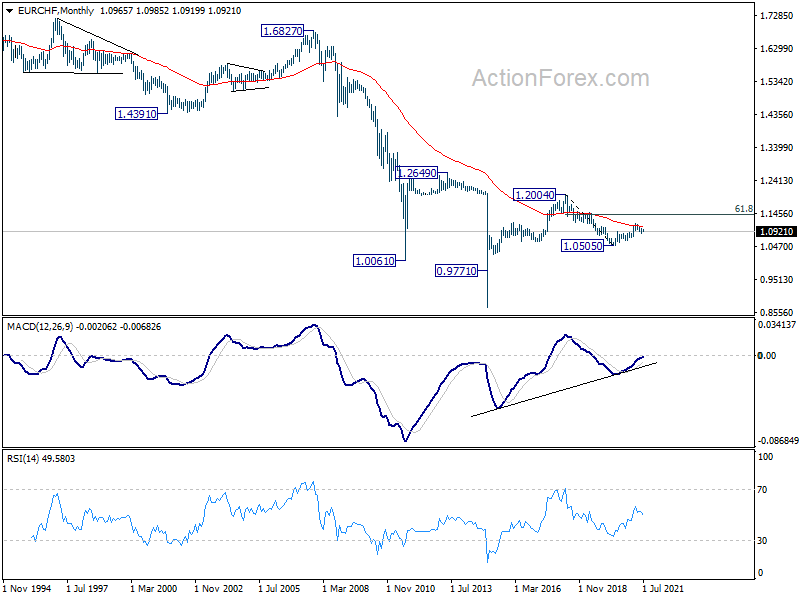
In the bigger picture, current development argues that rebound from 1.0505 (2020 low) might be completed at 1.1149 already. Rejection by 55 month EMA (now at 1.1074) at least keeps medium term bearishness open. Sustained break of 1.0737 cluster support (61.8% retracement of 1.0505 to 1.1149 at 1.0751) will argue that the down trend from 2004 (2018 high) is ready to resume through 1.0505 low. Sustained trading below 55 week EMA (now at 1.0885) will affirm this bearish case. Nevertheless, strong support from 55 week EMA will revive the case for resuming the rise from 1.0505 at a later stage.
Focus Might Turns to Euro Selling While Dollar Rally Capped by Strong Risk Appetite
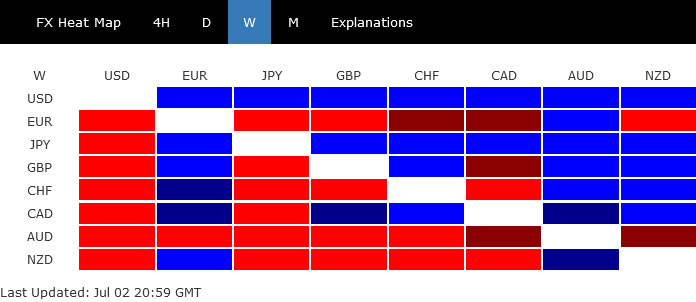
Dollar ended as the strongest one last week but Friday's steel fall after solid non-farm payroll job reports suggests that it's rally is already losing steam. It's still a bit early to call a bearish reversal for the greenback. Yet, strong risk-on sentiments could cap Dollar's upside attempts ahead, and even trigger a deeper pull back.
Euro ended as the second weakest, next to Aussie, but the late development in EUR/AUD suggests that the favor is not on Euro's side. More importantly, developments in some crosses like EUR/CHF and EUR/CAD indicates that market focuses might turn to selling in Euro in crosses ahead. On the other hand, the late rebound in Canadian Dollar opens up some upside prospects for the near term.
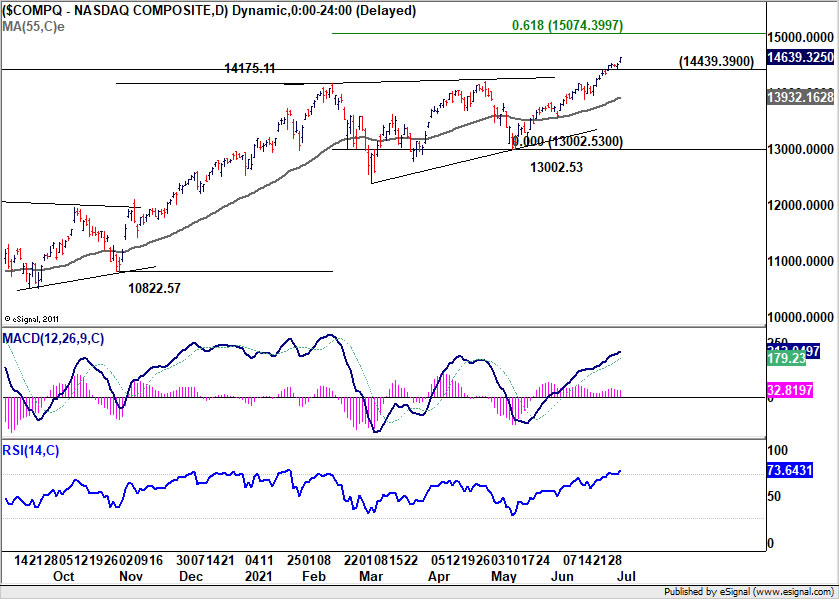
NASDAQ closed at new record, heading to 15k handle
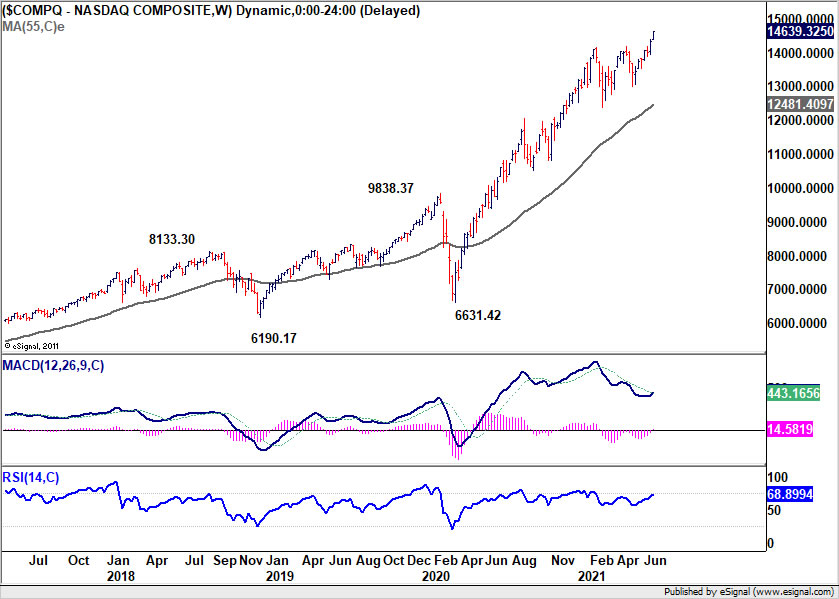
NASDAQ's up trend continued last wee after some hesitation, and finished with a strong close at new record high of 14639.32. Near term outlook will remain bullish as long as 14439.90 supports. Next target is 61.8% projection of 10822.57 to 14175.11 from 13002.53 at 15074.39.
That would be an important level to overcome as it's firstly close to 15k handle. More importantly, a strong break of 15k could put weekly MACD back into a rising track. That would in turn argues that NASDAQ is back in medium term up side acceleration. Strong break of 15k would set the stage for even more powerful rise in this 2H of the year.
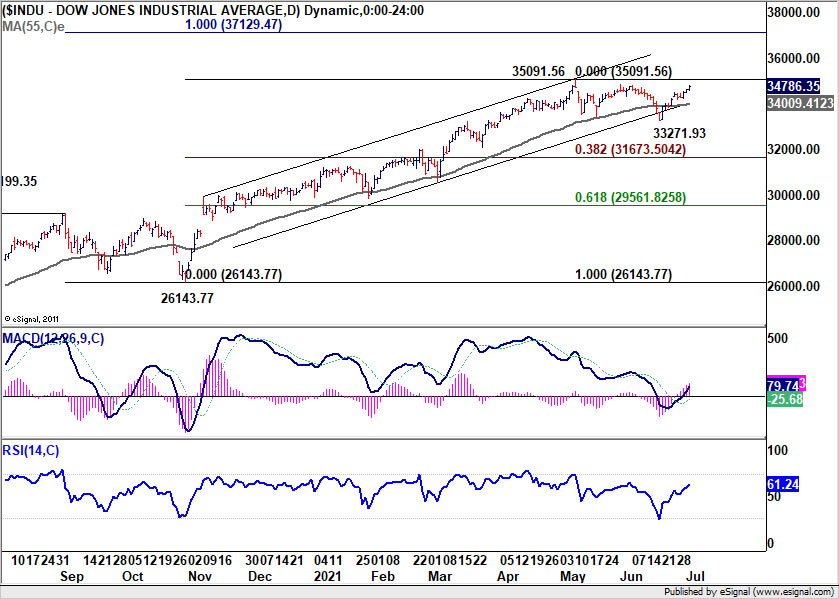
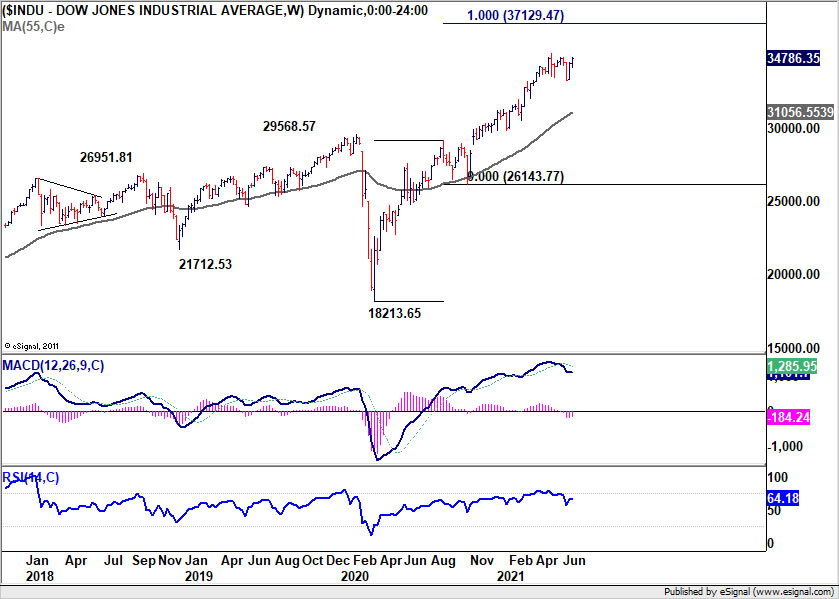
DOW to catch to resume record run.
DOW also made some notable progress even though it's still lagging behind S&P 500 and NASDAQ. Current development argues that consolidation pattern from 35091.56 has already completed at 33271.93, after brief breach of medium term channel support.
DOW could take on 35091.56 record high this week, and break will confirm resumption of larger up trend from 18213.65. Next target would be 100% projection of 18213.65 to 2919935 from 26143.77 at 37129.47.
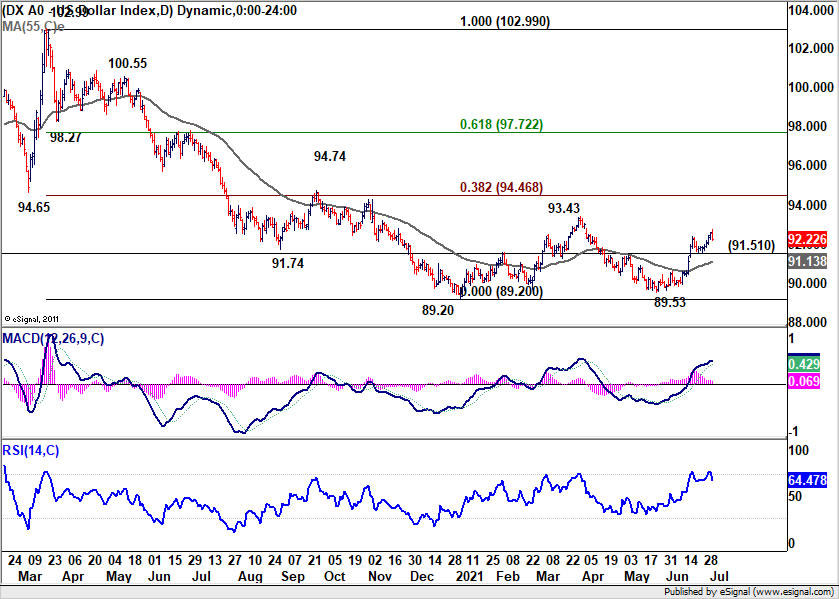
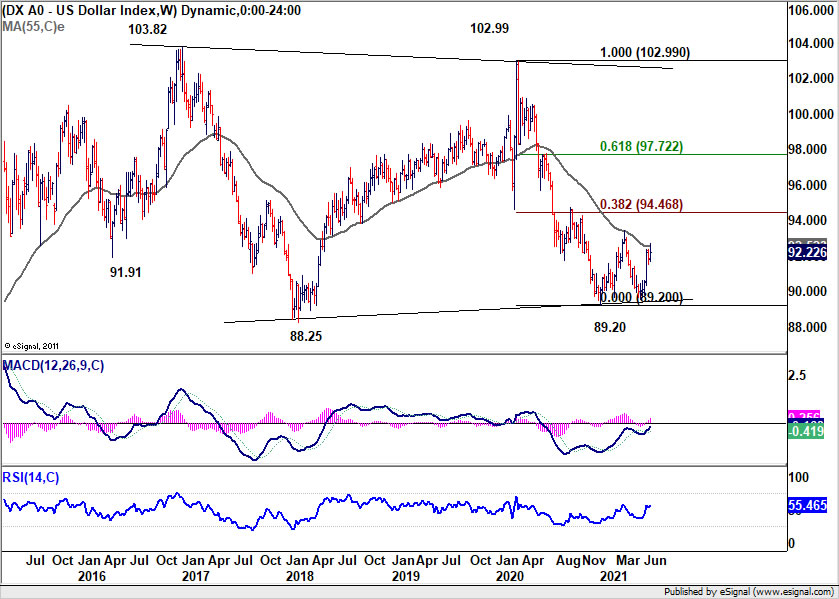
Dollar index failed to extend rally, but more upside still mildly in favor
Dollar's development was rather disappointing, as it reacted more to strong risk-on sentiments much more than the solid NFP report. It's still too early to call an end to the rise from 89.53 as long as 91.51 support holds. Further rally would still be seen to 93.43 resistance and possibly above.
But we'd maintain that rise from 89.53 is seen as the third leg of the consolidation pattern from 89.20. Hence, we'd expect strong resistance from 38.2% retracement of 102.99 to 89.20 at 94.46 at 94.46. to limit upside, at least to extend sideway trading. Break of 91.51 will suggest that such rise has completed prematurely, and bring retest of 89.20/53 support zone.
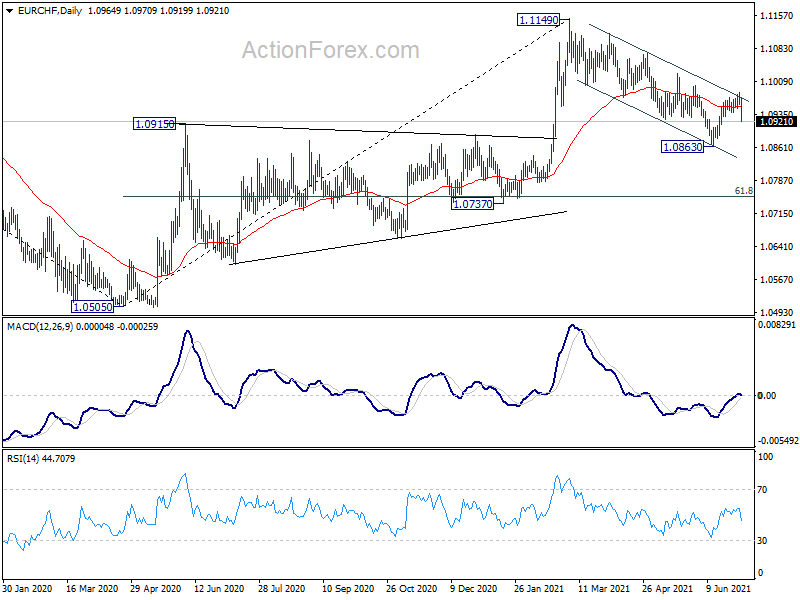
EUR/CHF and EUR/CAD turn weaker, more downside ahead
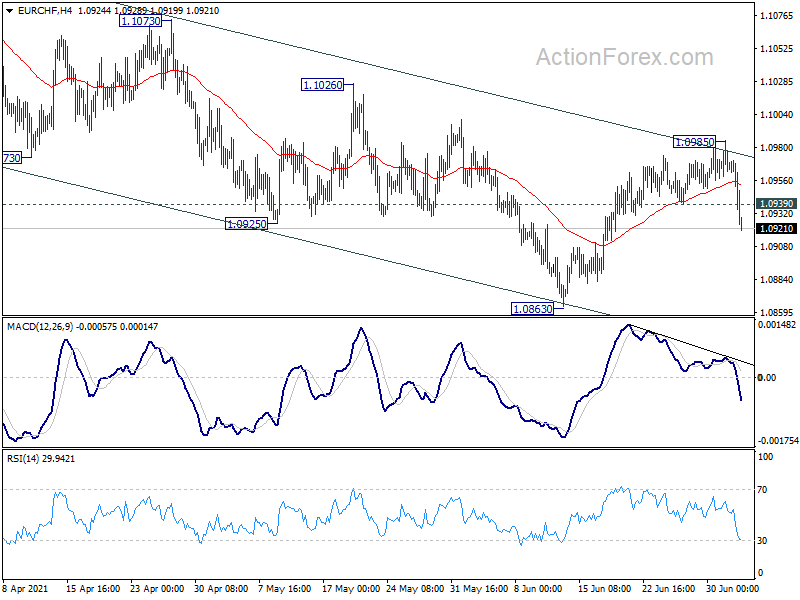
Euro turned notably weaker in some crosses last week. In particular, EUR/CHF's break of 1.0939 support argues that rebound from 1.0863 has completed at 1.0985 already. It's also kept below medium term channel resistance, and struggled to sustain above 55 day EMA. The development argues that choppy decline from 1.1149 is still in progress.
Deeper fall is not in favor for the near term to retest 1.0863 support first. Break will resume the fall from 1.1149 to cluster support level at 1.0737, 61.8% retracement of 1.0505 to 1.1149 at 1.0751.
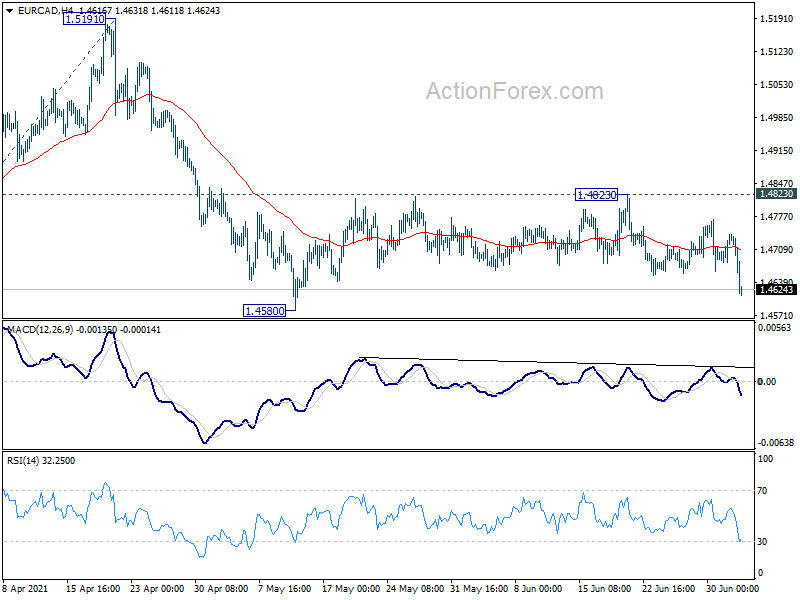
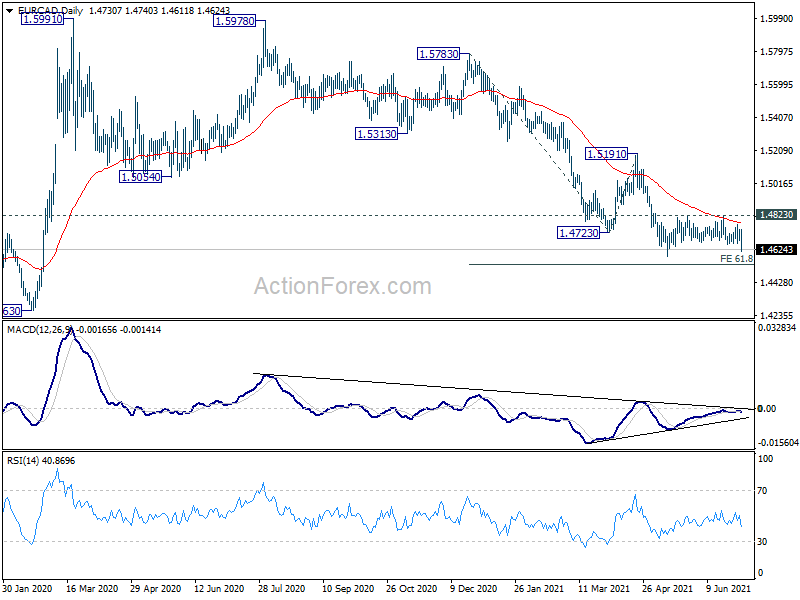
EUR/CAD also dropped notably on Friday and deeper fall is now in favor this week to retest 1.4580 support. The failure to sustain above falling 55 day EMA keeps near term outlook bearish. Break of 1.14580 will confirm resumption of larger decline from 1.5978 and target 61.8% projection of 1.5783 to 1.4723 from 1.5191 at 1.4536. Firm break there could bring further downside acceleration to 1.4263 long term support next.
Canadian Dollar has some upside prospect ahead
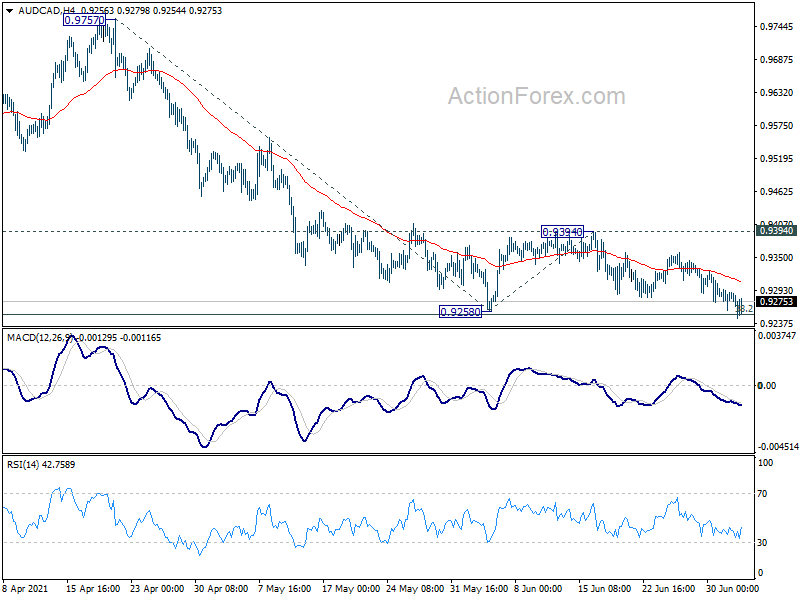
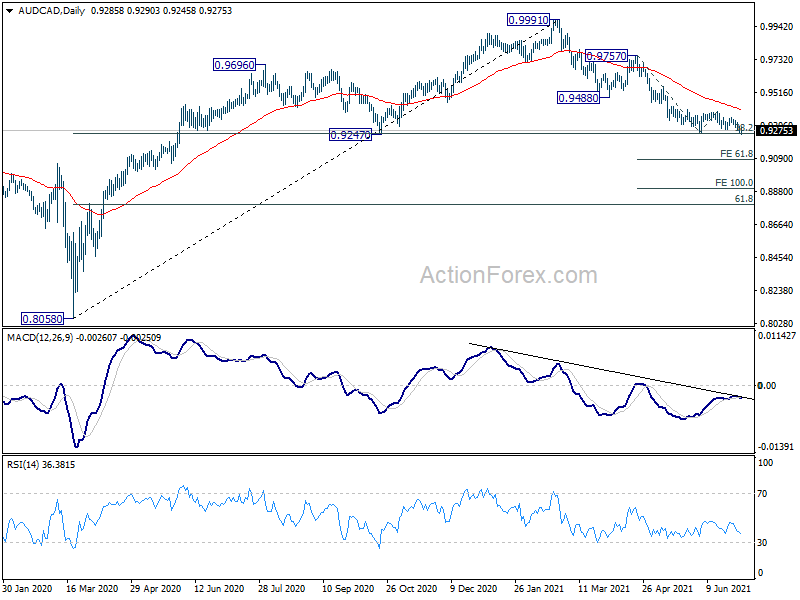
On the other hand, Canadian Dollar has the prospect of turning stronger, with help from persistently strong oil price, BoC tapering expectation. But that would be subject to the upcoming employment data this week. Anyway, AUD/CAD's breach of 0.9258 support argues that larger fall from 0.9991 is resuming. Focus is back on 0.9247 key cluster support level (38.2% retracement of 0.8058 to 0.9991 at 0.9253).
Sustained break of 0.9247/53 will bring some downside re-acceleration to 61.8% projection of 0.9757 to 0.9258 from 0.9394 at 0.9086. There is prospect of even deeper fall to 61.8% retracement of 0.8058 to 0.9991 at 0.8796. Strong rebound from current level, followed by break of 0.9394 resistance will suggest short term bottoming, and bring turn the fortune between Aussie and Loonie.
AUD/USD Weekly Outlook
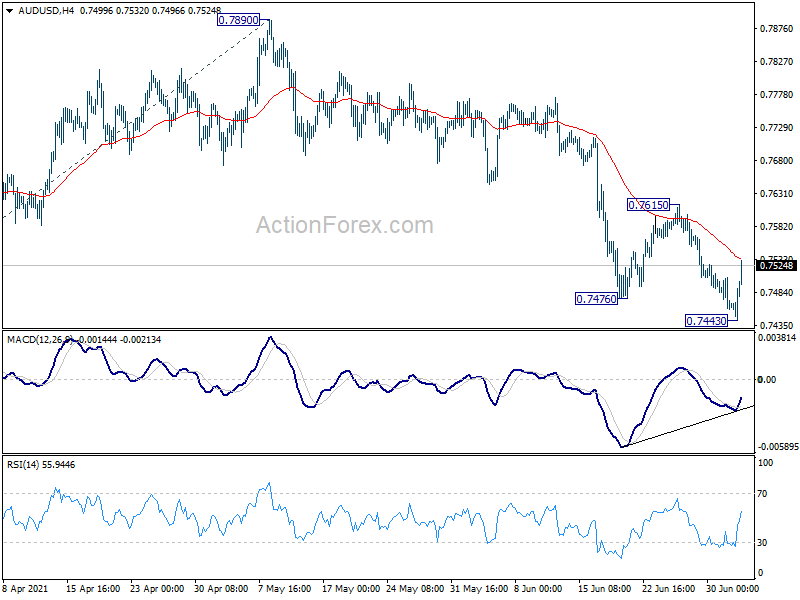
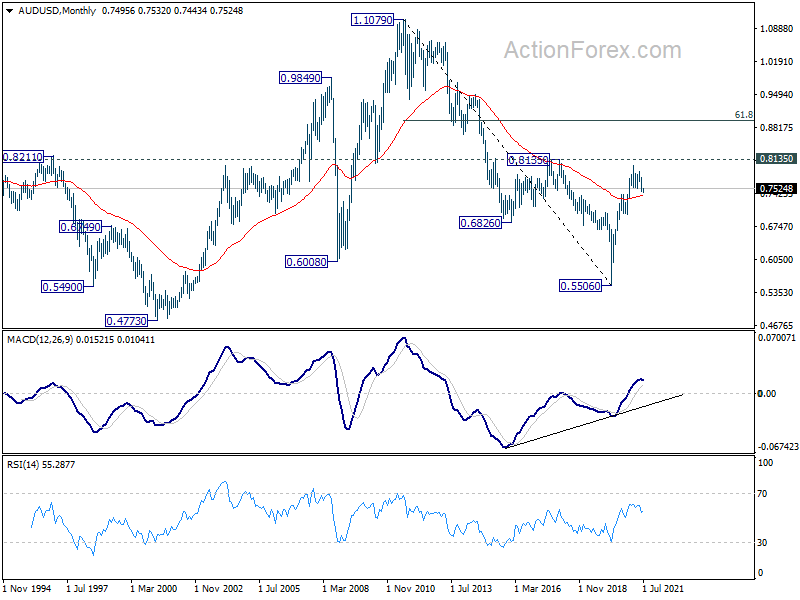
AUD/USD edged lower to 0.7443 last week but quickly recovered again. Initial bias is turned neutral this week first. Another fall could still be seen, and break of 0.7443 will resume the whole corrective pattern from 0.8006. But we'd expect strong support from 100% projection of 0.8006 to 0.7530 from 0.7890 at 0.7414 to bring rebound. On the upside, break of 0.7615 resistance will indicate short term bottoming, on bearish divergence condition in 4 hour MACD. Intraday bias will be turned back to the upside for 0.7890/8006 resistance zone.
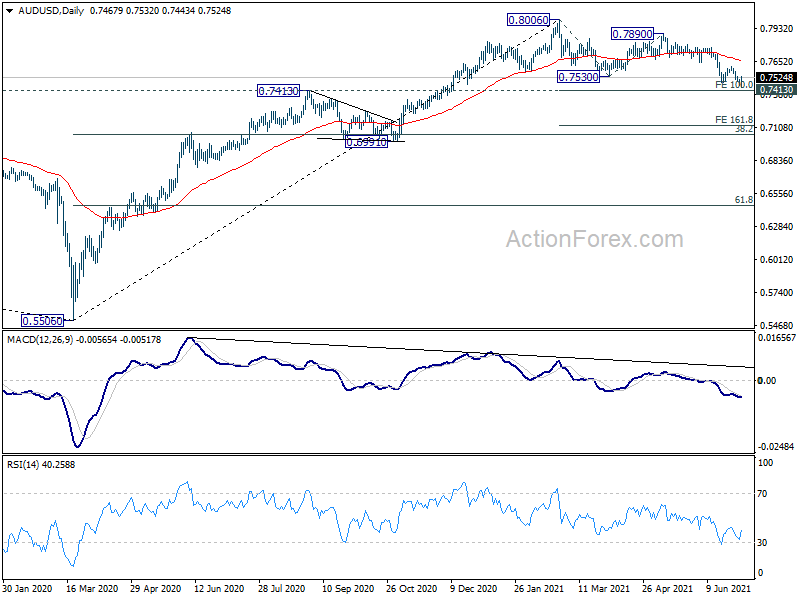
In the bigger picture, rise from 0.5506 medium term bottom could either be the start of a long term up trend, or a corrective rise. Reactions to 0.8135 key resistance will reveal which case it is. Rejection by 0.8135 key resistance, followed by firm break of 0.7413 resistance turned support, will favors the latter case. Deeper decline would be seen to 38.2% retracement of 0.5506 to 0.8006 at 0.7051 first.
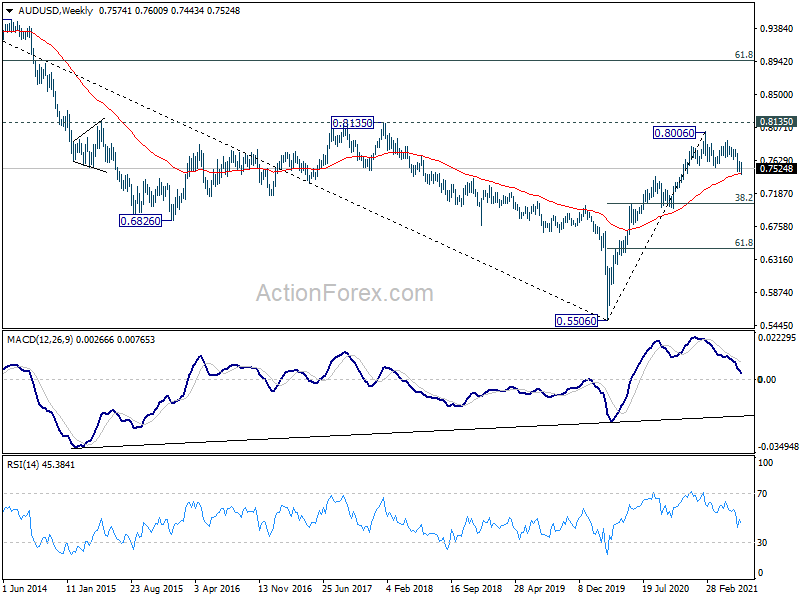
In the longer term picture, 0.5506 is a long term bottom, on bullish convergence condition in monthly MACD. Focus is now back on 0.8135 structural resistance. Decisive break there will raise the chance that rise from 0.5506 is an impulsive up trend. Next target should be 61.8% retracement at 0.8950 of 1.1079 to 0.5506 and above. Though, rejection by 0.8135 will keep the case of medium to long term sideway consolidation open.
Summary 7/5 – 7/9
Monday, Jul 5, 2021
[php_everywhere instance="1"]
Tuesday, Jul 9, 2021
[php_everywhere instance="2"]
Wednesday, Jul 7, 2021
[php_everywhere instance="3"]
Thursday, Jul 8, 2021
[php_everywhere instance="4"]
Friday, Jul 9, 2021
[php_everywhere instance="5"]
Weekly Economic & Financial Commentary: Supply-Side Challenges Continue to Bedevil the Recovery
Summary
United States: Supply-Side Challenges Continue to Bedevil the Recovery
- After coming in below consensus for two months in a row, nonfarm employment surprised to the upside in June, with employers adding 850,000 jobs. The unemployment rate rose to 5.9%.
- The ISM manufacturing index fell to 60.6 in June. Manufacturers continue to report a litany of supply-chain challenges: lengthening delivery times, persistent component shortages, staffing difficulties and rising prices. The prices paid series rose 4.1 points to 92.1, its highest reading since 1979.
- Consumer confidence and buying plans both rebounded in June, but shortages of automobiles, new and existing homes, household appliances and a whole host of other items continue to weigh on the recovery. Pending home sales surged 8% in May, pointing to an end to the recent slide in existing home sales.
- Next week: ISM Services Index (Tuesday), JOLTS Job Openings (Wednesday), FOMC Minutes (Wednesday)
International: Eurozone Economy Looks Forward to Brighter Days Ahead
- Firming confidence surveys and rising retail sales point to better days ahead for the Eurozone economy. Canada's GDP declined in April but may be close to bottoming out, while in Japan, the economic recovery looks to be struggling to gain any momentum.
- Next week: Australia monetary policy announcement (Tuesday), Brazil CPI (Thursday), U.K. GDP (Friday)
Credit Market Insights: C&I Lending Declines: Not Worth Losing Sleep Over
- After experiencing double-digit growth in three out of four quarters in 2020, the year-over-year declines seen in commercial & industrial (C&I) lending in April and May may look disappointing, but there is no reason to worry yet.
Topic of the Week: Fourth of July Means Elevated Spirits...and Prices
- This Independence Day marks the first large gathering for many families and friends after more than a year of social distancing. Continuing with the theme of 2021, it will not come cheap.
U.S. Review
Supply-Side Issues Continue to Restrain Growth
Nonfarm employment finally broke out to the upside, with employers adding 850,000 jobs in June. Revisions to the prior two months' data were fairly small, resulting in 15,000 more jobs. Job gains were fairly broad based during June, but the reopening of public schools at a time that they would normally be closing for the summer led to an outsized gain in state (74,500) and local education jobs (155,200). Without these gains, which were exaggerated by seasonal adjustment, nonfarm payrolls would have added 620,300 jobs and marked the third disappointment in a row.
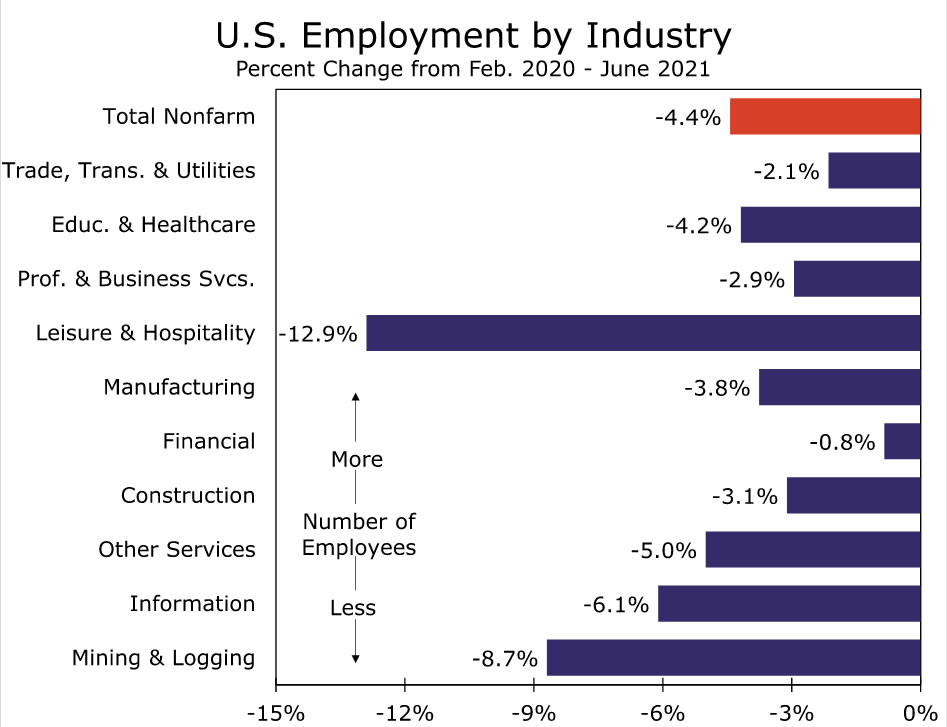
Much of the growth in jobs has come from the industries hit hardest during the lockdowns at the start of the pandemic. The leisure & hospitality sector added back 343,000 jobs, while hiring in retail trade (67,100), administrative services (40,000), social services (32,400) and other services (56,000) all rose vigorously. These five sectors lost 14.5 million jobs at the onset of the pandemic, accounting for roughly 65% of the overall job loss. The five sectors have since recovered 75% of those losses. From a broader perspective, the overall economy lost 22.4 million jobs from February to April 2020 and has since recovered 70% of those job losses.
Manufacturers added 15,000 jobs in June, with all the gain coming in durable goods. Steel and fabricated metals both rose sharply, while furniture & related products saw industry payrolls add 8,500 jobs. Employment in the motor vehicle industry fell sharply, with payrolls declining by 12,300 jobs. The shortfall likely reflects the fallout from the semiconductor shortage, which has limited motor vehicle assemblies. The chip shortage is reportedly easing somewhat, which may lead to outsized gains in July and August, when assembly plants usually shut down for model year changeovers. Construction payrolls declined by 7,000 jobs with big losses in nonresidential specialty contractors (-14,800) and heavy & civil engineering (-10,900) more than accounting for the overall drop. By contrast, hiring among residential and specialty trade contractors (12,700) and residential builders (2,500) remains strong.
The unemployment rate rose 0.1 percentage point in June to 5.9%. The household employment measure fell by 18,000 in June, while the labor force rose by 151,000. Both the labor force participation rate (61.6%) and the employment-population ratio (58%) were unchanged in June. The lackluster results from the household survey suggest the decision by many states to end their participation in the expanded federal unemployment benefits program has, so far, had little impact in bringing workers back to the labor market. However, the June report, which reflects employment conditions in early to mid-June, likely came too early to pick up the re-entry of these job seekers.
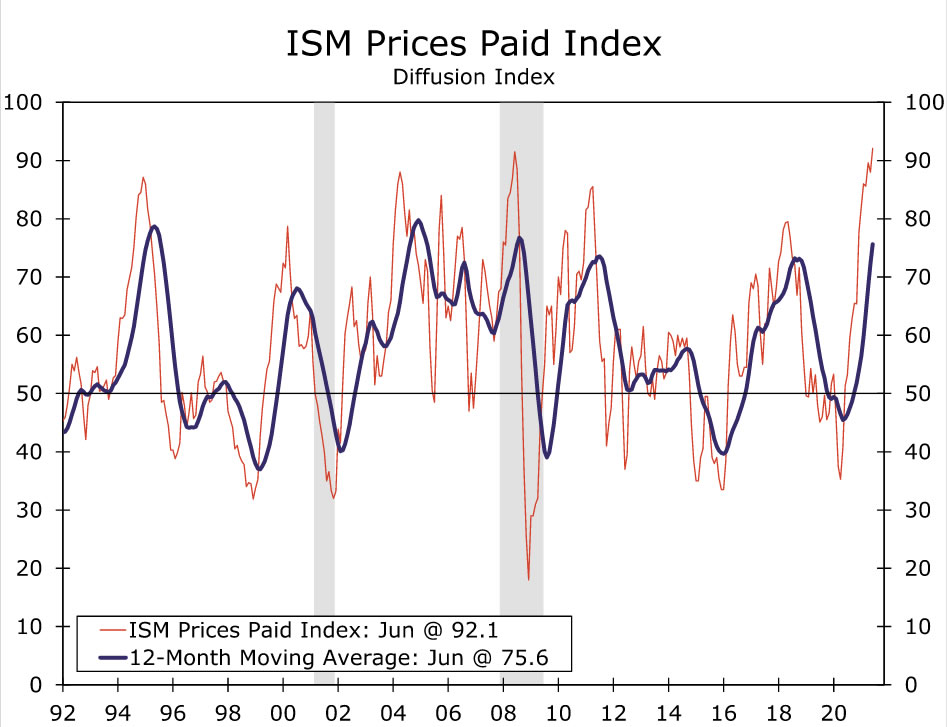
Manufacturers are still dealing with momentous supply-side challenges. The ISM manufacturing index fell slightly in June, but remains consistent with strong economic growth. The ISM manufacturers index is a diffusion index that tells us more about the breadth of the strength in the factory sector rather than the magnitude. The latest data show manufacturers are struggling to keep up with demand. The production index rose 2.3 points in June to 60.8, while the more leading new orders index fell 1.0 point to a still exceptionally high 66.0. That reading suggests two-thirds of manufacturers saw orders increase in June. The proportion of manufacturers with rising order backlogs fell 6.1 points to 64.5. Again, the monthly drop is far less important than the still historically high proportion of manufacturers that report rising order backlogs. Manufacturers report shortages of a growing list of components and also noted persistent challenges finding and retaining the workers they need. The prices-paid index rose 4.1 points to 92.1, which marks the highest proportion of manufacturers reporting paying higher prices since July 1979. The breadth of price increases and intransigence of supply-chain bottlenecks suggest the recent spike in inflation will likely prove to be sharper and more persistent than the Fed has expected.
Weekly first-time unemployment claims fell sharply during the latest week. Most of the states that have opted to pull out of the expanded federal unemployment benefits program early have seen sharp declines in initial claims in recent weeks, suggesting we should see more workers return to the workforce in coming months, paving the way for stronger job growth and some easing in wage increases.
Pending home sales came in surprisingly strong in May, rising 8%. Consensus forecast had called for 1% decrease. The rise in pending sales, which reflect signed purchase contracts, suggests the recent slide in existing home sales is coming to an end. This past week also showed home prices continue to rise rapidly across most of the country, with the S&P CoreLogic Case-Shiller National Home Price Index rising 1.6% in April and 14.6% over the past year, which is the largest year-over-year gain ever recorded. The 20-City index rose an even larger 14.9% year-over-year. Phoenix, which has seen strong population and employment growth this past year, again posted the largest year-over-year gain, with prices soaring 22.3%. Five metro areas—Charlotte, Cleveland, Dallas, Denver and Seattle—also posted their largest year-over-year gains this past month.
U.S. Outlook
ISM Services Index • Tuesday
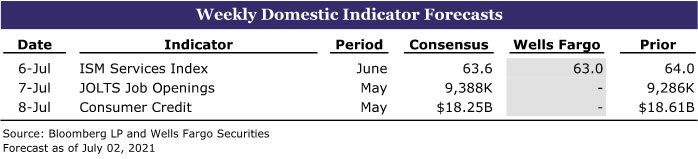
The service sector is soaring as further vaccination progress is made and more of the U.S. economy reopens. The ISM services index jumped to 64 during May, which is the high-water mark since records first started in the late 1990s. Like many other areas of the economy, supply has not kept pace with skyrocketing demand for services, which has resulted in upward price pressures. The prices paid component of the index rose to the second-highest reading on record. The hiring index declined 3.5 points in May, which is a reminder that service providers are also having trouble filling open positions. Looking ahead, service sector activity is likely to remain strong. During May, virtually every service industry reported overall growth, increasing business activity, and an increase in new orders. That said, abounding supply constraints are likely to take some air out of the index in coming months. Bearing that in mind, we look for the ISM services index to slip to 63.0 in June.
JOLTS Job Openings • Wednesday
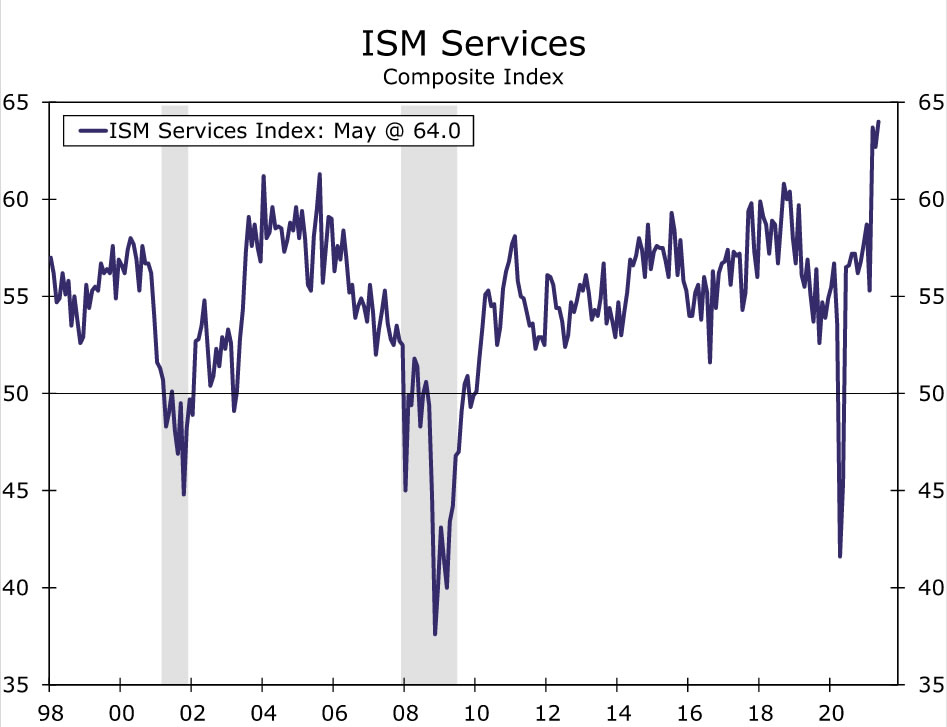
We do not forecast the Job Openings and Labor Turnover Survey (JOLTS) on a monthly basis. The JOLTS, however, is likely to receive increased attention from market participants next week as labor shortages have emerged as a major impediment standing in the way of even stronger economic growth. During April, job openings rose to 9.3 million, which marked a record high. The survey confirmed that staffing open positions has become a challenge for many businesses across a wide array of industries. More workers appear to be voluntarily leaving their jobs, which suggests the labor market may be tighter than other measures indicate. The quits rate increased to a series high of 2.7%. Considering other surveys, such as the NFIB small business survey and ISM manufacturing and services indexes, continue to report that companies that are trying to hire, yet can not find the workers to do so, it would not be surprising to see the JOLTS come in at the market consensus of 9.34 million job openings in May.
FOMC Meeting Minutes • Wednesday
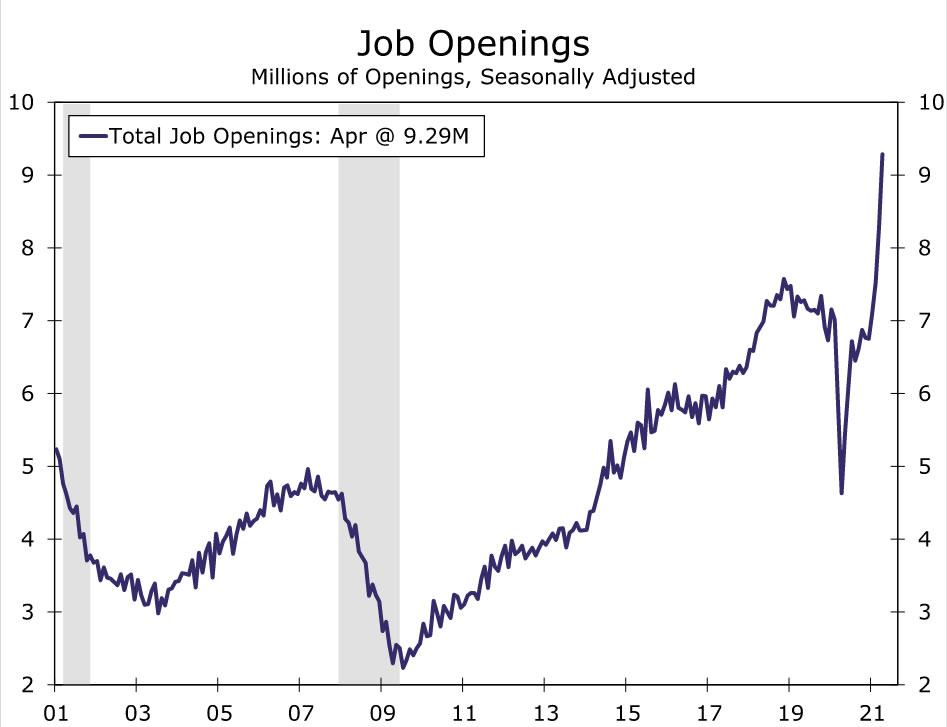
The FOMC made no substantive policy changes during the June 16-17 meeting. The committee maintained its target range for the fed funds rate between 0.00% and 0.25%, and kept its monthly pace of asset purchases unchanged. Despite leaving monetary policy essentially untouched, officials indicated that initial discussions took place on how and when to potentially start tapering bond purchases. Market participants will likely be looking through the minutes of the meeting for clues on when this process might get started. The FOMC also raised its inflation forecast for 2021, and the minutes may provide additional insights on just how "transitory" members view recent inflationary trends. Similarly, seven of the 18 committee members indicated through the "dot plot" that they expect rates to be higher at the end of next year, and 13 members look for higher rates at the end of 2023. The minutes could reveal the extent to which FOMC officials are debating moving toward tightening.
International Review
Eurozone Economy Looks Forward to Brighter Days Ahead
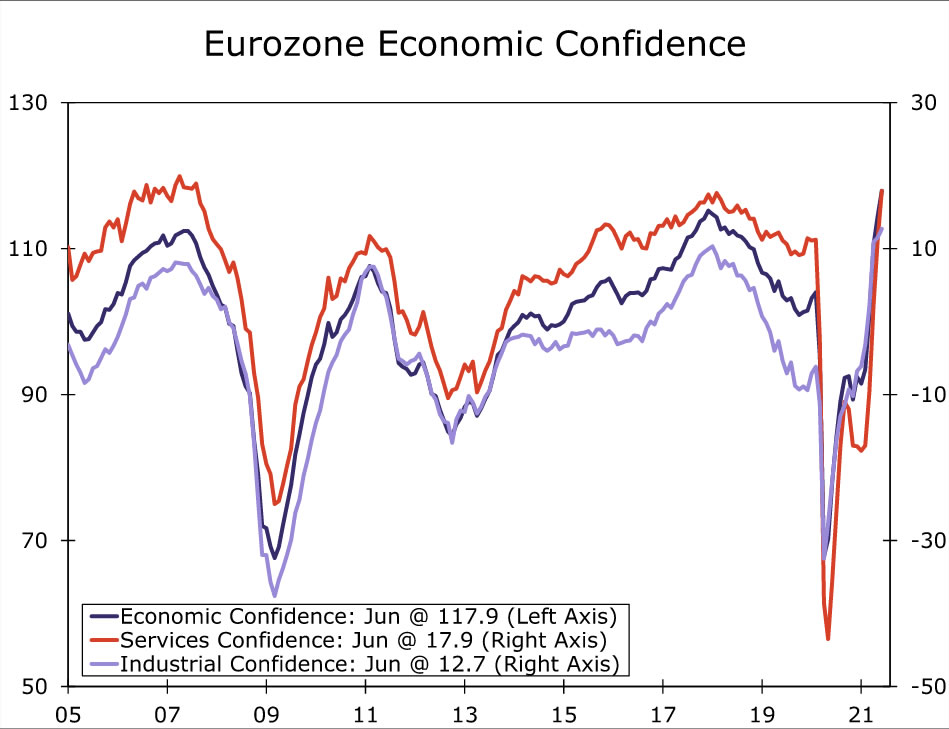
This week's news from the Eurozone was generally favorable in terms of the region's economic prospects. Of particular note, Eurozone economic confidence rose more than expected to 117.9 in June, the highest level in more than two decades. The evidence of economic reopening was apparent in the services confidence component, which jumped to 17.9 in June from 11.3 in May, whereas the increase to 12.7 in industrial confidence in June was more modest. Meanwhile, important activity data also offered encouraging evidence of the economic impact of reopening. German May retail sales rose 4.2% month-over-month, reversing a sizable portion of April's sales decline, while French household consumption rose 10.4% month-over-month, more than reversing the April fall. Given these favorable economic indicators, we view the risk to our Eurozone full-year GDP growth forecast of 4.3% as tilted to the upside.
Separately, while surveys have indicated some supply shortage and bottlenecks, inflation pressure at the consumer price level remain reasonably contained for now. In June, the headline CPI eased to 1.9% year-over-year, while the core CPI also eased to 0.9% year-over-year. Inflation trends will almost certainly quicken in the coming months due to base effects, given the comparison with unusually low price readings in Q3-2020. Nonetheless, even with some pickup in prices likely in the months ahead, the extent of inflation pressures across the Eurozone appears likely to be much less than those currently being experienced in the United States, for example.
Canada's Economy Might Be Close to Bottoming Out
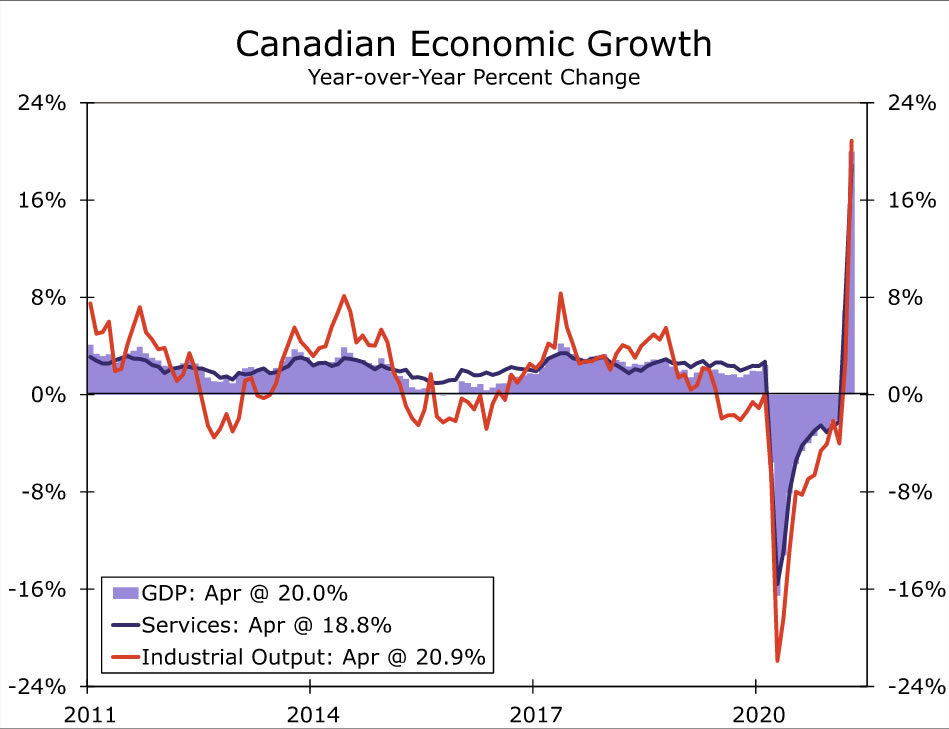
The economic news from Canada was steady rather than strong. That said, there are hints from this week's data the economy may be passing the worst effects of recent COVID-related restrictions, with hopes that GDP growth could soon resume. Canada's GDP fell 0.3% month-over-month in April, much less than expected, while March was also revised higher to show a gain of 1.3%. In terms of the details, services activity fell 0.6% month-over-month in April, with noticeable declines in retail trade (-5.5%) and accommodation & food services (-4.6%). Manufacturing activity also fell, while mining, quarrying & oil and gas activity rose. With respect to May, Statistics Canada's early estimate is for a further decline of 0.3% month-over-month. Still, that would mean GDP for the April-May period would be 0.6% above the Q1 average, with hopes that economic growth will soon resume. Overall, we see little in these figures that would alter the central bank's monetary policy path. We still expect the Bank of Canada to slow its pace of bond purchases further at its July monetary policy meeting.
Economic Sun Still Struggling to Rise in the East
This week's news from Japan suggests that country's economic recovery remains in a challenging phase. The Bank of Japan's Tankan survey—a closely followed barometer of the economy—showed a Q2 increase in the large manufacturers' diffusion index to +14 from +5 in Q1, a bit less than expected. Meanwhile, the large non-manufacturers' diffusion index edged only slightly higher to +1 in Q2, from -1 in Q1. Activity data also remained subdued as a state of emergency was in effect in Tokyo, Osaka and surrounding regions during much of the second quarter. May retail sales dipped 0.4% month-over-month, falling further after a 4.6% slump in April. Meanwhile, May industrial output fell 5.9%, more than reversing the gain seen in April. With the Tokyo Olympics scheduled to proceed with limited spectators, even that is unlikely to provide much of a boost to activity in the months ahead. As a result, we expect Japan to be a laggard among the major economies in terms of GDP growth in 2021. Finally, June PMI surveys from China continued to point to an up-and-down performance from that economy through much of this year. The June manufacturing PMI eased broadly as expected, dipping to 50.9, but the services PMI was a negative surprise, unexpectedly declining to 53.5.
International Outlook
Australian Monetary Policy Announcement • Tuesday
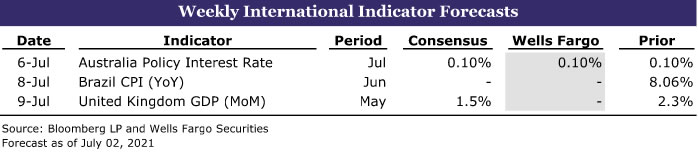
The Reserve Bank of Australia (RBA) announces its latest monetary policy decision next Tuesday, an announcement that will likely be followed more closely than usual, given the RBA has previously signaled it would provide an update on its bond purchase plans.
With respect to its policy interest rate, we see no change and expect the Cash Rate to remain at 0.10%. Regarding the bond purchase plans, we expect the RBA to also maintain the target for three-year government bond yields at 0.10% but to shift the targeted purchase bond for that target to the November 2024 bond. Tactically, we believe it is sensible for the central bank to continue with this program as it is somewhat flexible and contingent in nature and obligates the central bank to an ongoing steady series of bond purchases.
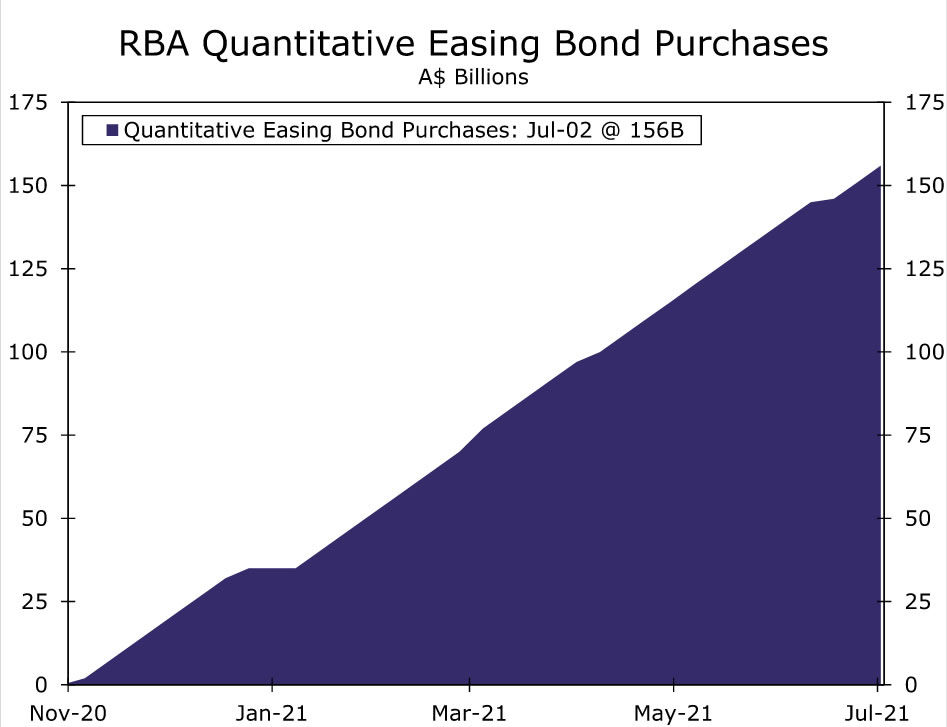
Regarding the central quantitative easing program, we do not expect the RBA to expand purchases beyond the current A$200 billion limit. The economy has shown solid growth during early 2021, and even with multiple COVID outbreaks in recent weeks that could weigh on growth temporarily, we do not see Australia's economy needing support from ongoing quantitative easing. Our base case is for the RBA to announce the end of quantitative easing by September 2021, as scheduled. We also acknowledge there is a (relatively slight) risk that the central bank could slow the pace of bond purchases, such that the program could continue slightly longer, perhaps until December 2021. In either case, we do not expect the RBA to announce further bond purchases beyond the current A$200 billion target.
Brazil CPI Inflation • Thursday
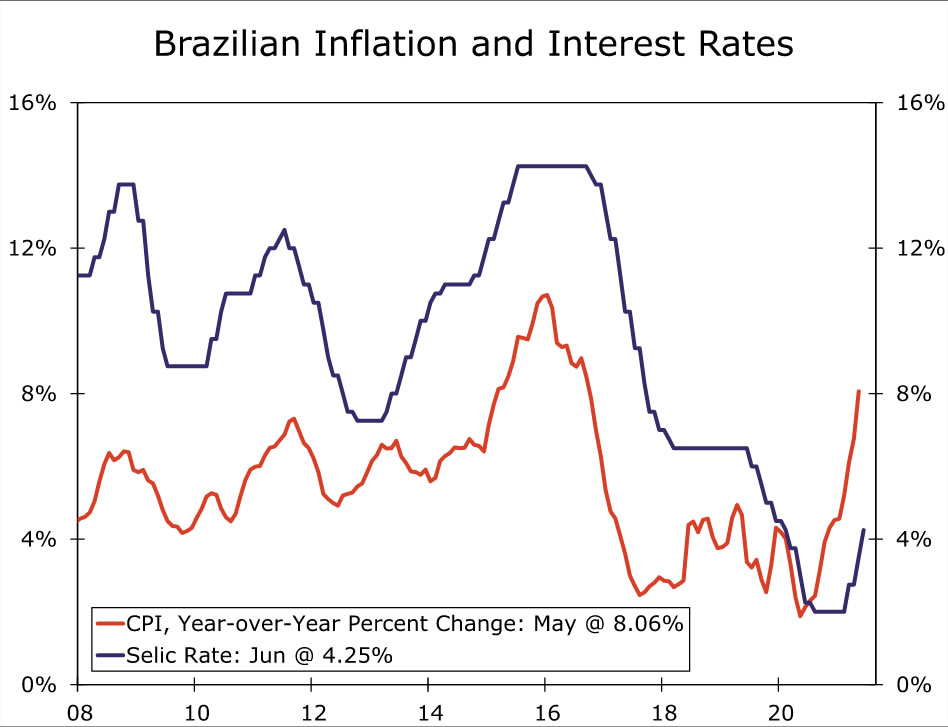
Next week's CPI inflation figures from Latin America will likely support the case for further interest rate increases from the region's central banks. In Brazil, CPI inflation has risen sharply this year, reaching 8.06% year-over-year in May. Higher prices for electricity and fuel, food, and household goods, have been important drivers of the pickup of inflation. Given the relatively modest increase seen in June 2020, base effects hint at a further quickening in year-over-year inflation in June 2021. Against that backdrop and considering the hawkish bias of Brazil's central bank, we currently anticipate a 75-bp rate increase, and perhaps more, from the central bank at its early August meeting.
Mexico's CPI inflation has also been elevated this year, albeit not quite to the same extent. The May CPI rose 5.89% year-over-year, with higher energy prices and core inflation for both food and non-food goods contributing. For June, Mexico's CPI inflation could ease slightly but will likely remain elevated. Those elevated inflation readings contributed to the Bank of Mexico's surprise with a 25-bp rate increase at its June announcement. While we expect further tightening in 2021, it's not clear the next increase will come as soon as the Bank of Mexico's August meeting.
United Kingdom GDP • Friday
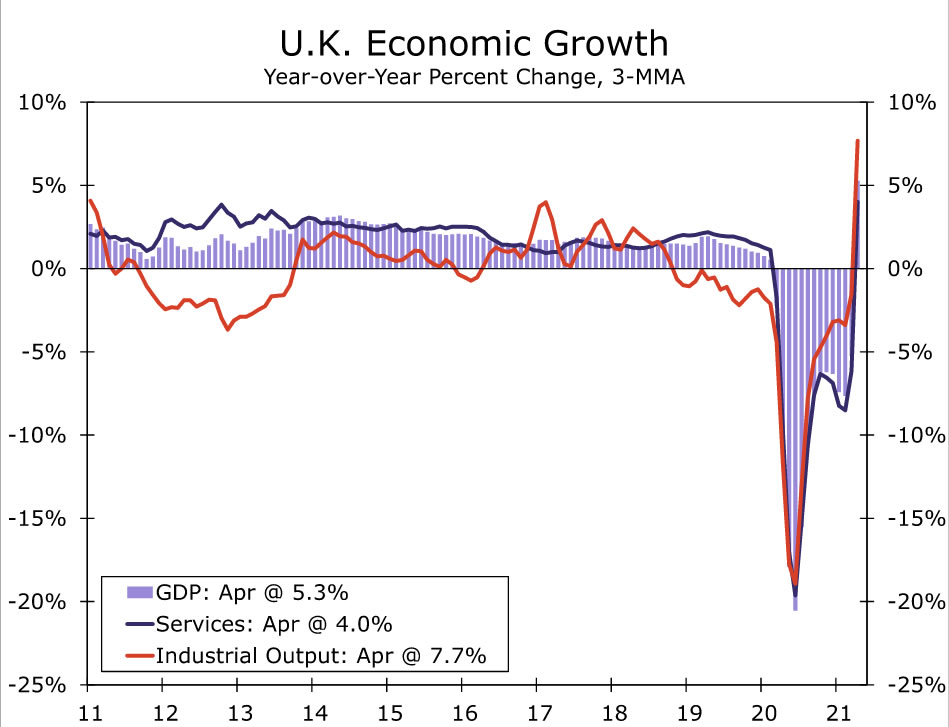
After a stumble at the beginning of 2021, the U.K. economy has enjoyed an impressive rebound in recent months, an expansion we think likely continued in May. Since the most recent low in January, U.K. GDP has risen a cumulative 5.2%, including a 2.3% month-over-month gain in April. For May, the consensus forecast is for a further increase in GDP, by a relatively solid 1.9% month-over-month. An expected fall in U.K. May retail sales does point to a somewhat smaller rise in services activity in May than the previous month of 2.0%. Meanwhile, May industrial output is expected to rise by 1.8%.
More recently, the U.K. government paused its reopening plans by around a month, from late June to late July. While that pause could also weigh temporarily on growth, we believe any impact would be modest. In fact, for full-year 2021, we believe the risks to our U.K. GDP growth forecast of 7.0% are tilted to the upside, and we still think the Bank of England is on course to slow the pace of its bond purchases further at its August meeting.
Credit Market Insights
C&I Lending Declines: Not Worth Losing Sleep Over
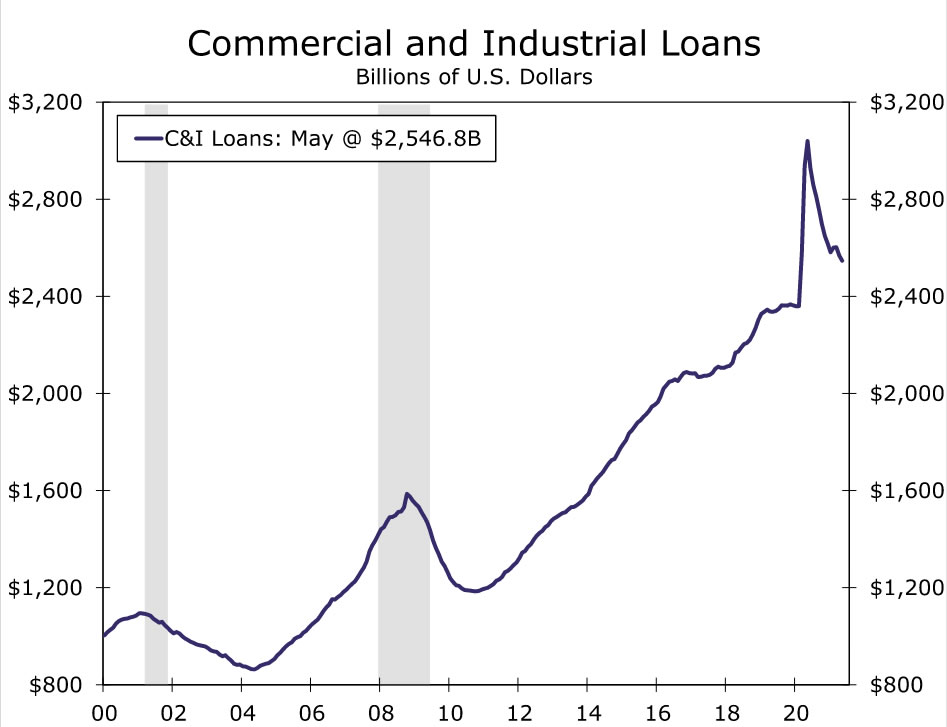
After experiencing double-digit growth in three out of four quarters in 2020, the year-over-year declines seen in commercial & industrial (C&I) lending in April (-12.6%) and May (-16.2%) may look disappointing, but there is no reason to worry yet. Due to base effects, these year-over-year measures are somewhat distorted. The summer months last year saw a surge in lending as businesses rushed to receive Payment Protection Program (PPP) loans. These loans were designed to keep businesses afloat by offering government forgiveness as long as the money was used to keep employees on, pay mortgage interest, rent and utilities. The first round of loans ran from April to August 8, 2020, but through the end of May, SBA data show around 97% of the total first round funding was already distributed. C&I lending data moved in-step with these swings, with the two largest month-over-month gains in its history. Lending in March 2020 jumped 9.2% and surged 14% in April. For reference, the biggest monthly gain before last year was 5.6%, which occurred almost 70 years ago in January 1952. The current level of loans remains elevated at almost 8% above that of February 2020 (see chart).
Unflattering base effects are not the only factor driving the recent declines in C&I lending, as demand has also decreased. According to the Senior Loan Officer Opinion Survey (SLOOS), a modest share of banks reported weaker demand from large and middle-market firms, while demand from small firms was relatively stable. The transition away from bank loans can largely be attributed to healthy balance sheets for small & medium-sized businesses and alternative means of raising capital through the wide-open corporate bond market for larger businesses. Small & medium-sized businesses still have ample liquidity, as checking deposits and currency as well as total time and savings deposits have soared for non-financial non-corporate businesses, and respectively sit at 26.7% and 10.1% above Q1-2020 levels. SLOOS also cited decreases in customer investment in plants or equipment, precautionary demand for liquidity and account receivable needs as reasons for the lower demand.
As firms chip away at savings and need additional funds, there should be a shift to more typical lending patterns. Banks have become significantly more willing to lend this year, with almost 25% reporting an increased willingness to lend in Q1. A moderate share of banks also saw a higher number of inquiries from potential borrowers around availability and terms for new credit lines or increasing existing credit lines.
Topic of the Week
Fourth of July Means Elevated Spirits...and Prices
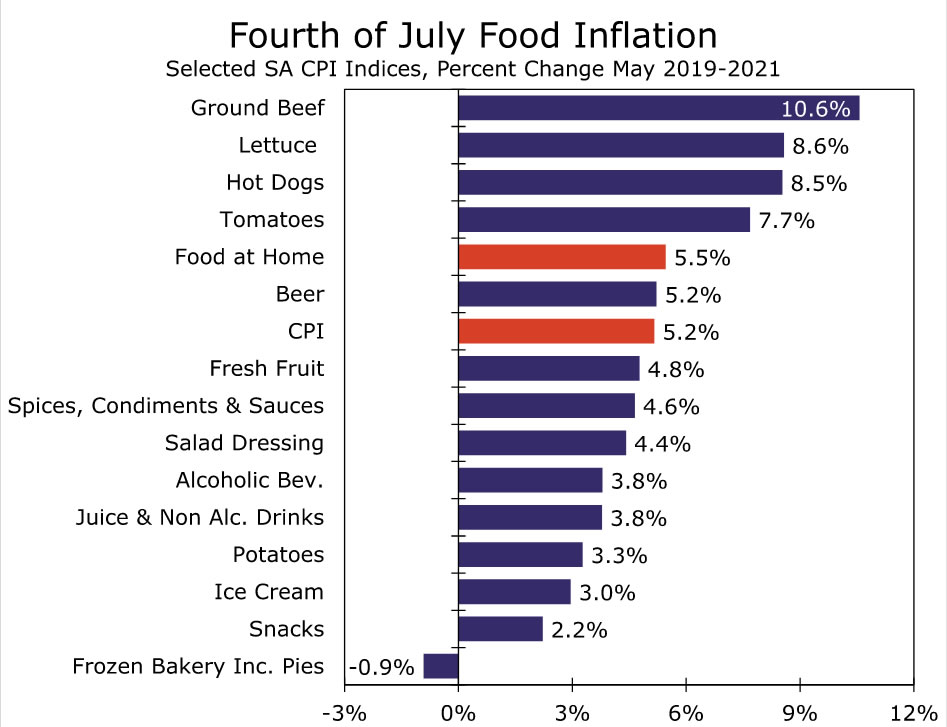
This Independence Day marks the first large gathering for many families and friends after over a year of social distancing. But continuing with the theme of 2021, it will not come cheap. Compared to last year, this year's cookout may seem like somewhat of a bargain—the American Farm Bureau Federation estimated the average cookout cost for 10 people to be $59.50 in 2021, whereas the 2020 cost was $59.66. However, the more apt comparison is to the pre-pandemic barbecues of 2019, since supply-chain woes started in the spring of 2020, and there were limited gatherings last summer. By this measure, it is clear that prices for cookout essentials remain notably above their pre-pandemic levels, with America's favorite, the hamburger, topping the list (see chart). Another summer staple, hot dogs, also will cost 8.5% more than pre-pandemic levels. Prices for toppings such as lettuce and tomatoes are elevated as well. Washing down your meal with a cold one will also cost more than pre-COVID, as beer prices have risen by 5.2%. The USDA estimated the cost of a fully-dressed cheeseburger to be $1.89 this May compared to $1.78 in May 2019. Eleven cents may seem small, but it is big in percentage terms and adds up when including extended family, friends and, of course, second helpings.
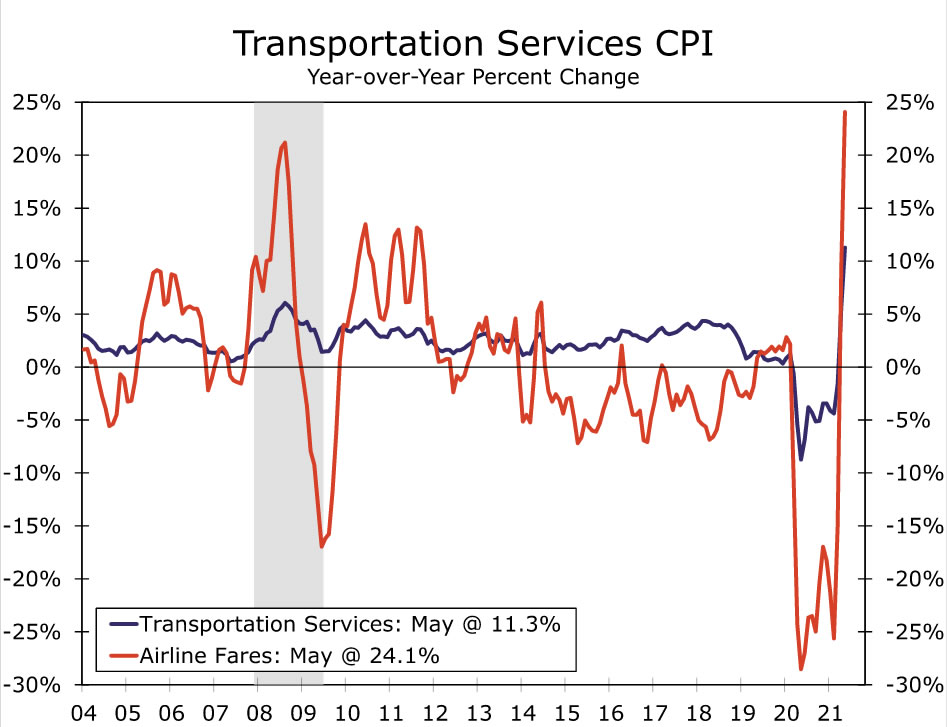
It is not just the celebration itself that will make a dent, but also getting there has become costly. Transportation services prices, which include items such as car rentals, motor vehicle upkeep, public transportation and airfare, have increased significantly since the start of the year and have surpassed pre-pandemic levels by 1.6%. Car and truck rentals have seen the largest increase, as prices were 56.3% higher in May than at the start of the year, but airline fares have also made a steady recovery with prices up 12.4% and have a more significant weighting for the category. The national average price of a gallon of gasoline was $3.13 on July 1 of this year, which is around 40 cents higher than a gallon two years ago. Even the entertainment this year may cost an extra couple of bucks. Disruptions in the global supply chain have left many fireworks suppliers not fully stocked, and increased shipping costs have also had to be passed on to consumers.
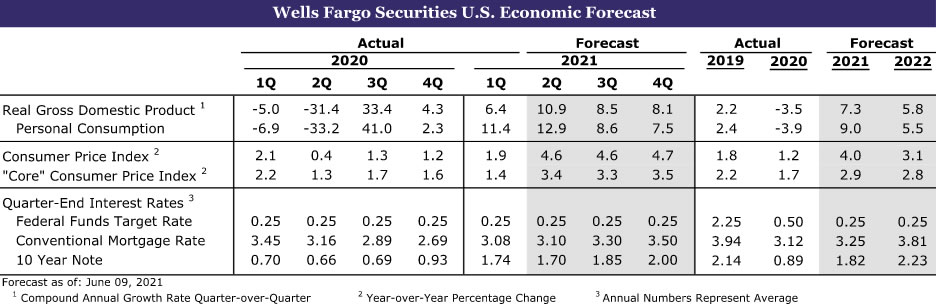
Many consumers are likely willing to pay these new prices, especially after having to forego plans last year, but an expensive Independence Day is just a symptom of the higher inflation seen throughout the economy. We expect the CPI to run above 4% year-over-year through the first quarter of 2022, so higher costs, and holidays, will likely stick around in the near-term. But as baseline comparisons and bottlenecks fade, we see a slowdown starting in Q2-2022.
The Weekly Bottom Line: Pleasant GDP Surprise For Canada’s B-Day
U.S. Highlights
- Inflation fears have taken a breather in recent weeks, but the jury is still out on how temporary price pressures are.
- Today’s jobs report showed further solid progress. While better employment and wage gains may reinvigorate inflation fears, it would ultimately mean that the labor market is catching up with the economic expansion.
Canadian Highlights
- Canada got some good economic news to kick off the summer. Its economy was not as hard hit from the third wave of the pandemic as previously feared. GDP in April only declined by 0.3%.
- Still, April’s contraction was the first since April 2020 and Statistics Canada estimated another 0.3% decline in May. Weakness was concentrated in high-touch and manufacturing industries.
- The recent setbacks are likely to be temporary. Restrictions are being lifted and the vaccination rollout is progressing at an impressive rate. The Bank of Canada is monitoring developments as it considers reducing monetary stimulus in July.
U.S. - Employment Growth Is Catching Up
The last week of the quarter started in a risk-off mood as the Delta variant forced Australia and some Asian countries impose stricter controls. In the U.S. the spread of the variant seems to be isolated to several counties, but regions with lower vaccination rates may still face renewed restrictions should more cases translate into higher hospitalization rates. By mid-week, however, markets brushed aside the remaining shreds of gloom, pushing stocks to close higher for the fifth consecutive quarter and a strong start to the new month.
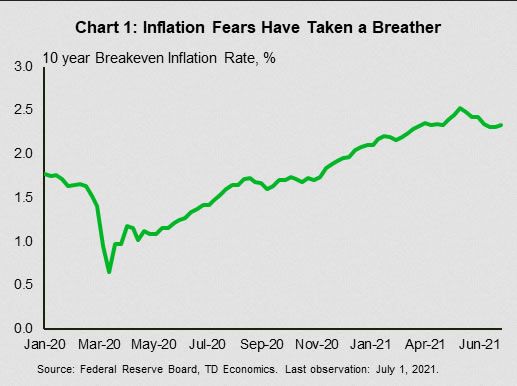
Inflation fears, too, seem to have taken a breather. Inflation expectations as measured by 10-year break-even rates pulled back in the last a few weeks (Chart 1). For the time being, markets seem to have adopted the view that price pressures are mostly temporary, and will reverse next year.
Yet the jury is still out on how temporary these price pressures are. In this week’s post, economists of the Federal Reserve Bank of Dallas provided an outlook on their trimmed mean PCE inflation rate, which excludes the most extreme price changes. In their view, the imbalances in a small set of PCE items have the potential to seep into a broader range of goods and lead to an upward move in prices. If this were to happen, the trimmed mean PCE inflation would increase to 2.4% by year-end 2022 and remain at that level through mid-2023. (Although relative to past periods of high inflation, this is fairly benign, particularly since Fed is targeting an average)
Meantime, prices paid by producers continue to climb. The June’s reading of the ISM manufacturing price sub-index jumped 4.1 percentage points, registering 92.1 – the index’s highest reading since July 1979 (93.1). Yet, the overall index declined with a 3.7-point drop in the supplier deliveries index driving the decrease. Furthermore, the backlog of orders index dropped by 6.1 percentage points, suggesting supply chain disruptions might be finally abating. A more sustained downward trend in these two sub-indexes may push the prices index lower in the coming months.
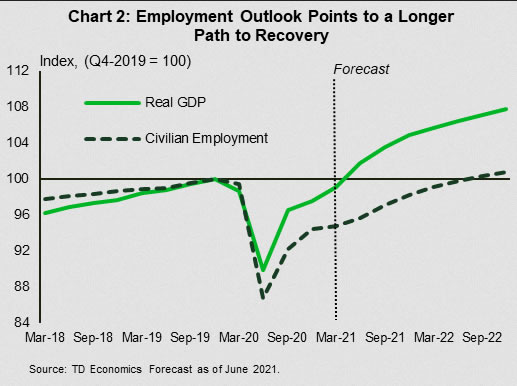
Another reason for markets’ recent tepid view of inflation is that investors are paying a closer attention to labor slack. Measured by employment, economic weakness is more apparent. While real GDP is expected to surpass its pre-pandemic peak in the second quarter of 2021, employment is on a much longer path to recovery (Chart 2). In this context, today’s report shows further progress. TD Economics expects continued gains through the third quarter as schools return to in-person learning and supplementary unemployment benefits expire. The economy added 850K jobs in June, above market expectations, while data revisions added another 15K, lifting the employment gap to 4.4% relative to its pre-pandemic level.
Should the pace of job creation remain strong over the summer, and could reinvigorate inflation fears in the coming months, but ultimately, this would mean that the jobs growth is finally catching up with the economic expansion..
Canada - Pleasant GDP Surprise For Canada's B-Day
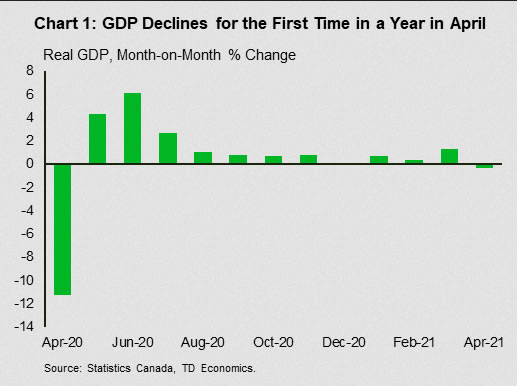
Canada received good economic news in the week of its 154th birthday. Real GDP growth, which markets expected to decline by 0.8%, only fell by 0.3% on the month. Moreover, Statistics Canada revised up growth in March, resulting in a solid starting point for the second quarter. Indeed, even though Statistics Canada's advance estimate for May pointed to another 0.3% decline, quarterly growth is now tracking in the range of 2.5% to 3%, almost a percentage point above our June forecast.
Still, it's hard to ignore the fact that GDP did decline for the first time in a year in April, and will likely fall further in May (Chart 1). The impact of the third wave of the pandemic and tighter restrictions dampened economic activity during these months, with high-touch services sectors (retail, accommodation and food services, arts, entertainment, and recreation, and other services) once again the hardest hit. Collectively these industries lost 4% of output (m/m) in April alone.
Weakness was not only concentrated in high-touch services industries, the manufacturing sector also took a tumble, declining by 1% in April. Unlike services, however, manufacturing was held down by the global semiconductor chip shortage. In particular, motor vehicle and motor vehicle parts subsectors bore the brunt of the impact with output declining by 20.9% and 13.4%, respectively. As the semiconductor shortage is likely to persist, production could remain weak in this area of the economy for some time.
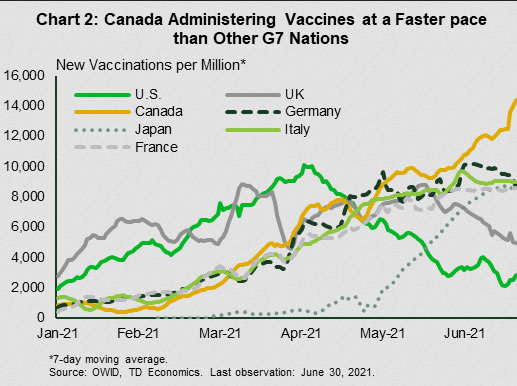
On the whole, however, the setbacks in April and May are likely to be temporary. Restrictions are being lifted across the country, and COVID-19 cases and hospitalizations are falling. This would not have been possible without the extraordinary vaccine rollout in Canada. The country stands well above other G7 countries in terms of the pace of vaccinations (Chart 2), and is on track to have 75% of the eligible population fully vaccinated by the end of July. This impressive speed may even help lessen the downside risks posed by the more contagious Delta variant.
The Bank of Canada is paying close attention to these developments. In a speech in early June, Deputy Governor Timothy Lane noted that the Bank's Governing Council will monitor how the economy is responding to reopening measures, and that this will inform them on the future of monetary stimulus. Specifically, if reopening spurs a solid bounce back in economic activity, the economy will not need as much stimulus from the quantitative easing program. Assuming provinces ease restrictions as planned, the Bank could reduce the pace of asset purchases as early as July.
In terms of the overnight rate, it'll take more than a successful reopening of the economy to force the Bank into rate hikes. Unemployment is considerably higher than what it was prior to the pandemic, and it may take several quarters for people to find new jobs. The Bank currently sees this happening sometime in the second half of 2022, and that's probably when we'll see the first rate hike.