Sample Category Title
Australia AiG construction dropped to 55.5, facing capacity constraints
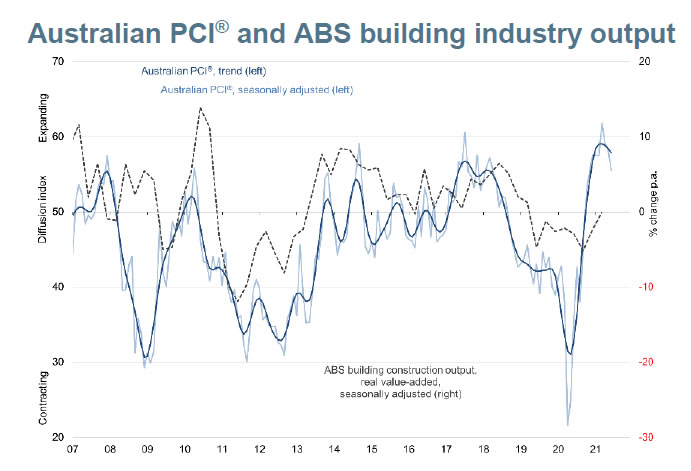
Australia AiG Performance of Construction dropped -2.8 pts to 55.5 in June. Current activity dropped -0.9 to 54.8. Employment dropped -6.1 to 58.3. New orders rose 0.9 to 56.1. Supplier deliveries dropped -8.5 to 50.9. Input prices rose 2.5 to 98.3. Selling prices rose 7.0 to 85.2. Average wages rose 5.4 to 70.4.
Ai Group Head of Policy, Peter Burn, said: "Australia's construction industry continued its run of strong growth in June but the pace of expansion is slipping as it faces capacity constraints and rising input prices. Activity across house building, engineering construction and commercial construction rose in June while activity in the apartment sector slipped back after a brief recovery. Employment continued to grow although its pace eased with the builders and constructors reporting increasing difficulty filling positions. Input prices and wages are rising at well above their average pace and strong demand is pushing selling prices up too. New orders were at very healthy levels indicating further expansion in the months ahead. However, lag times are extending with capacity already stretched. It will be critical for governments, their agencies, and industry to work together to ensure that sufficient labour is available to deliver on the full range of infrastructure projects in the pipeline."
Forex and Cryptocurrencies Forecast
First, a review of last week's events:
EUR/USD. Making a forecast for the previous week, the majority of analysts (60%), supported by 85% of oscillators and trend indicators, voted for the strengthening of the dollar and the decline of the EUR/USD pair to the June 18 low of 1.1845. The forecast turned out to be absolutely correct, and the pair reached the set goal as early as Wednesday, June 30. But the dollar did not stop there and its DXY index renewed a three-month high on Friday, July 02, peaking at 92.699.
The growth of the American currency was due to the expectation that the pace of the US economic recovery will force the Fed to accelerate plans to reduce the programs of financial and credit stimulus (QE). And the market expected the strong labor market data, which was due out in mid-Friday, to push the dollar even higher.
According to the Department of Labor, the number of new jobs created in the non-agricultural sectors in the United States (Nonfarm Payrolls) actually turned out to be higher than the forecast by 150 thousand: 850 thousand instead of the estimated 700 thousand. The EUR/USD pair fell further downward, however, having reached the level of 1.1805, it unexpectedly turned around and soared to the north no less rapidly. The reason was the second published indicator: according to forecasts, the unemployment rate should have decreased from 5.8% to 5.7%, however, contrary to expectations, it rose to 5.9%.
This result showed a weak recovery in the US labor market, investors' expectations regarding the imminent tightening of the Fed's monetary policy weakened, and this supported the risk sentiment. The Dow Jones index went up, and the S&P500 and Nasdaq Composite renewed all-time highs once again. The DXY fell to 92.24 and EUR/USD closed the weekly session at 1.1863;
GBP/USD. Concerns about the Delta COVID-19 strain are putting a lot of pressure on the pound sterling. Investors were not pleased with the data on the UK GDP for Q1, which turned out to be worse than the forecast (minus 1.6% versus minus 1.5%).
With regard to inflation, in his speech on Thursday July 1, the head of the Bank of England Andrew Bailey stressed that its high rates are temporary, as the British economy returns to the average and slows down the growth rate. This announcement pushed the pound further down. And if not for the disappointing US unemployment data, the GBP/USD pair would probably have tested the 1.3670 support. In reality, its fall was stopped at the 1.3730 horizon, and the last chord of the week sounded 100 points higher, at 1.3830;
USD / JPY. the Bank of Japan published the value of the Tankan index for Q2 of this year on July 1. This index reflects the general business conditions for large companies in the country. A reading above 0 is considered to be a positive factor for the JPY, while a reading below 0 is considered negative. The index was projected to rise to 15, up from 5 in Q1 2021. Tankan did grow, though not to 15, but to 14. But neither its growth nor its value have had virtually any impact on the USD/JPY pair. As it was not strongly influenced by the decline in the yield of US Treasury bonds. The pair basically just copied what was happening with the DXY index. The dollar grew, and the pair also grew, breaking through the important resistance of 111.00 and finding itself at a height of 111.65 - very close with the high of March 24, 2020 - 111.70. Then the dollar collapsed, and so did the pair. True, it was able to stay above the horizon at 111.00 and finished at 111.05;
cryptocurrencies. The forecast, which was given seven days ago, said that "with a high degree of probability, the fight between bulls and bears in the $30,000 area will continue." This is exactly what happened. The local bottom was reached at $30,200. Then the bulls managed to raise the BTC/USD pair to $36,590, but they could not keep it above the psychologically important level of $36,000, and the price of bitcoin dropped to $32,700 on Friday, July 02.
The lack of significant victories on both sides was facilitated by a fairly calm news background. We list just a few, more or less noticeable, of these news stories:
- There was a rumor that Paraguay could be the next country after El Salvador to recognize bitcoin as legal tender. However, then it was clarified that the purpose of the bill, which will be presented to Parliament on July 14, is completely different and is to regulate digital assets, and not to turn bitcoin into a national currency.
- The panic after the mining ban in China is gradually subsiding. In China itself, authorities have banned energy companies from supplying electricity to miners. In theory, this should have brought the hash rate down to zero in the country. However, some enterprising crypto miners are trying to continue their business using small private hydroelectric power plants. Another part of mining companies migrates - some to the USA, and some, for example, to Kazakhstan. Against this background, the President of Kazakhstan signed a law on the introduction of additional payments for electricity when mining cryptocurrencies, which may negatively affect the country's attractiveness for this industry.
- Ark Invest, managed by Katie Wood, is the ninth company to apply to the US Securities and Exchange Commission to launch a Bitcoin Exchange Traded Fund (ETF).
- According to the analytical service Chainalysis, the number of crypto investors in India has exceeded 15 million, and investments in cryptocurrency over the past year have grown from about $200 million to almost $40 billion, which means an increase of 20,000%.
- A veteran of the crypto market and one of the largest holders of BTC, 41-year-old Mircea Popescu, drowned in Costa Rica. He was known as a blogger and self-proclaimed "greatest erotic writer in the world." The crypto community called him "the evil genius of bitcoin maximalism", "the father of toxicity around bitcoin" and the "sleeping giant" who "could at one moment bring bitcoin to virtually zero and hold the price for some time." The actual number of coins owned by Popescu could be between 50,000 and 300,000 BTC, making him one of the largest cryptocurrency holders in the world. Now, this huge number of bitcoins seems to have disappeared forever.
And a few words about Elon Musk (we can't do without him!). Perhaps the billionaire has already played enough with bitcoin and Dogecoin, and now he has a new hobby - BabyDoge. After his tweet with three repeated unpretentious text "Baby Doge, doo, doo, doo, doo, doo, ...", the value of this coin has increased by 500% in two weeks, and the trading volume has tripled. It is still unknown whether Musk himself made money on such a "pump".
As for the crypto market as a whole, unlike BabyDoge, its capitalization increased very slightly over the week: from $1.336 trillion to $1.381 trillion. The Bitcoin Dominance Index fell from 47.05% to 45.52%, and the BTC Crypto Fear & Greed Index found itself in the Extreme Fear zone once again, at around 21 points.
As for the forecast for the coming week, summarizing the views of a number of experts, as well as forecasts made on the basis of a variety of methods of technical and graphical analysis, we can say the following:
EUR/USD. The data on inflation and consumer markets in Germany and the Eurozone are not the most encouraging. Tourism revenues are falling, due to the Delta strain of the coronavirus and the divorce from the UK. In general, optimism about the recovery of the European economy is declining.
As for the United States, Congress has raised its forecasts for 2021 both on the growth of inflation - from 1.7% to 2.8%, and on the growth of the country's economy - from 3.7% to 7.4%. The IMF expects US GDP to grow by 7%, the fastest pace since 1984. As for the interest rate, according to the IMF experts, the Fed will raise it either at the end of 2022 or at the beginning of 2023. Federal Reserve Bank of Philadelphia President Patrick Harker suggests starting to wind down the Asset Purchase Program (QE) as early as this year. And the faster that happens, the sooner the interest rate will be raised in 2022.
The Fed is constantly saying that it will raise the interest rate in full employment only. And if the labour market data released on July 02 were positive, it would have sent EUR/USD to the March 31 lows of 1.1700. However, instead of falling, the unemployment rate rose from 5.8% to 5.9% in June, casting doubt on the continuation of the pair's downtrend.
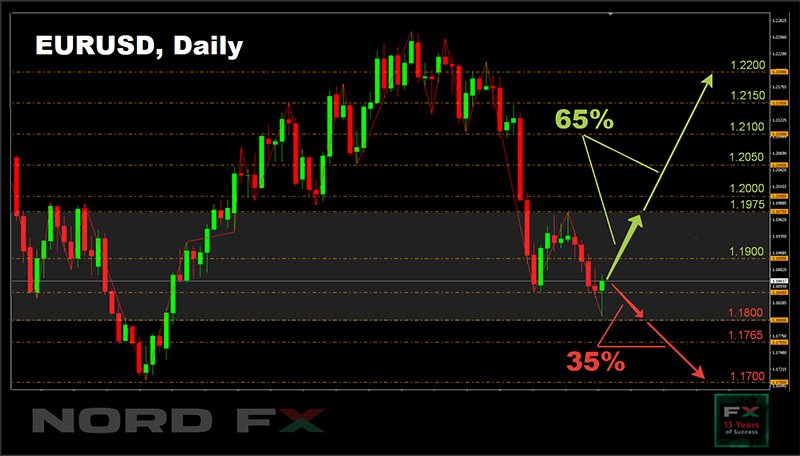
Before the release of unemployment data, 70% of experts sided with the bears. Now the situation has changed, and 65% expect the pair to grow during July. The same applies to indicators: 100% of oscillators and trend indicators on H4 and D1 were colored red until mid-Friday July 02. But by the time the markets closed, the color scheme on H4 had changed: some of the indicators turned into neutral grey, and some even turned green.
The nearest target of the bulls is 1.1975, then 1.2000, 1.2050 and 1.2150. The challenge for July is to update the May 25 high of 1.2265. The bears' task is to test the March low of 1.1700. The supports on the way to this target are 1.1845, 1.1800 and 1.1765.
The economic calendar for the coming week looks rather modest. It highlights Tuesday, July 06, when the Eurozone retail sales data and the ISM business activity index for the US services sector will be released;
GBP/USD. There is no unity in inflation estimates in the ranks of the Bank of England's senior management. Suffice to listen to the soothing statements of the head of the Bank, Andrew Bailey, and the exact opposite - of the chief economist Andy Haldane, who is greatly alarmed by inflationary risks. We have already said in the first part of the review that thanks to Bailey's position, the pound came under pressure, and its quotes were "saved" from a further fall by the increased unemployment in the US. Otherwise, the pound would have continued its decline as a pair with the euro.
The GBP/USD forecast, as with EUR/USD, changed the vector dramatically at the very end of the past week as well. If before the US unemployment data was published, 60% of analysts had expected the UK currency to weaken further, 75% vote for the growth of the pair during the month. Technical analysis readings on H4 have also mixed, although 90% of oscillators and 100% of trend indicators on D1 are still facing south. Graphic analysis on H4 indicates the pair's growth to 1.3900, and D1 shows its movement during the week in the range 1.3730-1.3870.
Support levels are 1.3800, 1.3730 and 1.3670, resistance - 1.3900, 1.4000, then the zone 1.4100-1.4165;
USD/JPY. The indicators for this pair are almost no different from those of their EUR/USD and GBP/USD counterparts. (Only in this case, their color changes from red to green). But the opinion of experts here turned out to be more constant, it just changed quantitatively: if 55% had voted for the strengthening of the yen and the decrease in the pair, then their number increased to 75%. Graphical analysis on H4 indicates a sideways movement of the pair along the support/resistance line of 111.00, on D1 it forecasts first a decline to 110.40, and then an increase above the high of March 24, 2020, at 111.70.
The targets of the bears are the zones 109.75-110.100 and 108.00-108.55. The bulls, subject to taking the height of 111.70, will seek to raise the pair to the high of February 20, 2020, 112.25;
cryptocurrencies. According to a report by cryptanalytics company Glassnode, institutional demand for bitcoin is declining. One of the main factors supporting the upward trend in BTC was the influx of institutional investments into the GBTC Grayscale trust fund. Glassnode analysts note that declining GBTC premiums, net outflows from ETFs, and stagnating Coinbase balance sheets indicate that demand for the main cryptocurrency from institutions remains weak.
Despite this, many of the experts are optimistic about the current situation. According to JPMorgan analysts, "the cryptocurrency market is not yet quite healthy; however, the healing process has already begun." Although bitcoin is still far from highs, cryptocurrencies are gradually recovering from the collapse. For example, the lack of activity in the bitcoin futures market is described by JPMorgan strategists as a "positive factor." However, the short-term outlook, in their opinion, is "extremely difficult."
Sam Trabucco, a trader at Alameda Research, also believes that the bitcoin market is already preparing for an upswing. In his opinion, a number of negative news that have been released recently have no fundamental value and is only aimed at creating short-term negative sentiments.
Trabucco writes that negative news from China, Elon Musk's concerns about the environmental friendliness of bitcoin and the likely insolvency of MicroStrategy associated with the fall in BTC are causing an overly negative reaction. Previously, the price reacted in the same way to the Tesla purchase for BTC and Musk's optimistic messages. "But none of this news in any way affects the value of bitcoin and how people should evaluate it in the medium term," the expert said. And he adds that the $30,000 price should be taken as a buy signal.
Jason Urban, co-head of trading at Galaxy Digital, is waiting for the market to turn north as well. He notes that negative news should exhaust itself by autumn, and bitcoin will continue its upward movement. Urban believes that many institutional investors have not yet entered the crypto market due to regulatory uncertainty, however, they will sooner or later, creating an increased demand for BTC. According to the specialist, "we will soon see an update to the historical high," and the quotes could reach $70,000 by the end of this year.
Former Gyft CEO and Civic project co-founder Vinny Lingham also spoke out. He was once nicknamed "the oracle" for the fact that he was able to predict the future value of the oldest cryptocurrency.
Lingham's predictions for BTC are not always optimistic, and his calls are traditionally more conservative than those of people with fantastic ideas. However, like many others, he believes there is a possibility that BTC could hit six figures as early as this year. Oracle wrote in his Twitter account that if the price continues to hold at $30,000, then we will probably see bitcoin at $100,000 by the end of the year.
Billionaire Ricardo Salinas Pliego, who is one of the top three richest people in Mexico according to Forbes, said that when choosing an asset for the next 30 years, "would I never choose the stinking fiat", and preferred bitcoin. Salinas believes that bitcoin should be part of every investor's portfolio. "This is an asset that has international value and is traded globally with incredible liquidity. That's enough for it to be part of every portfolio, period."
The key advantage of bitcoin, according to the billionaire, is its limited emission. For the same reason, he does not believe in Ethereum, explaining that unlimited emission leads to the depreciation of existing assets.
Former Cramer & Co hedge fund manager and host of NBC's Mad Money show Jim Kramer is of the opposite opinion. He has again increased his savings in the second most capitalized cryptocurrency. Surprisingly, it was the positive dynamics of... bitcoin that pushed him to buy Ethereum. "I went back to Ethereum because bitcoin held above $30,000," he claimed. And he explained that he gave preference to this altcoin, since Ethereum is much more useful for people than the main cryptocurrency.
Eco Data 7/5/21
[php_everywhere instance="1"]
CFTC Commitments of Traders – Net Longs Declined in European Currencies
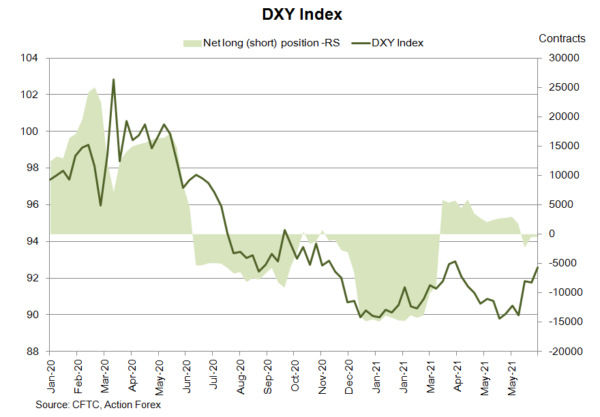
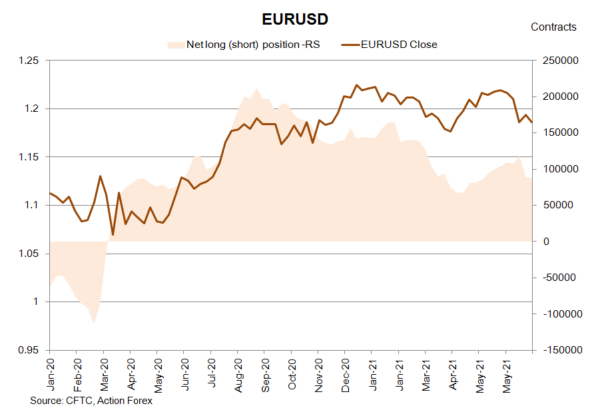
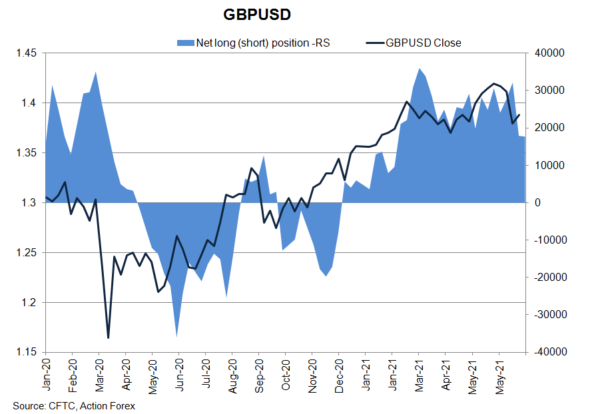
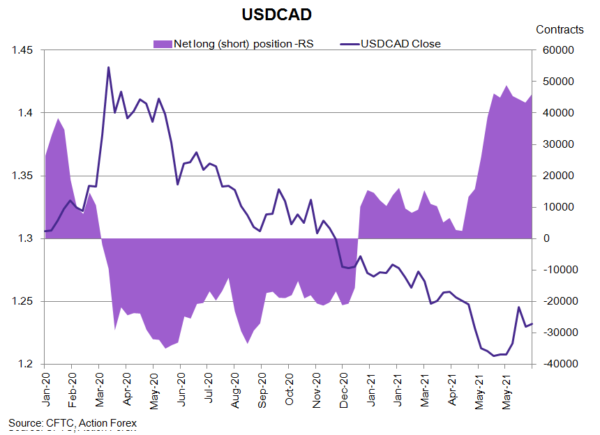
As suggested in the CFTC Commitments of Traders report in the week ended June 29, NET SHORT of USD index futures slipped -62 contracts. Speculative long positions added +629 contracts while shorts increased +567 contracts. Concerning European currencies, NET LENGTH in EUR futures dropped -1 911 contracts to 87 149. NET LENGTH of GBP futures slipped -204 contracts to 17 723.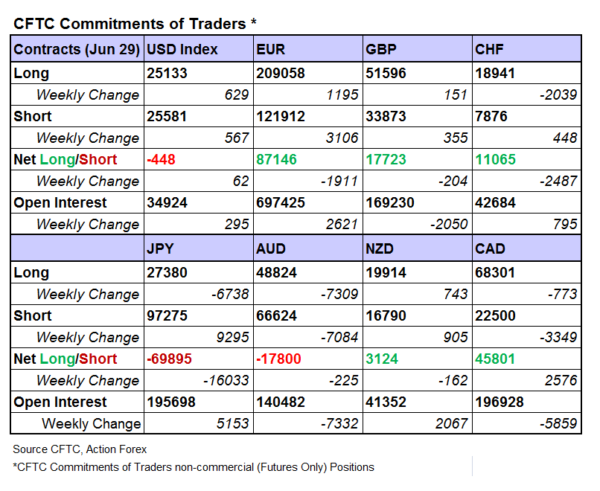
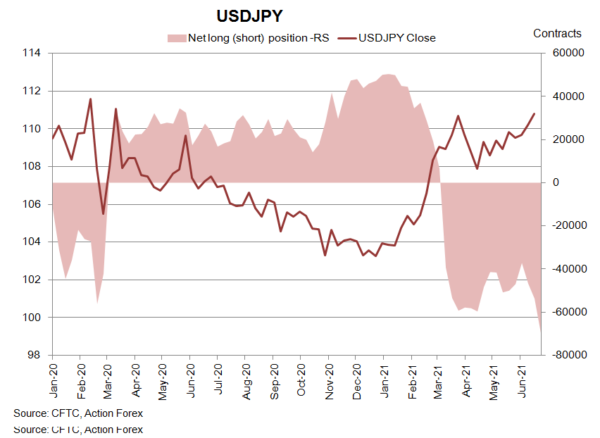
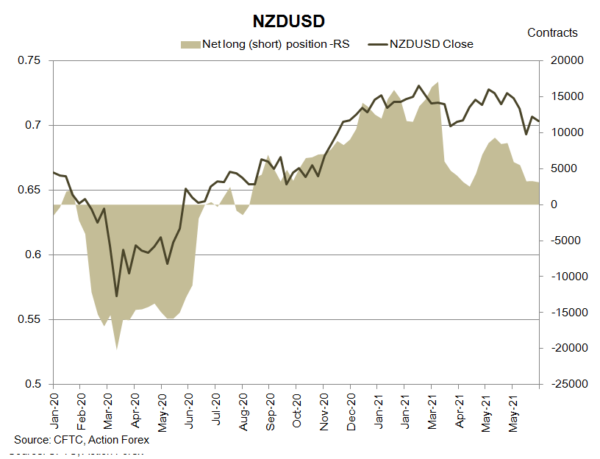
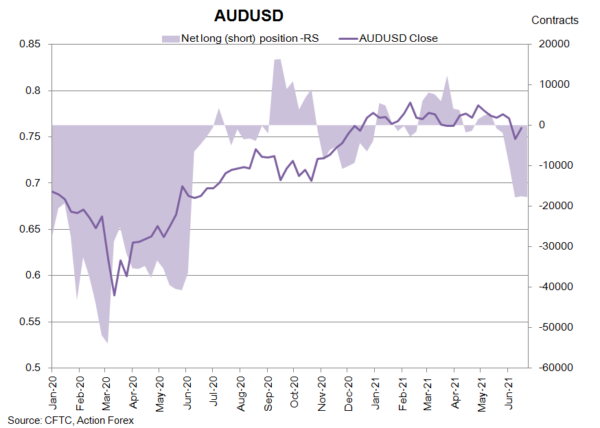
 On safe-haven currencies, NET LENGTH of CHF futures declined -2 487 contracts to 11 065 while NET SHORT of JPY futures jumped -16 033 contracts to 69 895. Concerning commodity currencies, NET SHORT of AUD futures increased +225 contracts to 17 800. Separately, NZD futures’ NET LENGTH slipped -162 contracts to 3 124. NET LENGTH of CAD futures rose +2 576 contracts to 45 801 during the week.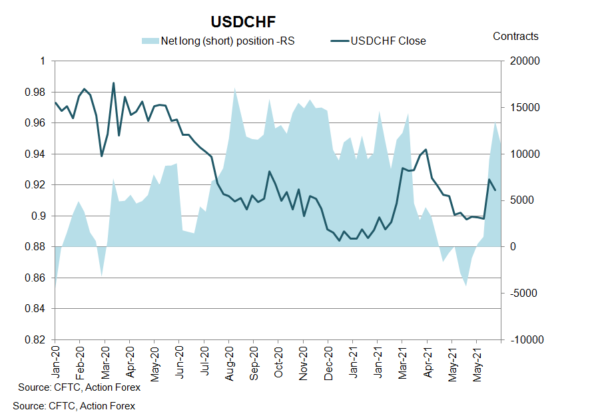
CFTC Commitments of Traders – Bets Trimmed on Crude Oil Futures amidst OPEC+ Uncertainty.
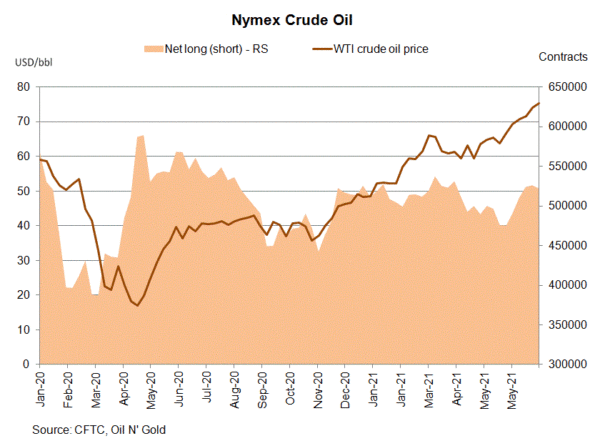
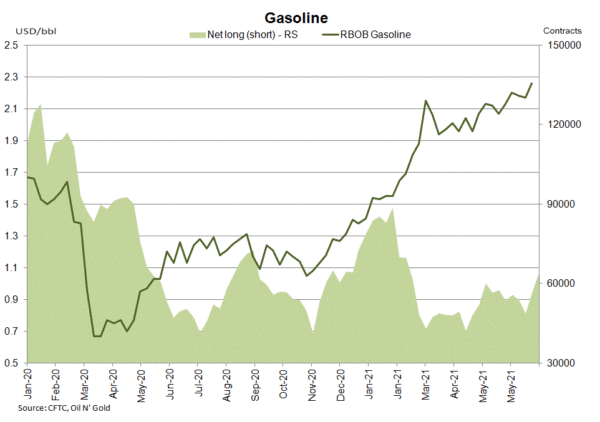
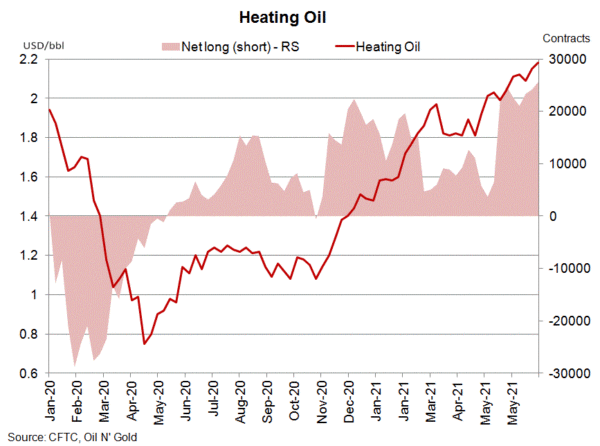
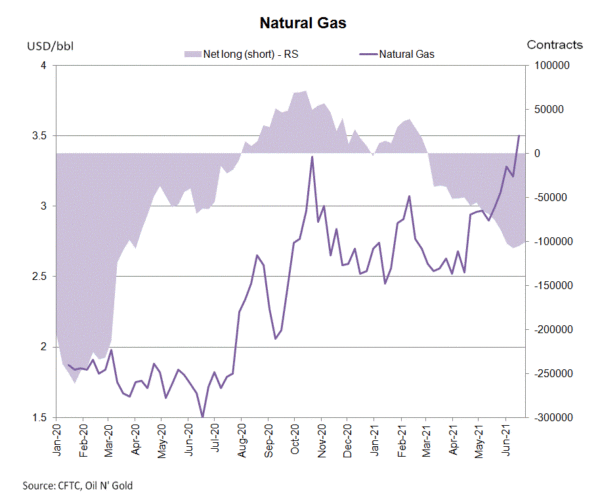
According to the CFTC Commitments of Traders report for the week ended June 29 NET LENGTH for crude oil futures fell -1 442 contracts to 522 490 for the week. Speculative long position decreased -5 113 contracts, while shorts slipped -1 442 contracts. For refined oil products, NET LENGTH for heating oil added +1 478 contracts to 25 697, while that for gasoline rose +7 301 contracts to 63 859. NET SHORT of natural gas futures slipped -4 251 contracts to 100 847 during the week.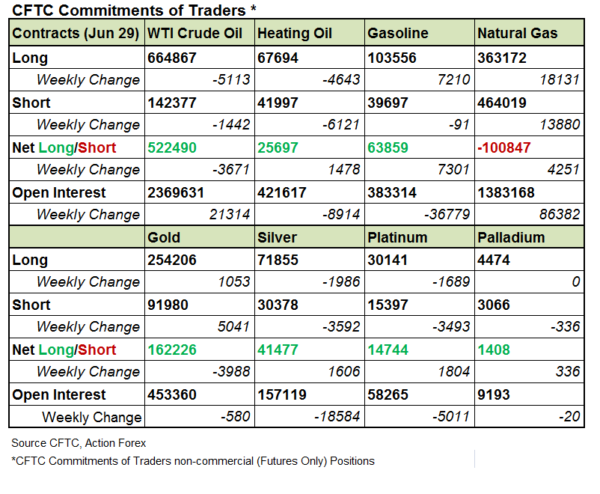
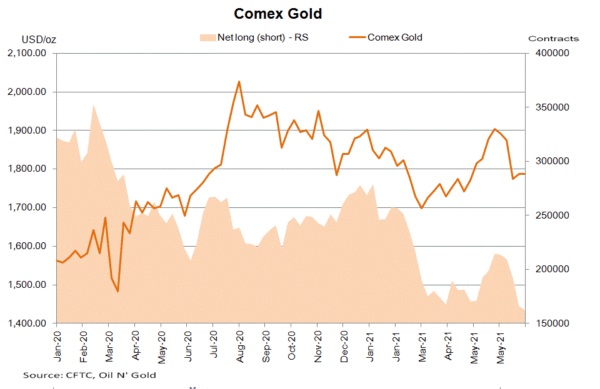
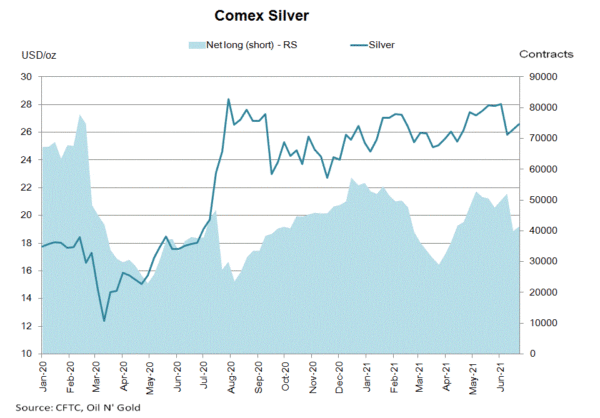
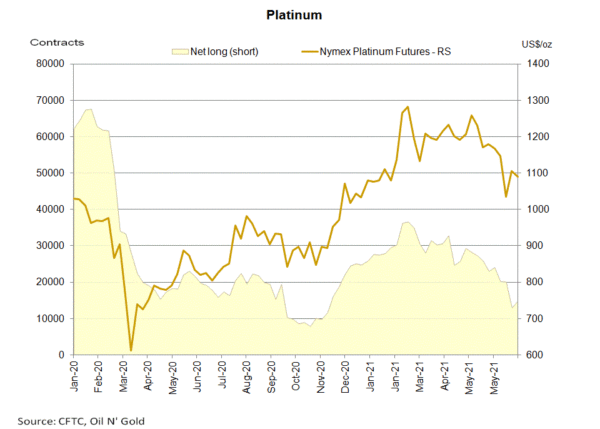
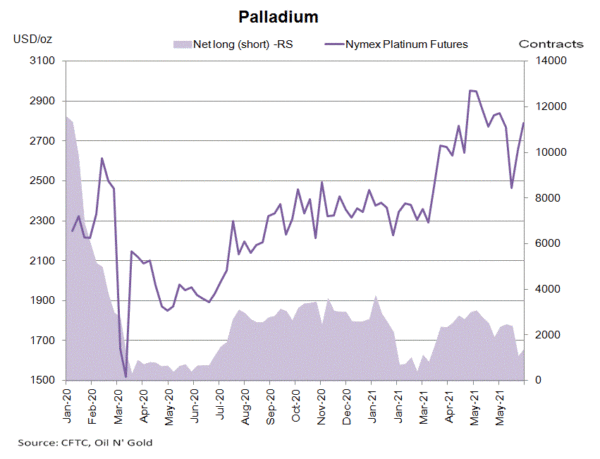
 Gold futures’ NET LENGTH dropped -3 988 contracts to 162 226 while silver futures’ NET LENGTH slipped -1 606 contracts to 41 477. For PGMs, NET LENGTH of Nymex platinum futures gained +1 804 contracts to 14 744 while that for palladium added +336 contracts to 1 408.
EUR/USD Weekly Outlook
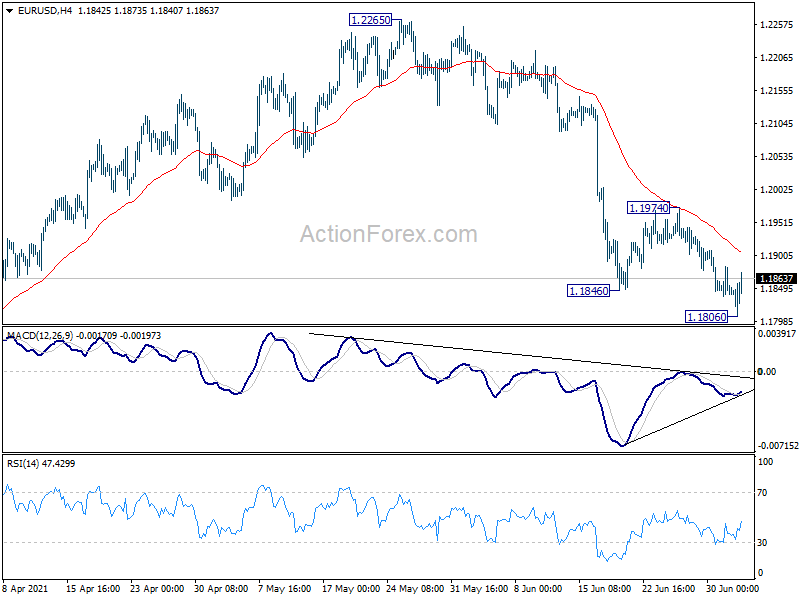
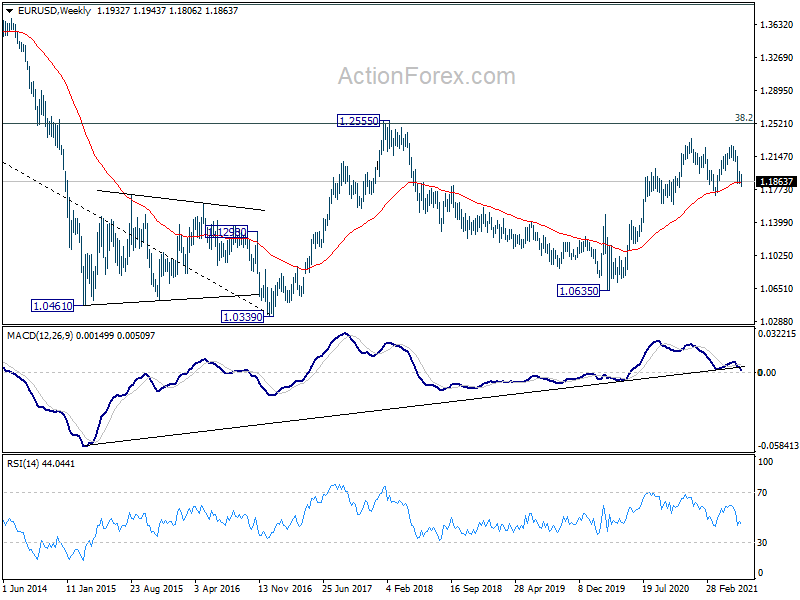
EUR/USD dropped further to 1.1806 last week but recovered since then. Initial bias is turned neutral this week first. Further fall is expected as long as 1.1974 resistance holds. Break of 1.1806 will resume the decline from 1.2265, as the third leg of the consolidation pattern from 1.2348, to 1.1703 support. On the upside, break of 1.1973 resistance will turn bias back to the upside for 1.2265 resistance.
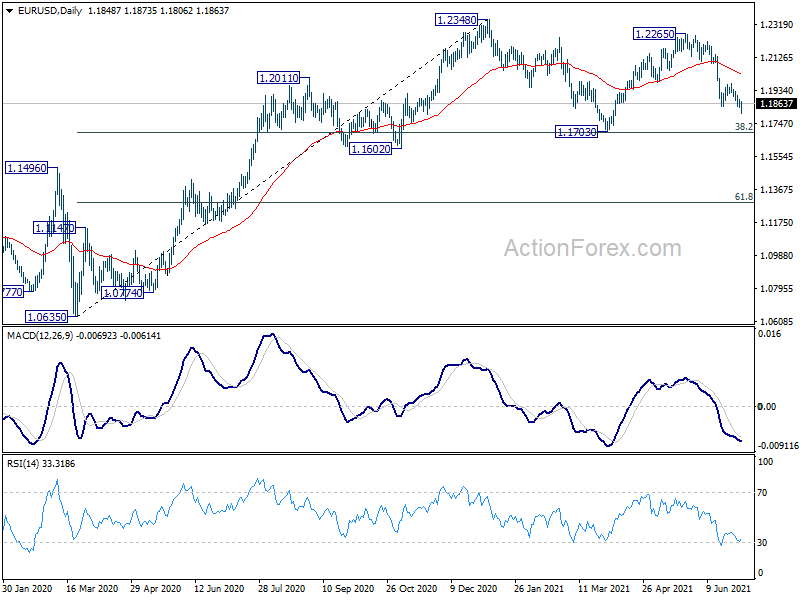
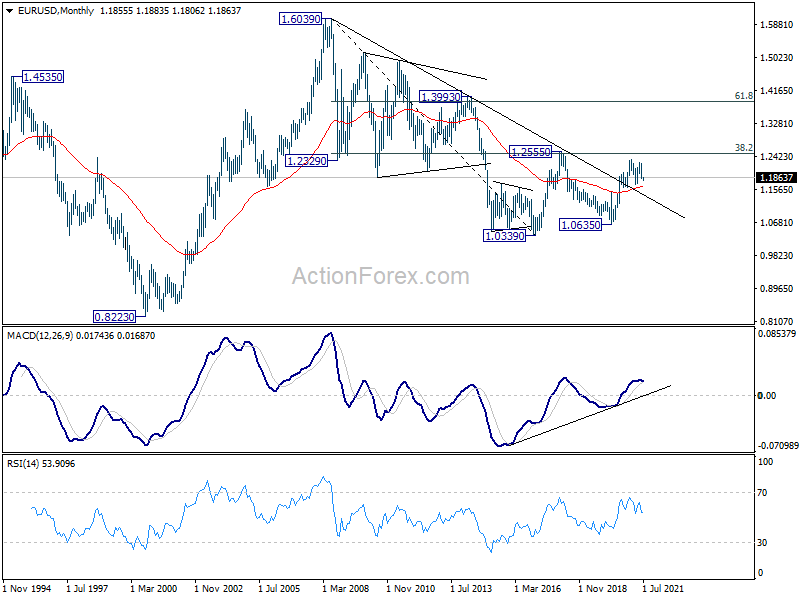
In the bigger picture, rise from 1.0635 is seen as the third leg of the pattern from 1.0339 (2017 low). Further rally could be seen to cluster resistance at 1.2555 next, (38.2% retracement of 1.6039 to 1.0339 at 1.2516). This will remain the favored case as long as 1.1602 support holds. Reaction from 1.2555 should reveal underlying long term momentum in the pair. However sustained break of 1.1602 will argue that the rise from 1.0635 is over, and turn medium term outlook bearish again.
In the long term picture, focus remains on 1.2555 cluster resistance (38.2% retracement of 1.6039 to 1.0339 at 1.2516). Sustained break there should confirm long term bullish reversal and target 61.8% retracement at 1.3862 and above. However, rejection by 1.2555 will keep medium term outlook neutral first, and raise the prospect of down trend resumption at a later stage.
USD/JPY Weekly Outlook
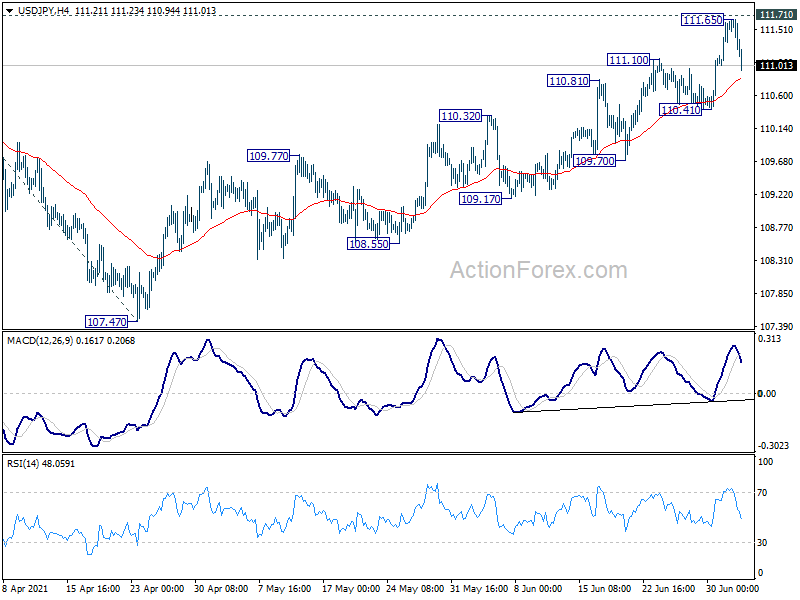
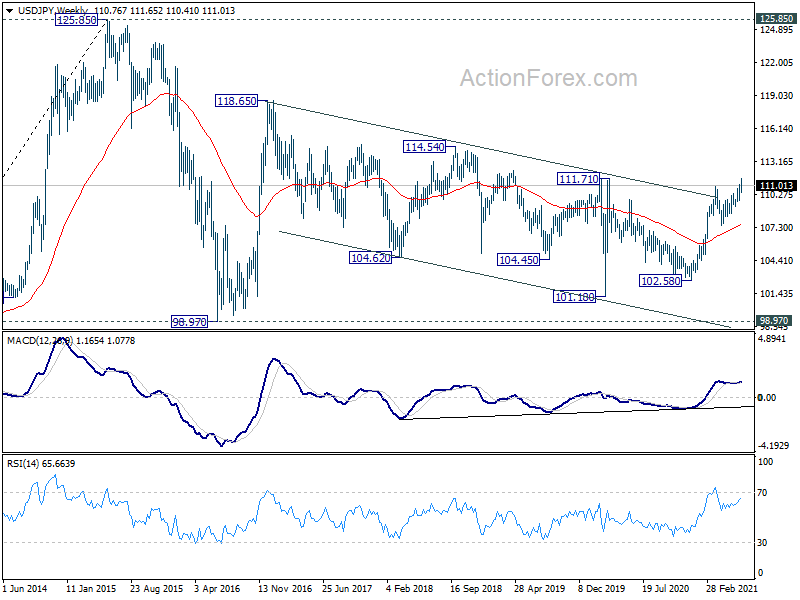
USD/JPY rose further to 111.65 last week but failed to break through 111.71 key resistance and retreated. Initial bias remains neutral this week first but another rise remains in favor with 110.41 support intact. On the upside, sustained break of 111.71 will carry larger implication. Next target is 61.8% projection of 102.58 to 110.95 from 107.47 at 112.64. However, break of 110.41 will indicate short term topping and bring pull back 55 day EMA (now at 109.61).
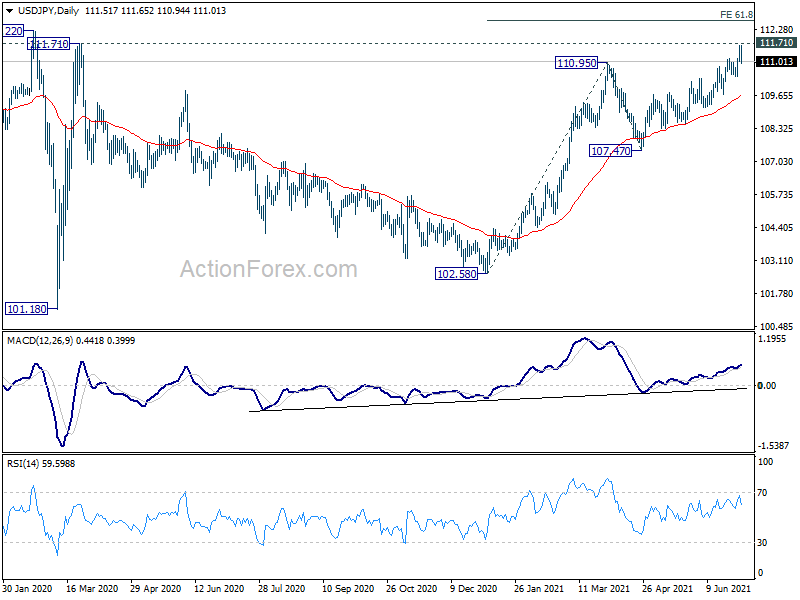
In the bigger picture, medium term outlook is staying neutral with 111.71 resistance intact. Though, as notable support was seen from 55 day EMA, rise from 102.58 is mildly in favor to extend higher. Decisive break of 111.71/112.22 resistance will suggest medium term bullish reversal. Rise from 101.18 could then target 118.65 resistance (Dec 2016) and above. However, sustained break of 55 day EMA would revive some medium term bearishness, and open up deep fall to 61.8% retracement of 102.58 to 110.95 at 105.77 and below.
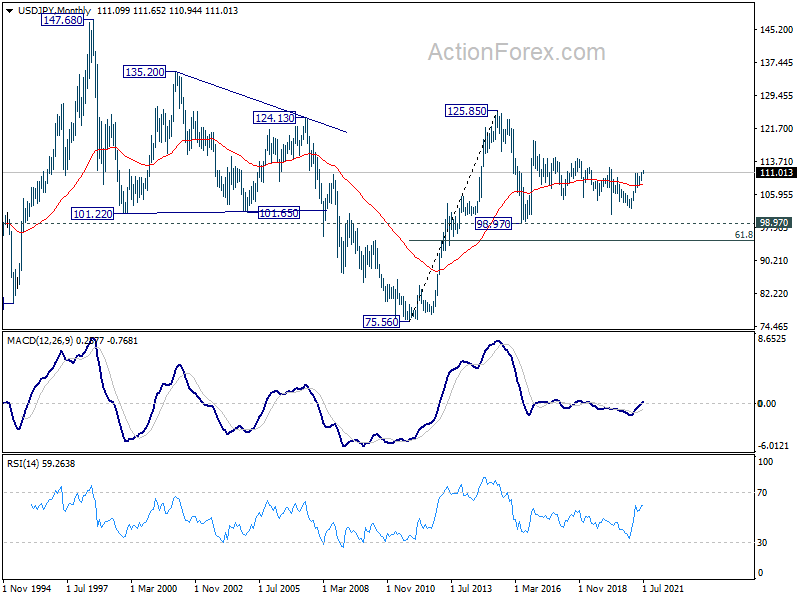
In the long term picture, the rise from 75.56 (2011 low) long term bottom to 125.85 (2015 high) is viewed as an impulsive move, no change in this view. Price actions from 125.85 are seen as a corrective pattern which could still extend. In case of deeper fall, downside should be contained by 61.8% retracement of 75.56 to 125.85 at 94.77. Up trend from 75.56 is expected to resume at a later stage for above 135.20/147.68 resistance zone.
GBP/USD Weekly Outlook
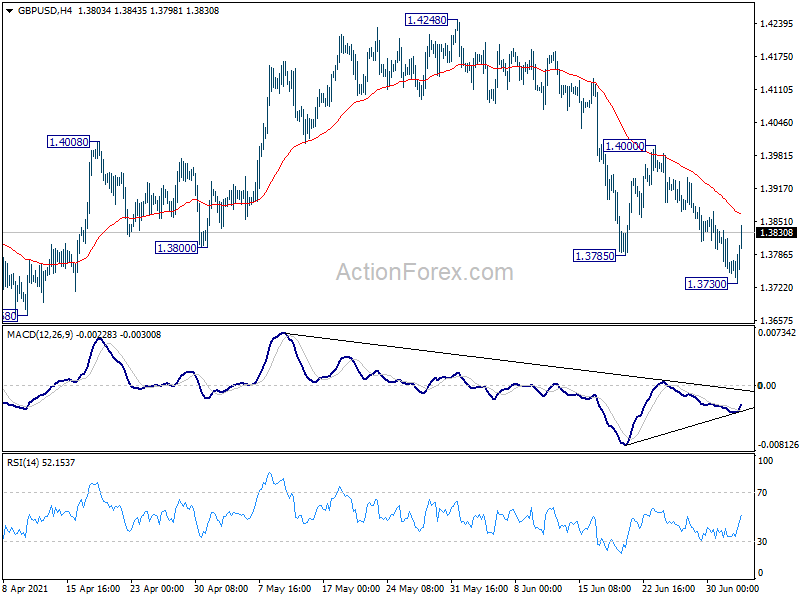
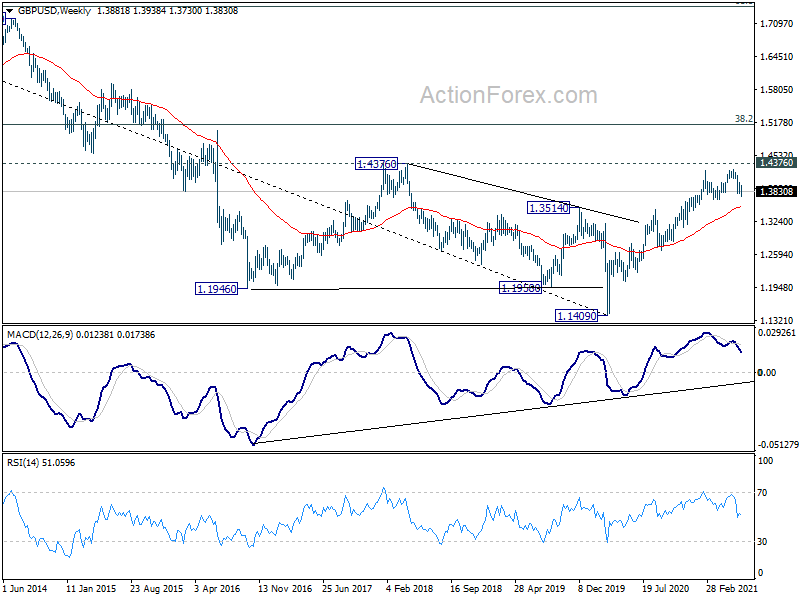
GBP/USD edged lower to 1.3730 last week but recovered notably since then. Initial bias is turned neutral this week first. Another fall could still be seen with 1.4000 resistance intact. Break of 1.3730 support will resume the fall from 1.4248, as the third leg of the consolidation pattern from 1.4240, to 1.3668 support and possibly below. On the upside, break of 1.4000 will turn bias back to the upside for retesting 1.4240/8 resistance zone instead.
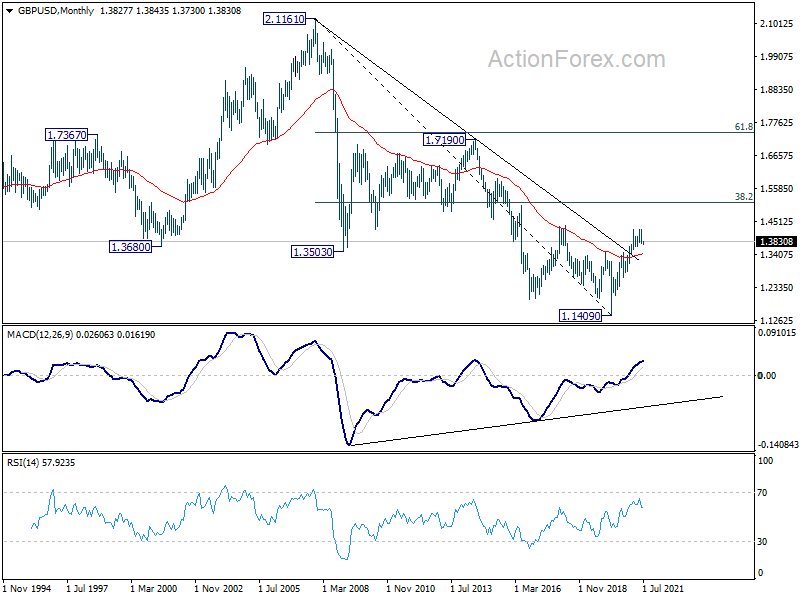
In the bigger picture, as long as 1.3482 resistance turned support holds, up trend from 1.1409 should still continue. Decisive break of 1.4376 resistance will carry larger bullish implications and target 38.2% retracement of 2.1161 (2007 high) to 1.1409 (2020 low) at 1.5134. However, firm break of 1.3482 support will argue that the rise from 1.1409 has completed and bring deeper fall to 1.2675 support and below.
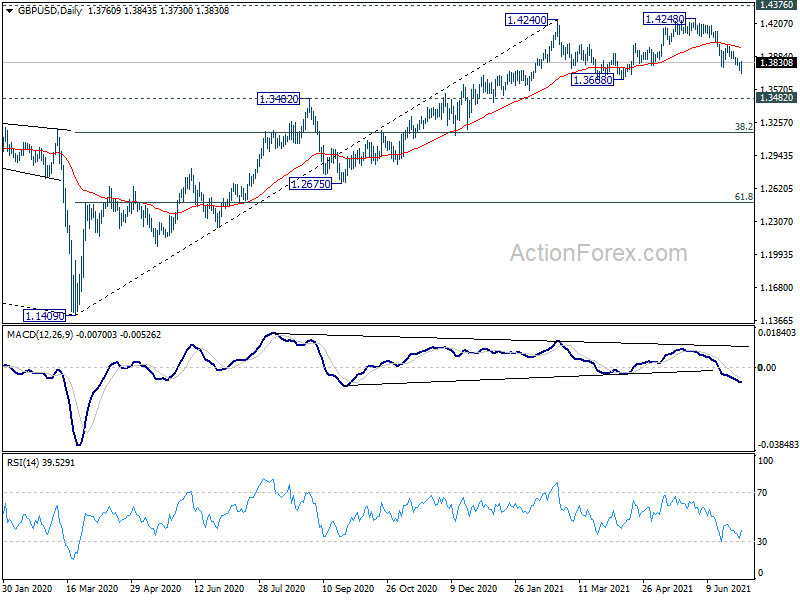
In the longer term picture, a long term bottom should be in place at 1.1409, on bullish convergence condition in monthly MACD. Rise from there would target 38.2% retracement of 2.1161 to 1.1409 at 1.5134. Reaction from there would reveal whether rise from 1.1409 is just a correction, or developing into a long term up trend.
USD/CHF Weekly Outlook
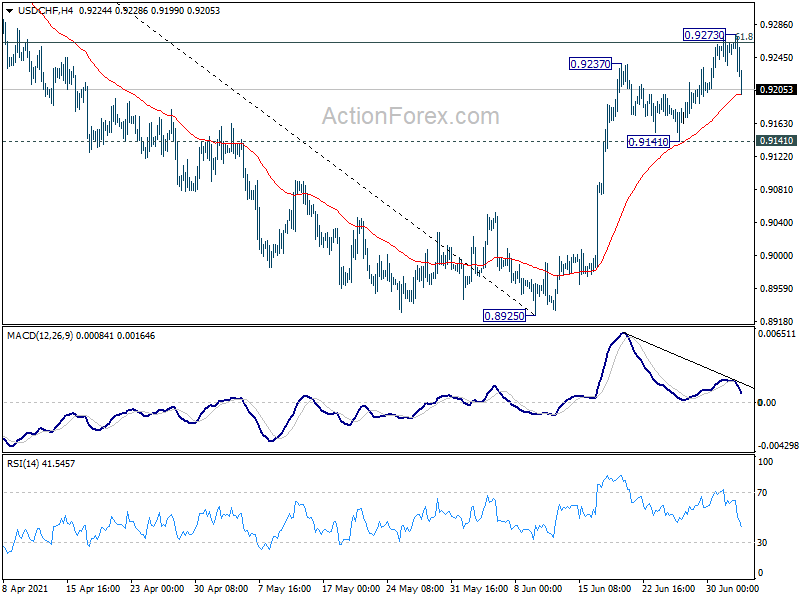
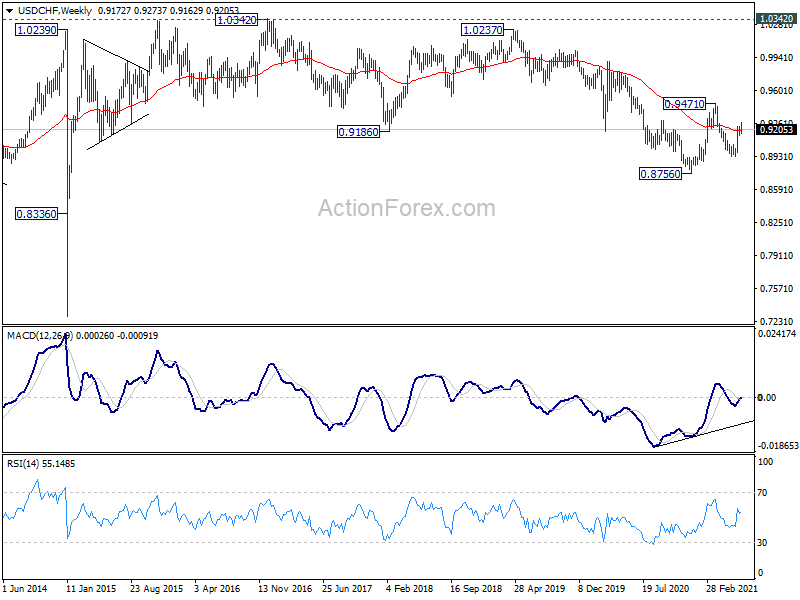
USD/CHF rose further to 0.9273 last week but failed to sustain above 61.8% retracement of 0.9471 to 0.8925 at 0.9262, and retreated sharply. Initial bias is turned neutral this week first. Another rise could still be seen as long as 0.9141 support holds. Break of 0.9273 would pave the way to 0.9471 key resistance next. On the downside, however, break of 0.9141 support will argue that the rebound from 0.8925 has completed, and turn bias back to the downside for this low.
In the bigger picture, medium term outlook is currently neutral with focus on 0.9471 resistance. Sustained break there will indicate completion of whole decline from 1.0342 (2016 high). Medium term outlook will be turned bullish for a test on 1.0342 high. But, rejection by 0.9471 again will revive bearishness for another fall through 0.8756 low.
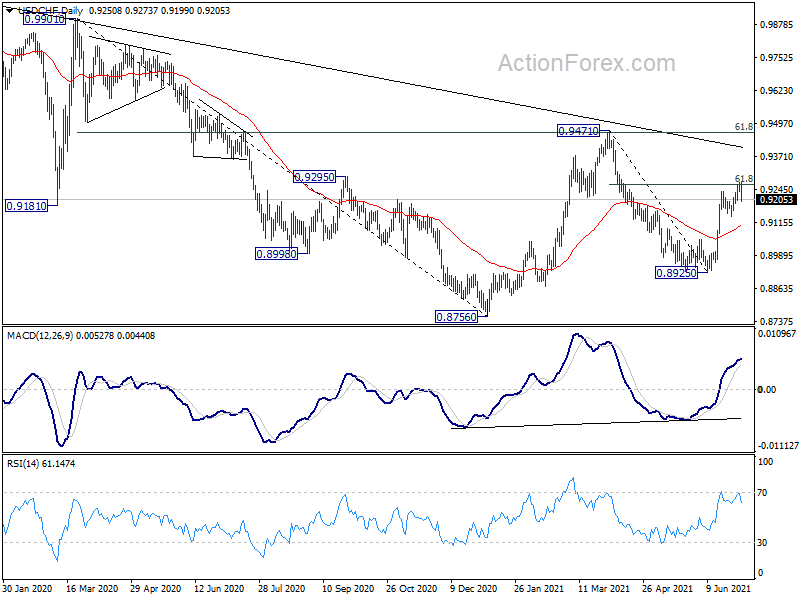
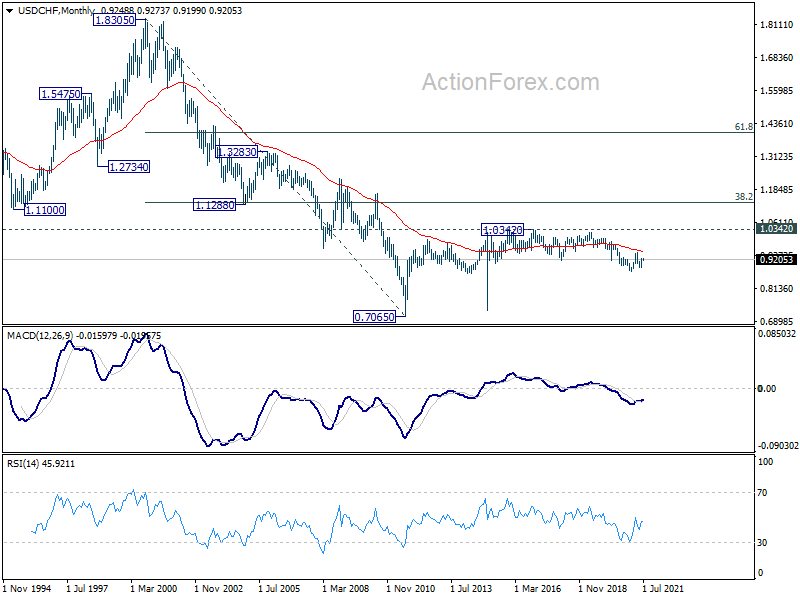
In the long term picture, price actions from 0.7065 (2011 low) are currently seen as developing into a long term corrective pattern, at least until a firm break of 1.0342 resistance.
AUD/USD Weekly Outlook
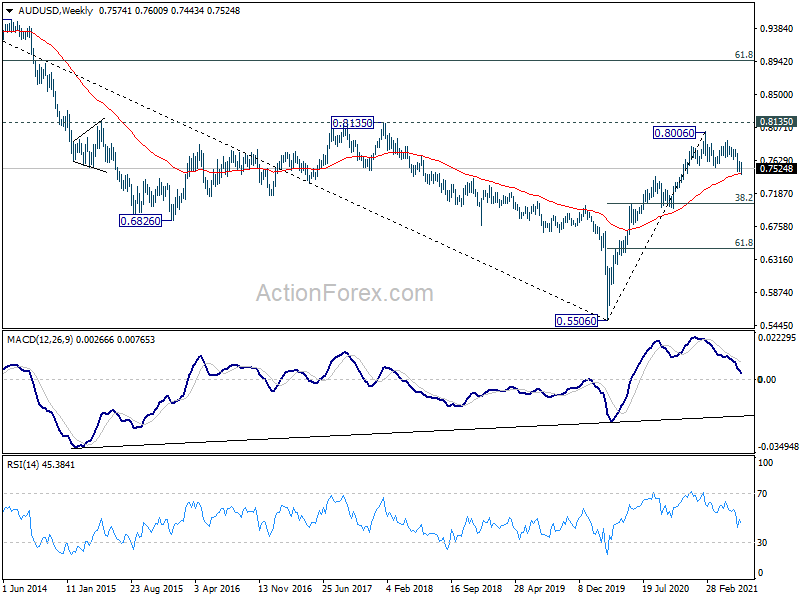
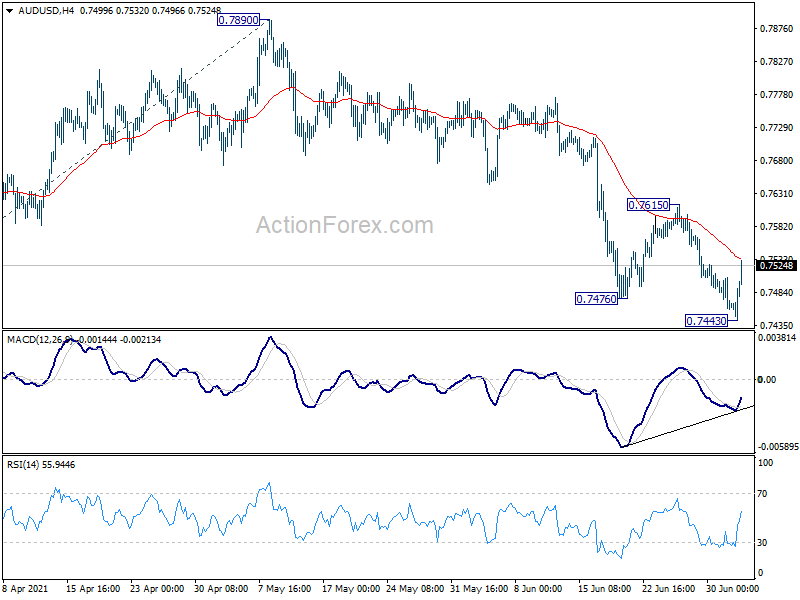
AUD/USD edged lower to 0.7443 last week but quickly recovered again. Initial bias is turned neutral this week first. Another fall could still be seen, and break of 0.7443 will resume the whole corrective pattern from 0.8006. But we'd expect strong support from 100% projection of 0.8006 to 0.7530 from 0.7890 at 0.7414 to bring rebound. On the upside, break of 0.7615 resistance will indicate short term bottoming, on bearish divergence condition in 4 hour MACD. Intraday bias will be turned back to the upside for 0.7890/8006 resistance zone.
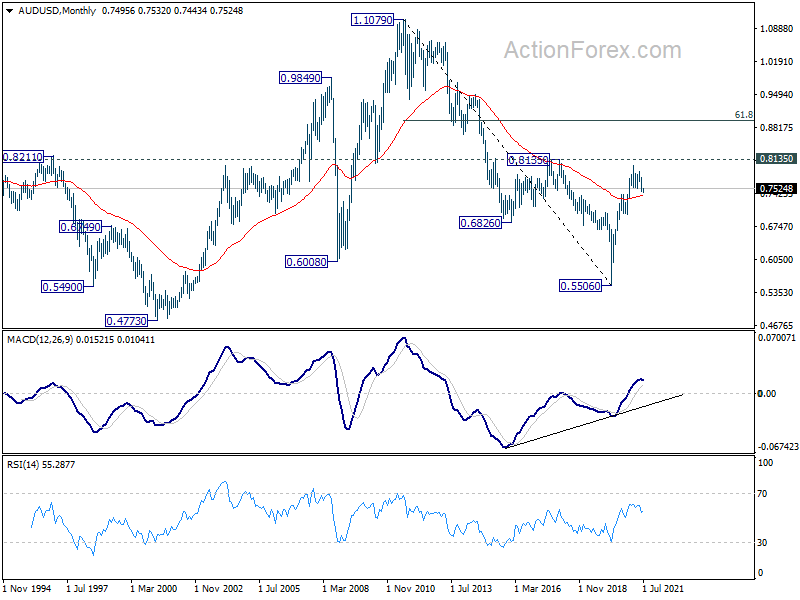
In the bigger picture, rise from 0.5506 medium term bottom could either be the start of a long term up trend, or a corrective rise. Reactions to 0.8135 key resistance will reveal which case it is. Rejection by 0.8135 key resistance, followed by firm break of 0.7413 resistance turned support, will favors the latter case. Deeper decline would be seen to 38.2% retracement of 0.5506 to 0.8006 at 0.7051 first.
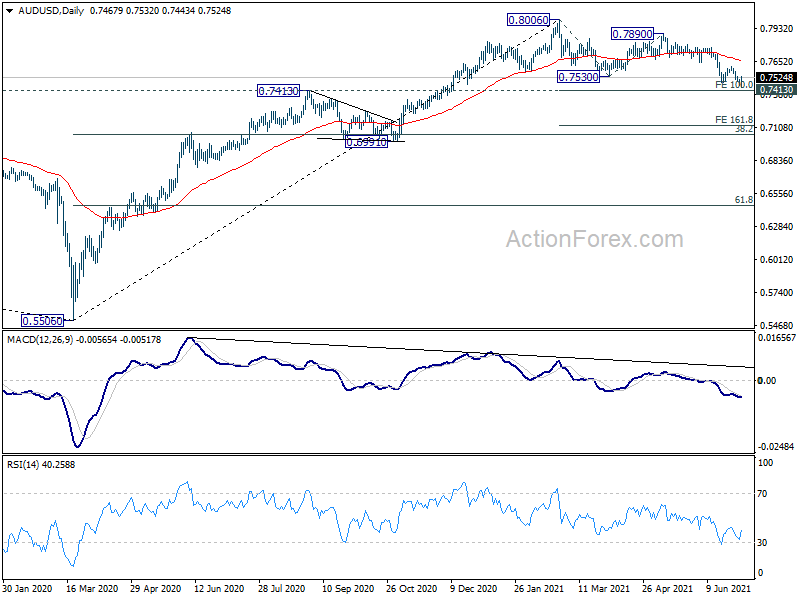
In the longer term picture, 0.5506 is a long term bottom, on bullish convergence condition in monthly MACD. Focus is now back on 0.8135 structural resistance. Decisive break there will raise the chance that rise from 0.5506 is an impulsive up trend. Next target should be 61.8% retracement at 0.8950 of 1.1079 to 0.5506 and above. Though, rejection by 0.8135 will keep the case of medium to long term sideway consolidation open.