EUR/CAD – 1.4805
EUR/CAD: Wave 4 ended at 1.4380 and wave 5 as well as circle wave C has possibly ended at 1.2129, major (A)-(B)-(C) correction has commenced and indicated target at 1.6000 had been met.
Despite recent anticipated resumption of recent upmove to 1.5259 earlier this month, the subsequent sharp retreat suggests a temporary top has been formed there and consolidation with mild downside bias is seen for retracement of recent rise from 1.3784, hence further fall to 1.4700 would be seen, however, loss of near term downward momentum should limit downside to previous resistance at 1.4600 and price should stay above 1.4520-25 (50% Fibonacci retracement of entire rise from 1.3784-1.5259), risk from there is seen for a strong rebound to take place probably in Q3.
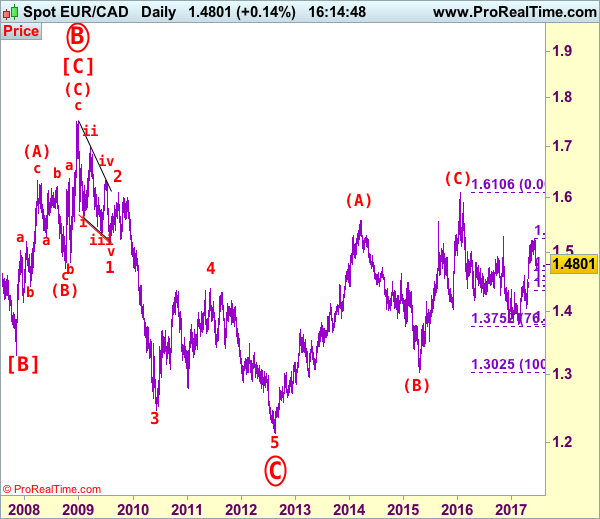
Our latest preferred count is that larger degree wave [C] from 1.3289 as well as circle wave B ended at 1.7509 in Dec 2008 with (A): 1.6325, (B): 1.4719 followed by wave (C) at 1.7509, hence circle wave C is unfolding with wave 1 ended at 1.5186 (diagonal wave 1), wave 2 at 1.6096, impulsive wave 3 has ended at 1.2451, followed by wave 4 at 1.4380, in view of recent strong rebound, we are now treating the wave 5 as well as larger degree circle wave C has ended at 1.2129, hence (A)-(B)-(C) correction has commenced from there with impulsive wave (C) now unfolding and indicated initial upside target at 1.6000 had been met and reckon 1.6500 would hold.
On the upside, whilst recovery to 1.4845-50 and possibly 1.4910-20 cannot be ruled out, reckon upside would be limited to 1.5000 and bring another decline later. Above 1.5100-10 would dampen this near term bearishness and suggest the retreat from 1.5259 has ended, bring a stronger rebound to 1.5155-60 but aside should be limited to 1.5200 and price should falter below said recent high at 1.5259.
Recommendation: Turn short at 1.5000 for 1.4700 with stop above 1.5100.
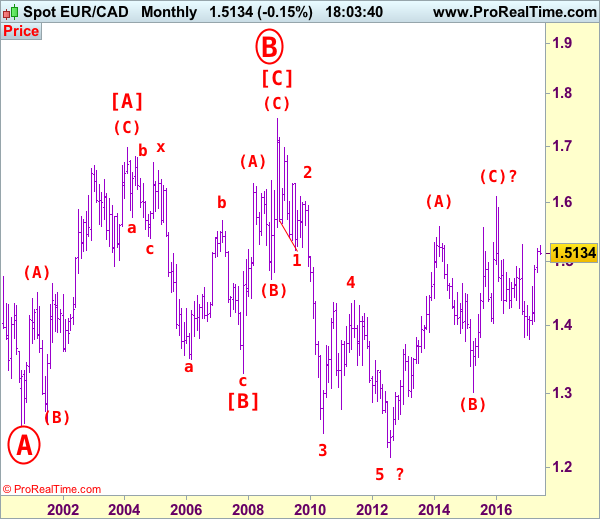
On the bigger picture, our long-term count on the monthly chart is that a big sideways consolidation from 2000 low of 1.2557 has possibly ended at 1.7509 as circle wave B with [A]: 1.6976 ( (A): 1.4513, (B): 1.2612, (C): 1.6976), wave [B]: 1.3289 is a double three with 1st a-b-c: 1.5384, x: 1.6709 and 2nd a-b-c: 1.3289. As indicated above, the wave [C] has ended at 1.7509. The selloff from there is now unfolding which itself should be labeled as an impulsive wave with wave 1: 1.5186 (diagonal wave 1), followed by wave 2: 1.6096 and wave 3: 1.2451, wave 4: 1.4380, wave 5 as well as larger degree circle wave C has possibly ended at 1.2129 and major correction has possibly commenced for retracement of recent decline towards 1.4000, then 1.4180-90 (38.2% Fibonacci retracement of 1.7509-1.2129). Below said support at 1.2129 would risk weakness to psychological support at 1.2000 and then 1.1851 (50% projection of 1.7509-1.2451 measuring from 1.4380) but reckon 1.1500 would remain intact, bring reversal later.