
USD/JPY – 108.86
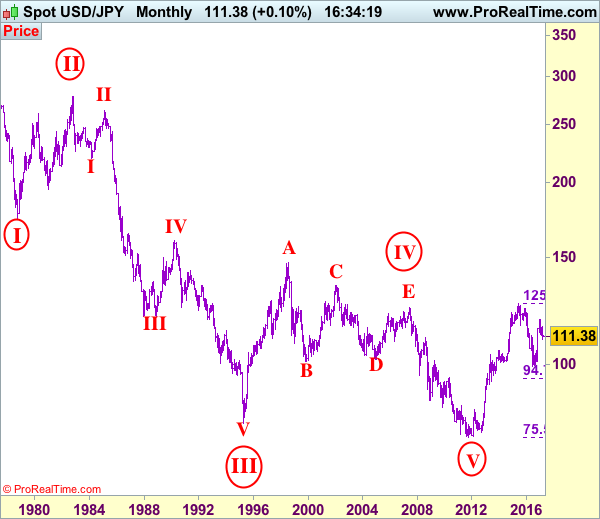
USD/JPY – Wave V of larger degree circle V has possibly ended at 75.31 and major correction has commenced and already met indicated target at 125.00.
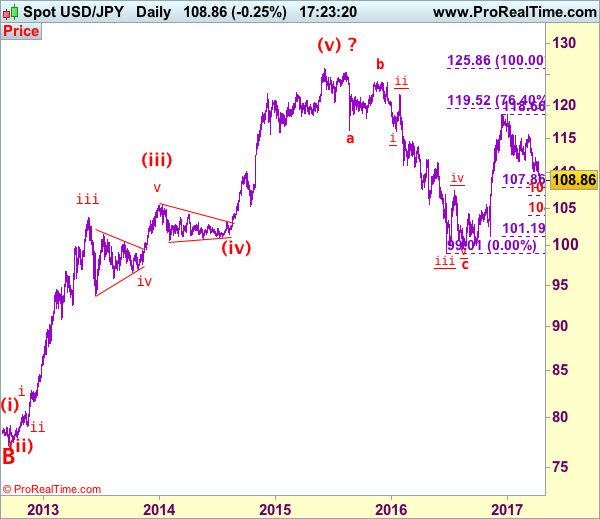
The greenback only recovered to 111.58 early last week before meeting renewed selling there and price dropped quite sharply from there in line with our bearish expectation, this selloff adds credence to our view that top has been formed at 118.66 and the decline from there is still in progress for further weakness to 118.10-15, below there would extend weakness to 107.85-90 (61.8% Fibonacci retracement of 101.19-118.66), then towards 107.10-20 but reckon 106.75-80 (1.236 times projection of 118.66-111.59 measuring from 115.51) would limit downside and 106.00 should hold, bring rebound later due to oversold condition.
Our preferred count is that, triangle wave IV (with circle) ended at 101.45 and the circle wave V brought dollar down to the record low of 75.31 in 2011 and the subsequent rebound signal major correction has commenced with A leg ended at 84.19, followed by wave B at 77.14 and impulsive wave C is now unfolding (indicated upside target at 125.00 had been met) for gain towards 127.00 level. In the event dollar drops below support at 99.01, this would confirm medium term decline from 125.86 top (2015 high) has resumed for subsequent weakness to 98.00 and possibly 97.00.
Under this count, this wave C is unfolding as impulsive waves with (1) (2), 1 2 ended at 80.67, 79.07, 82.84 and 81.69 respectively, hence the extended wave 3 has ended at 103.74 and wave 4 correction of recent upmove should bring weakness to 92.57, then towards 90.88 but psychological support at 90.00 should limit downside and bring another rally later in wave 5, indicated target at 125.00 had been met and gain to 127.00 cannot be ruled out but reckon price would falter below 130.00.
On the upside, although the rebound from 108.13 (yesterday’s low) suggests consolidation above this level would be seen with initial upside risk for corrective bounce to 110.00, reckon 110.50-60 would limit upside and bring another decline later. Only break of said resistance at 111.58 would abort and suggest a temporary low is formed instead, bring a stronger rebound to resistance at 112.20.
Recommendation: Sell at 110.60 for 108.60 with stop above 111.60.
On the monthly chart, we have changed our preferred count that an impulsive wave is unfolding with major wave III with circle ended at 79.75, then followed by wave IV with circle and is labeled as a triangle with A: 147.64 (11 August, 1998), B: 101.25, C: 135.20, D: 101.67 and E leg ended at 124.14 to end the wave IV with circle. Hence, wave V with circle commenced from there and hit a record low of 75.31, however, the subsequent strong rebound signals this circle wave V has possibly ended there, hence gain to (indicated upside target at 122.00 and 125.00 had been met), the retreat from 125.86 suggests wave A of major correction has ended there and wave B correction back to 99.00, then 95.00 would be seen, however, reckon downside would be limited to 90.00, bring another rebound in wave C next year.


