
Asian markets endured a severe sell-off today as the escalating conflict in the Middle East drove a dramatic surge in global energy prices. Brent and WTI crude both surged toward the 120 per barrel mark, on intensifying fears that the disruption around the Strait of Hormuz could evolve into a prolonged supply shock. The spike in energy prices quickly triggered a broad risk-off wave across the region’s major equity markets.
The magnitude of the sell-off reflected the vulnerability of many Asian economies to rising energy costs. Countries such as Japan and South Korea rely heavily on imported oil, meaning any surge in crude prices effectively acts as a direct tax on economic activity. Higher energy costs raise production expenses, squeeze corporate margins, and weaken household purchasing power.
South Korea saw particularly intense selling pressure. Circuit breakers were triggered for the second time this month as the scale of the market decline forced trading curbs to prevent panic selling. In Japan, Nikkei recorded its worst single-session decline since the “tariff rout” of April last year.
Sentiment stabilized somewhat later in the session after reports that the G7 and the International Energy Agency are convening today to discuss a coordinated release of emergency oil reserves. The prospect of additional supply entering the market helped cool the most extreme speculative positions in oil.
Following the reports, WTI crude prices pulled back toward the 100 level as traders reassessed the immediate upside risks. Some market participants who had been betting on a rapid surge toward 150 began to trim positions in anticipation of policy intervention.
However, the reserve discussions are unlikely to eliminate the underlying energy shock. While IEA members collectively hold around 1.2 billion barrels in public reserves, these stockpiles primarily address temporary supply shortages rather than the logistical disruptions currently affecting the region.
Releasing strategic reserves can help bridge supply gaps for several weeks, but it does little to resolve the shipping bottleneck at the Strait of Hormuz. As long as tanker traffic remains constrained, markets will continue to price a significant risk premium into oil prices.
Complicating matters further are the differing priorities within the G7 and the IEA. Energy-import dependent countries such as Japan may be pushing for immediate action given their heavy reliance on Middle Eastern crude. Japan imports roughly 95% of its oil from the region, making it particularly vulnerable to prolonged disruptions.
At the same time, uncertainty remains over the extent of US participation. President Donald Trump’s rhetoric—framing higher oil prices as a “small price to pay” for strategic objectives—raises doubts about whether Washington will aggressively deploy the Strategic Petroleum Reserve to suppress prices. As long as the war premium remains embedded in energy markets and diplomatic resolution appears distant, regional equities are likely to remain under pressure.
Overall in the currency markets, Loonie is currently the strongest one, followed by Dollar, and then Kiwi. Sterling is the worst, followed by Euro, and then Yen. Aussie and Swiss Franc are positioning in the middle.
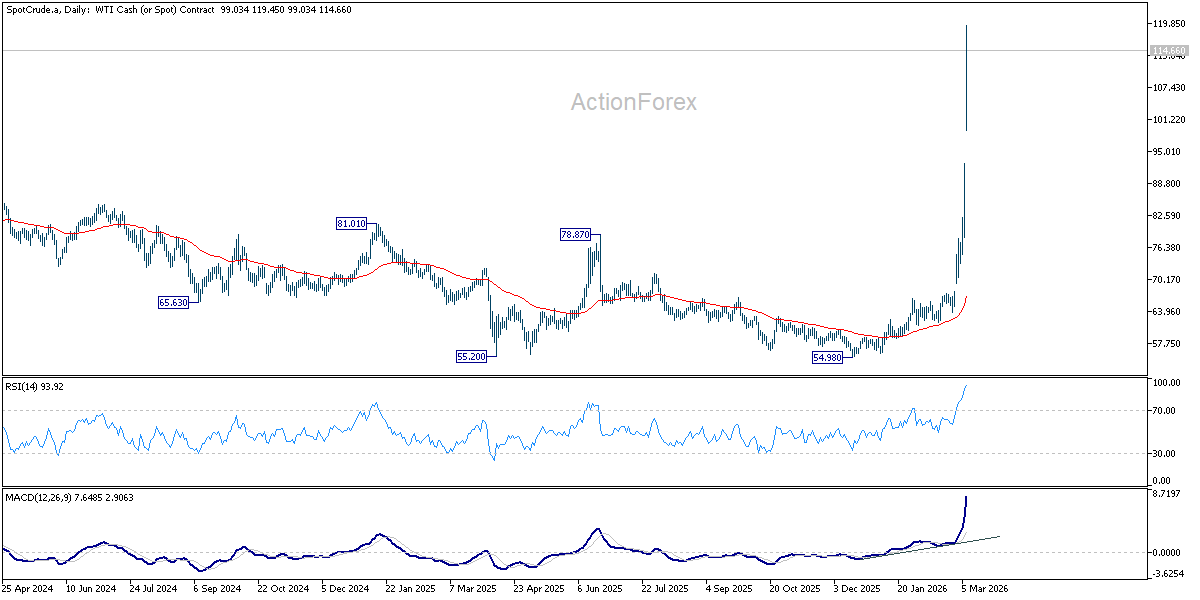
Oil rally accelerates: Could WTI reach 130, 150, or even 200?
WTI crude oil surged above 110 mark at the start of the week, extending an explosive rally that has already lifted prices roughly 50% since the Middle East conflict began on February 28. The latest move followed a violent gap-up at the weekly open, highlighting how quickly markets are adjusting to the possibility that the crisis may evolve into a sustained disruption to global energy supply or even production.
Over the weekend, political developments effectively removed the remaining “diplomatic discount” that had been embedded in oil prices. Markets had previously assumed that negotiations, strategic reserves, or external intervention could eventually stabilize the situation. Those assumptions now appear increasingly fragile.
One key development was Iran’s leadership transition. The official appointment of Mojtaba Khamenei as Supreme Leader following the death of Ali Khamenei is widely interpreted as signaling a harder political stance in Tehran. Markets view the transition as reducing the probability of rapid diplomatic compromise.
At the same time, the US has sent a strong policy signal. President Donald Trump’s recent remarks that higher oil prices are “a very small price to pay” for defeating Iran suggest that Washington is unlikely to prioritize price stabilization through measures such as a Strategic Petroleum Reserve release. Combined with demands for “unconditional surrender,” the comments have removed much of the market’s expectation of near-term de-escalation.
With WTI already above 110, the key question for markets is no longer whether the rally will continue, but how far it could extend if the crisis intensifies. The outlook could be framed in three possible scenarios: 130, 150, and 200 oil.
The 130 Level: The “Geopolitical Spike”
The first scenario centers around the 130 level. This price zone represents what could be described as a “geopolitical spike,” driven primarily by fear and logistical disruption rather than a complete physical shortage of crude supply.
The Strait of Hormuz normally carries roughly 21 million barrels per day, or about 20% of global oil consumption. Currently, around 150 oil tankers are reportedly waiting outside the Strait as shipowners assess security conditions. If this “tanker parking lot” persists for several more days, markets may begin treating the disruption as a sustained supply bottleneck.
Such a scenario could push oil toward the 130 level, similar to the price spikes seen during the early phase of the Russia–Ukraine war in 2022. At that stage, prices would largely reflect risk premiums and logistical friction rather than outright shortages.
The 150 level: The “Force Majeure” Threshold
A second and more severe scenario would involve oil approaching 150. Qatar’s Energy Minister Saad Sherida Al-Kaabi last week warned that both Brent and WTI could reach 150 per barrel within two to three weeks if the situation fails to stabilize.
The significance of the 150 level lies in the potential for a “force majeure” chain reaction. If exporters are unable to move crude through Hormuz, producers could begin legally suspending supply contracts. That would likely trigger panic buying by import-dependent economies.
Meanwhile, the 100% blockage of this route for more than two weeks mathematically could forces price to 150 to “choke off” enough global demand to match the remaining supply.
The 200 Level: The “Structural Damage” Scenario
The most extreme outcome would see oil moving toward 200 mark. This scenario would require a fundamental escalation of the conflict, including direct attacks on major energy infrastructure in the Gulf region.
Facilities such as Saudi Arabia’s Abqaiq processing plant, the UAE’s Upper Zakum field, and Kuwait’s Al-Zour refinery represent critical pillars of the global energy system. If these assets were damaged, the market would no longer be pricing temporary disruption but long-term structural damage to oil supply.
Unlike shipping disruptions, damaged energy infrastructure can take years to restore. In such a scenario, prices approaching 200 would reflect the market pricing in a multi-year global supply deficit rather than a short-term geopolitical shock.
Gold 5,000 support looks vulnerable, break could accelerate selloff to 4,400
Gold began the week on the defensive while Dollar strengthened broadly across currency markets, as the Middle East conflict has entered its second week with no meaningful signs of de-escalation. The metal is now showing signs of fragility near 5,000 psychological level, which is significant due to positioning in the options market. A break below 5000 could trigger a “cascade” of sell-stops, rapidly accelerating the move towards 4,400.
Historically, geopolitical crises tend to support both Dollar and Gold simultaneously as investors seek protection from uncertainty. However, the specific characteristics of the current conflict are shifting the balance toward Dollar.
The fighting has effectively disrupted energy flows through the Strait of Hormuz, one of the world’s most critical oil shipping routes. The resulting energy shock has already pushed WTI crude oil above the 100 mark, creating a powerful inflationary impulse for the global economy. Supply disruptions of this scale typically lead to higher energy prices, which quickly filter through global production chains. Rising transportation costs, manufacturing inputs, and consumer prices can all contribute to renewed inflation pressure.
As energy costs rise, the narrative of imminent policy easing becomes less certain. Instead, investors are once again considering the possibility that interest rates may need to remain elevated for longer than previously expected. This shift is particularly supportive for Dollar.
Gold’s strong performance in the last two years was in part driven by declining real interest rates as central banks moved toward policy easing. When real yields fall, the opportunity cost of holding non-yielding assets like Gold declines, making the metal more attractive. That environment is now potentially reversing.
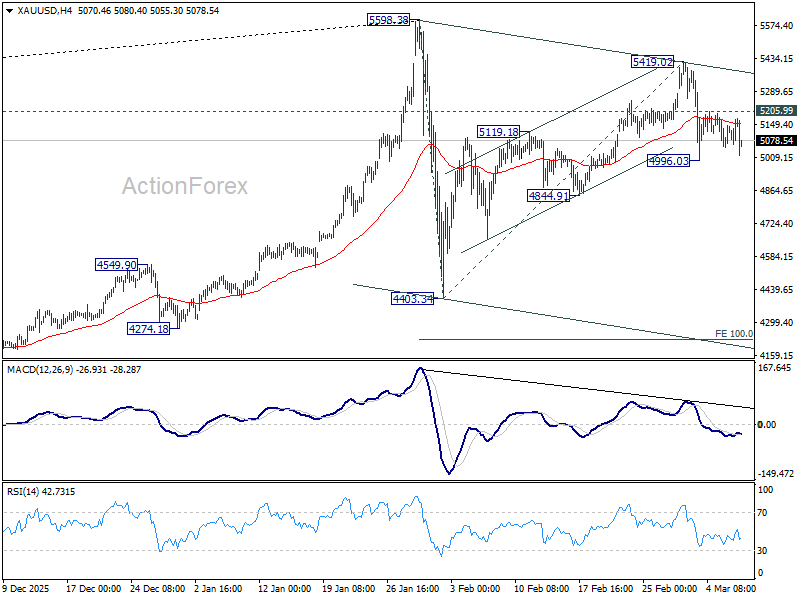
Technically, outlook is unchanged that current fall from 5,419.02 is seen as the third leg of the corrective pattern from 5,598.38 record high. Risk will stay on the downside as long as 5,205.99 minor resistance holds. Break of 4,496.03 temporary low will resume the decline to 4,844.91 support. Firm break there will solidify this case and target 4,403.34 support next.
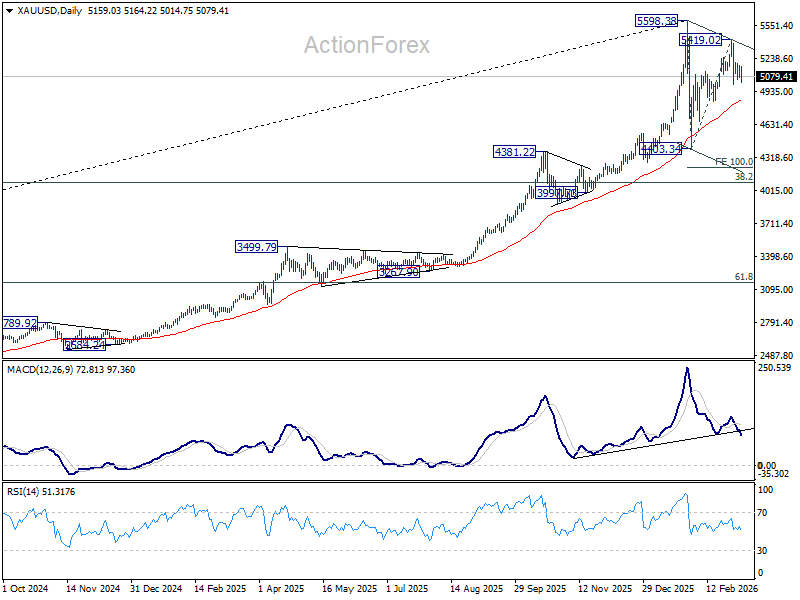
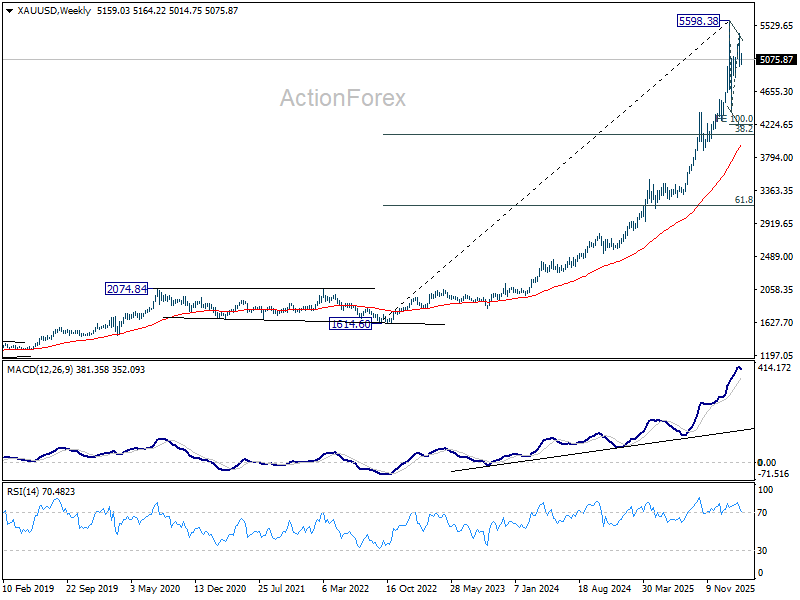
In the bigger picture, Gold is seen as in consolidations to the whole up trend from 1,614.60 (2022 low). The pattern from 5,598.38 could extend to as low as 38.2% retracement of 1,614.60 to 5,598.38 at 4,076.57, or a bit lower to 4,000 psychological level, before bottoming.
Japan wage momentum builds as real earnings rise first time in 13 months
Japan’s wage data delivered an encouraging signal for the BoJ at the start of the year. Real wages rose 1.4% yoy in January, rebounding from December’s -0.1% contraction and marking the first increase in 13 months. The improvement reflects a combination of stronger nominal pay and easing consumer price pressures, suggesting the prolonged squeeze on household purchasing power may finally be easing.
Nominal wage growth was robust. Total cash earnings rose 3.0% yoy, beating expectations of 2.5% and marking the fastest pace since July. Regular pay, or base salary, also climbed 3.0%, the strongest increase since October 1992. Overtime earnings rose 3.3%, the highest level in roughly three years, while special payments—largely one-off bonuses—advanced 3.8%.
The wage gains were sufficient to outpace the consumer inflation rate used by the labor ministry to calculate real wages, which slowed to 1.7% yoy in January. That was the weakest price increase since March 2022, helped by government fuel subsidies and fewer food price hikes.
Momentum in wage negotiations also remains strong. Japan’s largest labor union federation, Rengo, said last week that its member unions are seeking an average wage hike of 5.94% this year. That follows an average increase of 5.25% in 2025, the largest in 34 years, reinforcing expectations that wage growth could remain a central pillar supporting Japan’s domestic demand and the broader policy normalization narrative for the BoJ.
China CPI jumps to 1.3% as Lunar New Year spending boosts inflation
China’s consumer inflation rebounded sharply in February, offering a fresh sign of improving domestic demand. Headline CPI rose from 0.2% yoy to 1.3%, well above expectations of 0.9% and marking the strongest increase in more than three years. On a monthly basis, prices climbed 1.0% mom, also beating economists’ forecasts for a 0.5% rise.
The surge in inflation was largely driven by seasonal factors. A nine-day Lunar New Year holiday boosted domestic travel and consumer spending, pushing service prices higher and lifting the overall CPI reading. Core CPI, which excludes volatile food and fuel prices, strengthened to 1.8% yoy from 0.8% in January, indicating broader price pressures beyond the holiday effect.
Upstream price pressures also showed signs of easing deflation. PPI improved from -1.4% year-on-year to -0.9%, the smallest decline since July 2024 and stronger than expectations of -1.1%. NBS statistician Dong Lijuan said the moderation in producer deflation reflected firmer prices in advanced and emerging industries, as well as capacity management in key industrial sectors.
US CPI, Canada jobs, UK GDP in focus as oil crisis reshapes data week
As we head into this volatile week, the economic calendar is being viewed through a “dual-lens”: the cold, hard data from February (pre-war) versus the reality of $110+ oil prices and the de facto closure of the Strait of Hormuz.
High-Stake Events
1. US CPI: The “Lagging” Reality vs. Future Fear
Current Fed Expectations: For the March 18 meeting, a “Hold” is indeed a done deal. However, the June rate cut—once a high-probability event—is now a coin toss (market pricing has shifted from a 60bp cut expectation for 2026 down to 40bp since the conflict began).
Wednesday’s CPI covers February, a period before the recent energy spike. If this “clean” data shows that core inflation was already sticky (anything above 0.2% mom), it confirms that inflation was not fully tamed even under “normal” conditions.
A hot February CPI combined with current 110 oil creates a “no-cut zone” for the Fed. It suggests that once the March/April energy spike hits the data, inflation will rebound sharply. This would likely push the next rate cut further out to September or December 2026.
2. Canada Jobs: The “Oil vs. Interest Rate” Tug-of-War
The BoC is in a precarious “wait-and-see” mode. While the economy is soft, the oil spike acts as a complex double-edged sword.
As a net exporter, higher oil is a “Terms of Trade” win. It boosts national income, energy sector profits, and CAD demand. At the same time, higher gasoline prices act as a regressive tax on Canadian households, who are already struggling with record debt and mortgage renewals.
If Friday’s report shows a strong labor market (low unemployment, high wage growth), it gives the BoC the “green light” to remain on a prolonged hold or even consider a “hawkish pause.” If jobs are weak, the BoC faces a “stagflation” nightmare: slowing growth but rising energy-driven inflation.
The Silent Movers
1. UK GDP: The BoE’s Narrowing Path
Before the Middle East conflict, a March cut was widely debated. However, with the UK being highly sensitive to energy imports, the “inflationary floor” has risen. Friday’s monthly GDP data (for January) will show if the UK entered 2026 with any momentum.
If GDP is weak, it increases the pressure on the BoE to cut to prevent a recession. If GDP is resilient, the BoE hawks could “global uncertainty” and energy shock as an excuse to push for a hold in March, delaying the cut to May or June to ensure inflation doesn’t roar back.
2. Australia Sentiment: The RBA’s “Live” March Meeting
The RBA is the outlier among major central banks. They hiked in February (to 4.35%) and have signaled they are “not ruling anything out.”
If sentiment has “cratered” following the February move, the RBA would maintain a “Hawkish Hold,” waiting for the full quarterly CPI data in April before acting again in May.
However, if Tuesday’s sentiment data shows businesses are still passing on costs and consumers are still spending despite the February hike, the RBA may feel forced to pull the May hike forward to March. They want to “break the back” of inflation before energy prices push it higher.
Here are some highlights for the week:
United States
- Monday: Consumer Inflation Expectations (Feb).
- Wednesday: Consumer Price Index (Feb).
- Friday: Core PCE Price Index (Jan); GDP (Q4, 2nd Est.); University of Michigan Consumer Sentiment (Mar, Prelim).
Canada
- Friday: Labour Force Survey (Feb) .
Eurozone
- Monday: Sentix Investor Confidence (Mar).
- Friday: Eurozone Industrial Production (Jan).
United Kingdom
- Friday: Monthly GDP (Jan); Industrial and Manufacturing Output (Jan); Trade Balance.
Japan
- Tuesday: Household Spending (Jan).
- Wednesday: Producer Price Index(Feb).
Australia
- Tuesday: Westpac Consumer Confidence (Mar); NAB Business Confidence (Feb).
New Zealand
- Wednesday: Manufacturing Sales (Q4).
- Thursday: Business NZ PMI (Feb).
China
- Monday: Consumer Price Index & Producer Price Index (Feb).
- Tuesday: Balance of Trade (Jan–Feb combined).
EUR/USD Daily Outlook
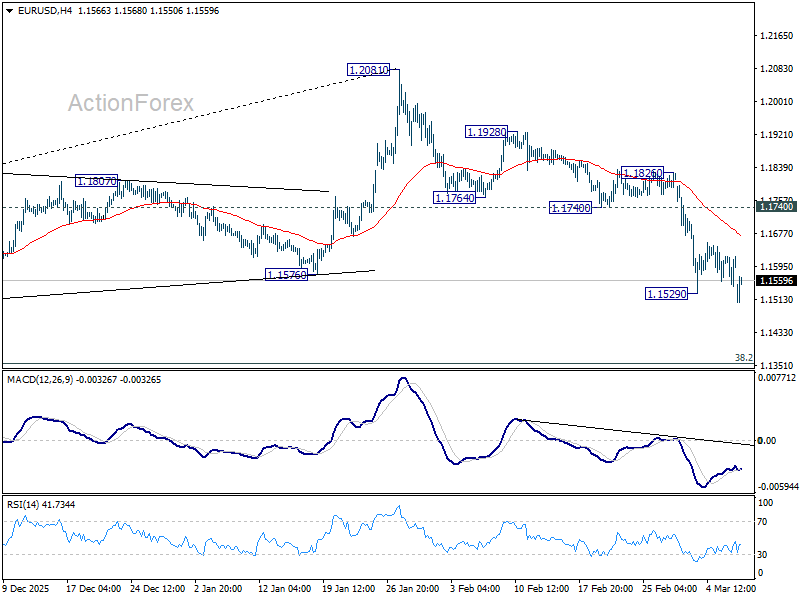
Daily Pivots: (S1) 1.1563; (P) 1.1594; (R1) 1.1641; More….
Intraday bias in EUR/USD is back on the downside with breach of 1.1529 temporary low today. Fall from 1.2081 is resuming and should target 38.2% retracement of 1.0176 to 1.2081 at 1.1353 next. Outlook will remain bearish as long as 1.1740 support turned resistance holds, in case of another recovery.
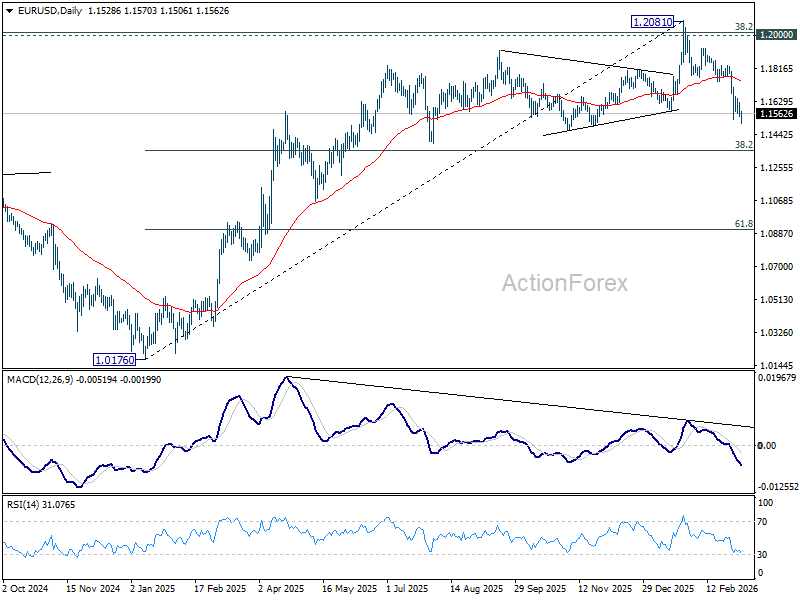
In the bigger picture, a medium term top should be in place at 1.2081 on bearish divergence condition in D MACD. Sustained trading below 55 W EMA (now at 1.1500) should confirm rejection by 1.2 key cluster resistance level. That would also raise the chance that whole up trend from 0.9534 (2022 low) has completed as a three wave corrective bounce too. For now, medium term outlook is neutral at best as long as 1.2081 holds, even in case of rebound.


