
Markets stayed cautious through the European session as a persistent “trust gap” around the Middle East conflict kept investors from fully embracing a peace pivot. Major European indexes traded sideways while US futures edged lower, reflecting a lack of conviction despite earlier optimism.
Oil continues to anchor sentiment. Brent crude is holding in a tight range above 100, signaling that traders are not pricing in a lasting de-escalation. The absence of tangible progress—such as a reopening of the Strait of Hormuz—has left markets reluctant to extend risk-on positioning.
Against this backdrop, today’s flash PMI releases offer a clearer macro signal. While they have not triggered immediate moves in FX markets, they provide what can be seen as a “smoking gun” for emerging stagflation risks stemming from the Middle East conflict. The key takeaway is not just stagflation, but divergence. The same shock—higher energy costs and supply chain disruptions—is being transmitted unevenly across economies, shaping different growth-inflation trade-offs and, in turn, different policy paths.
In the UK, the data point to a clear inflation shock. Manufacturing cost inflation surged to its highest level since the 1992 Sterling crisis, with firms already passing higher costs onto consumers. Despite this, both manufacturing and services remain in expansion. This dynamic strengthens the case for a more hawkish Bank of England stance. Policymakers are effectively “fighting a fire with a hose”.
Australia, by contrast, is facing a growth shock. It is the only major economy in this group where PMI Composite has already fallen into contraction territory, driven by a sharp deterioration in services activity. A further rate hike in May is now far more contentious. While markets still price a reasonable probability of tightening, the growth side of the equation is deteriorating quickly, raising the risk that additional hikes could push the economy into a deeper downturn.
In the Eurozone, the picture is more muddled. Manufacturing activity has shown some improvement, but services are close to stalling, leaving the Composite reading hovering near stagnation. This split creates a policy “tug-of-war” within the ECB. With growth estimated at around 0.1% and inflation pressures building toward 3%, the ECB faces a classic stagflation dilemma. The likely response is a wait-and-see approach, particularly as policymakers assess whether energy prices push materially higher.
Japan stands out as relatively resilient for now. Business activity remains in expansion, supported by stable demand, although rising energy costs are beginning to filter through. Inflation is likely to pick up again as the effects of subsidies fade. But for now, Japan could still “enjoying the last bit of sunshine”.
In currency markets, these divergences are becoming clearer. Sterling is the strongest performer for the week so far, followed by Yen and Euro, while Australian Dollar leads losses alongside Kiwi. Dollar and Swiss Franc are more neutral, reflecting the broader uncertainty. Until geopolitical clarity emerges, markets are likely to remain caught between fragile optimism and persistent stagflation risks.
In Europe, at the time of writing, FTSE is down -0.24%. DAX is down -0.88%. CAC is down -0.39%. UK 10-year yield is up 0.037 at 4.894. Germany 10-year yield is up 0.035 at 3.043. Earlier in Asia, Nikkei rose 1.43%. Hong Kong HSI rose 2.79%. China Shanghai SSE rose 1.78%. Singapore Strait Times rose 0.44%. Japan 10-year JGB yield fell -0.052 to 2.271.
Eurozone PMIs point to stagflation with 3% inflation and 0.1% growth
Eurozone PMI data point to rising stagflation risks, with inflation nearing 3% while growth slows to just 0.1%. Surging energy costs and weakening demand are squeezing activity and complicating the ECB’s policy outlook. Read more.
UK PMIs show manufacturing cost inflation at highest since 1992 Sterling crisis
UK PMI data show manufacturing cost inflation surging to its highest since the 1992 Sterling crisis, as energy prices and supply disruptions hit growth and raise stagflation risks. Read More.
BoJ’s Ueda: Inflation to rise moderately, food tax cut impact limited
BoJ Governor Kazuo Ueda expects inflation to rise moderately, supported by a strengthening wage-price cycle, while downplaying the long-term impact of a proposed food tax cut. Read more.
Japan core CPI falls to 1.7% in February, as energy costs drag inflation lower
Japan CPI data point to easing inflation momentum driven by energy costs, though core-core inflation suggests underlying pressures remain. Read more.
Japan PMI composite falls to 52.5, war lifts costs and hits sentiment
Japan’s PMI data show growth cooling as input costs surge and business sentiment weakens. The Middle East conflict is lifting energy prices and disrupting supply chains, squeezing margins and raising uncertainty. Read more.
Australia PMI composite falls to 47, cost inflation hits 3-yr high on Middle East conflict
Australia’s PMI data signal a sharp shift into contraction as demand weakens and cost inflation surges to a three-year high. The combination highlights early stagflation risks as the Middle East shock begins to hit growth and prices. Read more.
RBNZ’s Breman warns of inflation spike but cautions against overreaction
RBNZ Governor Anna Breman warns the Middle East conflict will lift inflation while weighing on growth, but stresses policy must avoid overreacting to temporary shocks. The focus remains on preventing short-term price spikes from becoming persistent inflation. Read more.
GBP/USD Mid-Day Outlook
Daily Pivots: (S1) 1.3300; (P) 1.3389; (R1) 1.3522; More…
GBP/USD is still bounded in established range above 1.3216 and intraday bias remains neutral at this point. With 1.3482 resistance intact, further decline is in favor. On the downside, below 1.3216 will resume the fall from 1.3867 to 1.3008 structural support. However, decisive break of 1.3482 will argue that the fall from 1.3867 has completed, and turn bias back to the upside for 61.8% retracement of 1.3867 to 1.3216 at 1.3618.
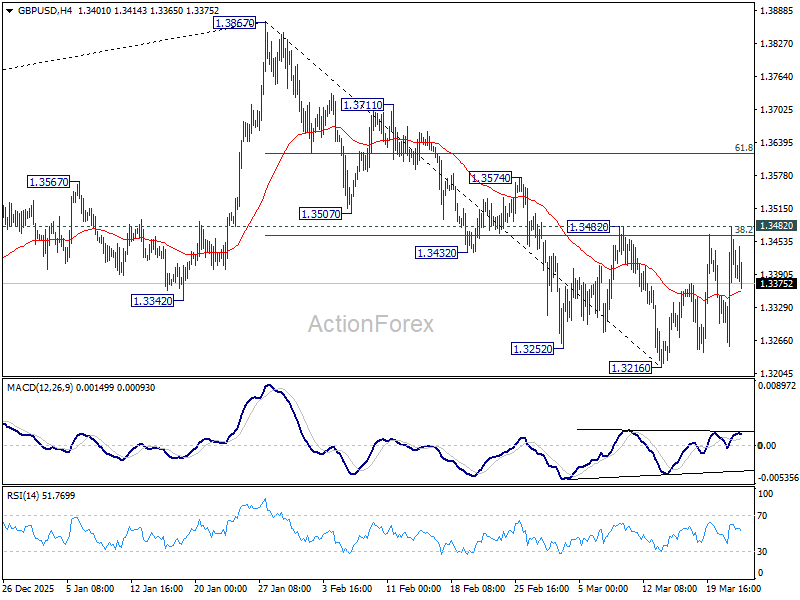
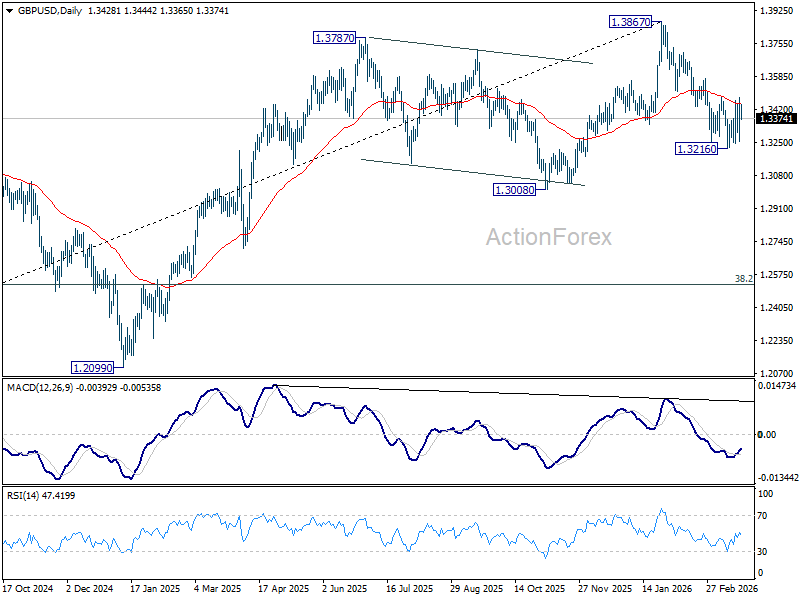
In the bigger picture, considering bearish divergence condition in both D and W MACD, a medium term top should be in place at 1.3867. Firm break of 1.3008 support will argue that fall from 1.3867 is at least correcting the rise from 1.0351 (2022 low) with risk of bearish reversal. That would open up further decline to 38.2% retracement of 1.0351 to 1.3867 at 1.2524. For now, medium term outlook will be neutral at best as long as 1.3867 resistance holds, or until further development.


