
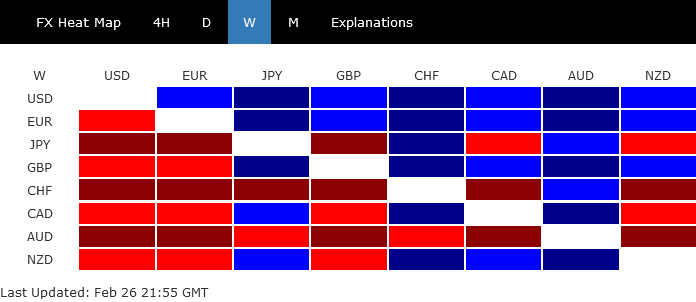
Just after DOW hit new record high in the middle of last week, the rally was choked by skyrocketing treasury yields. Dollar surprisingly ended as the strongest one for the week, followed by Euro and then Sterling. Australian Dollar suffered most as it reversed some of the month’s gains. Swiss Franc and Yen were the next weakest, as they were unable to reverse earlier steep losses in the week. The movements might be exaggerated by month end position adjustments. Yet, the theme of yield and inflation are likely to stay. And March would be an interesting end to the quarter.
The is room for 10-year yield to extend the rally to 2%. But 30-year yield already attempted corresponding level at around 2.45. Pull back in 30-year yield ahead could drag down 10-year yield. That might give stock indices a breather help them stay in up trend. However, extended strength in metals could lift inflation expectations further, as well as yields. That could in turn send stocks lower to confirm medium term correction. Dollar index is currently seen as bounded in sideway consolidation, and will need confirmation of a turn in the markets to lift it out of the range.
Warnings from ECB Schnabel and BoE Haldane
Before going into some charts, we’d like to recap that while most central bank officials sounded unconcerned with surging yields and inflation, two of the them offered different view. As the world starts to enter into a post pandemic phase, these two topics could dominate the markets ahead. Opinions of central banks could start to divide.
ECB Executive Board Member Isabel Schnabel warned in a speech, “a rise in real long-term rates at the early stages of the recovery, even if reflecting improved growth prospects, may withdraw vital policy support too early and too abruptly given the still fragile state of the economy. Policy will then have to step up its level of support.”
BoE Chief Economist Andy Haldane warned in a speech, “there is a tangible risk inflation proves more difficult to tame, requiring monetary policymakers to act more assertively than is currently priced into financial markets. People are right to caution about the risks of central banks acting too conservatively by tightening policy prematurely. But, for me, the greater risk at present is of central bank complacency allowing the inflationary (big) cat out of the bag.”.
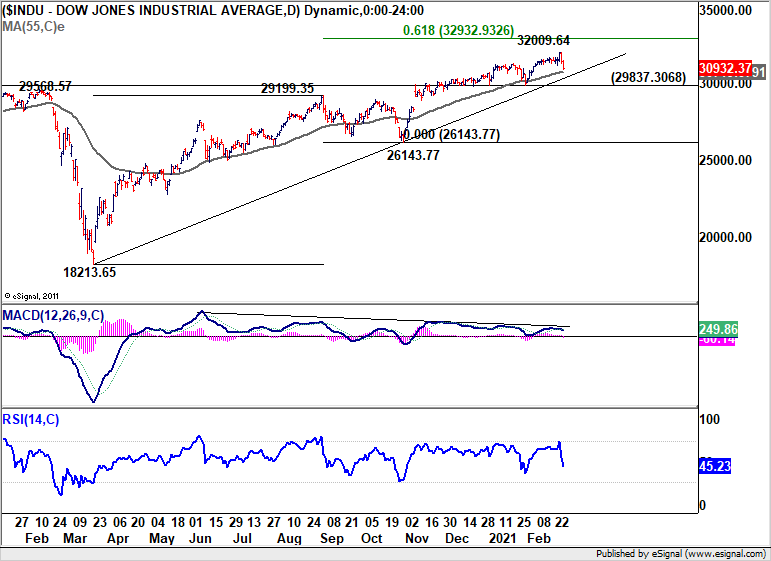
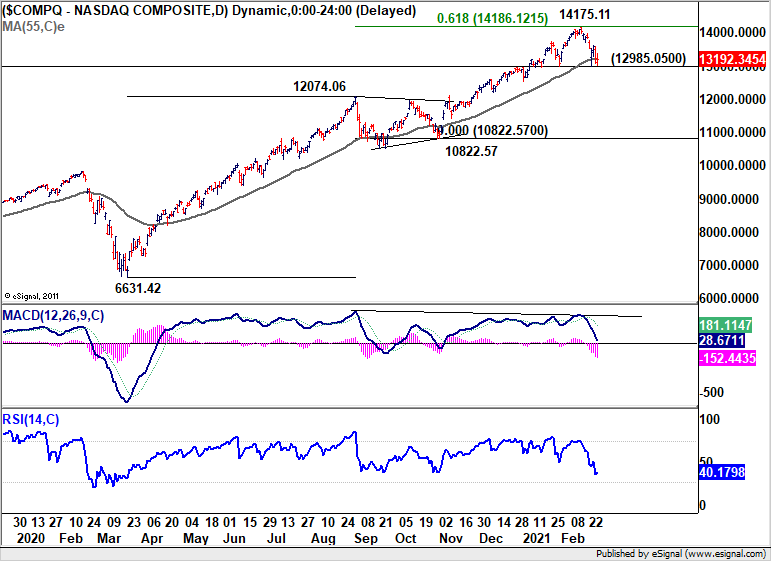
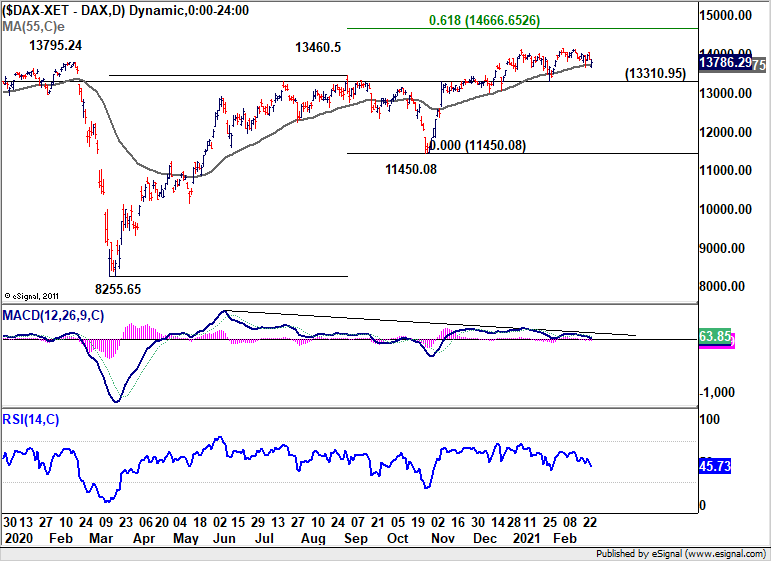
DOW, NASDAQ, DAX and Nikkei still in up trend despite pull back
DOW surged to new record high at 32009.64 before falling steeply to close the week at 30932.37. We’re talking about over 1000 pts reversal from the top. Bearish divergence condition in daily MACD also indicates persistent loss of upside momentum. Yet, the index staying above the rising 55 day EMA (now at 30719.87). Thus, there is no clear indication of trend reversal yet. We might still see another rally through 32009.64 to 61.8% projection of 18213.65 to 29199.35 from 26143.77 at 32932.93. However, firm break of the 55 day EMA will be an early sign of medium term topping, and turn focus to 29837.30 support for confirmation.
While NASDAQ looks a bit more vulnerable, it’s indeed still trying to draw support from 55 day EMA (now at 13198.25), and 12985.05 support. Friday’s 0.56% rebound was also a sign of stabilization. The index could be turning into a sideway pattern. Nevertheless, bearish divergence condition in daily MACD indicates loss of upside momentum. NASDAQ has also just missed 61.8% projection of 6631.42 to 12074.06 from 10822.57 at 14186.12. Firm break of 12985.05 will bring deeper correction to 12074.06 resistance turned support.
As for German DAX, upside momentum has been diminishing as seen in daily MACD. Yet, it’s also holding on to rising 55 day EMA for now. The up trend could still extend again to 61.8% projection of 8255.65 to 13460.50 from 11450.08 at 4666.65. Though, sustained break of 55 day EMA will be a sign of medium term correction, and turn focus to 13310.95 support for confirmation.
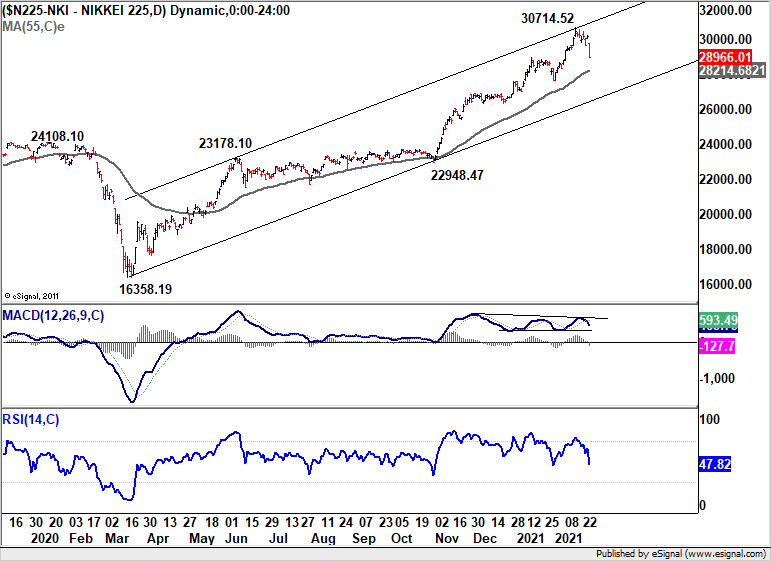
As for Japanese Nikkei, the rejection by medium term channel resistance was not something abnormal. It could be heading back towards 55 day EMA (now at 28214.68) as a correction. But the up trend from 16358.19 is not under any threat, even remotely.
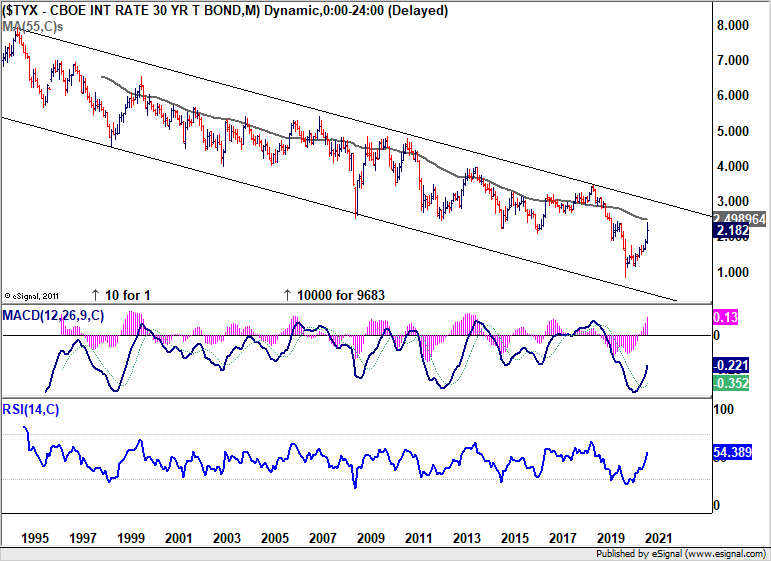
10-yr and 30-yr yields to target 2% and 3% levels?
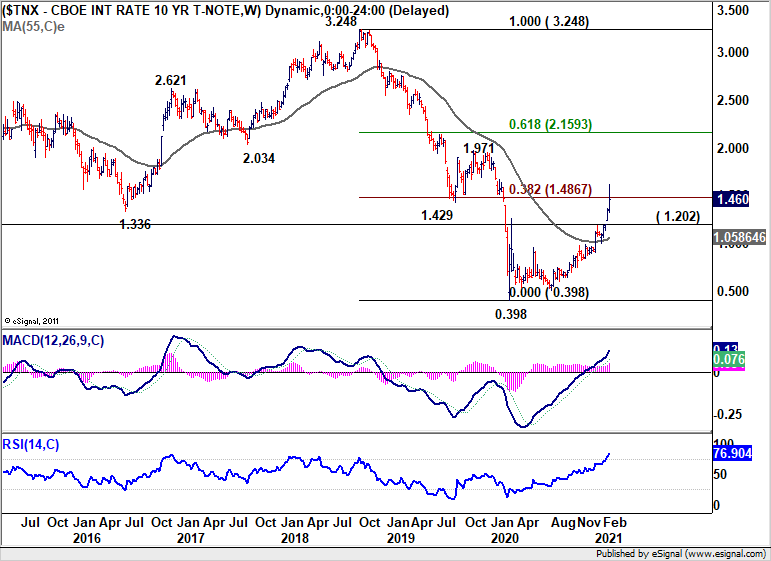
US 10-year yield’s up trend accelerated last week and reached as high as 1.614, before paring some gains to close at 1.460. It managed to close above an important long term resistance zone of 1.336/1.429. Also, 38.2% retracement of 3.248 to 0.398 at 1.486 was taken out. Medium term outlook will clearly stay bullish as long as TNX stays above 1.202 support, lower part of the gap two weeks ago. We’re tentatively looking at 2.0 handle as target, which coincides with 1.971 resistance, 55 month EMA at 1.995, as well as 61.8% retracement of 3.248 to 0.398 at 2.159.
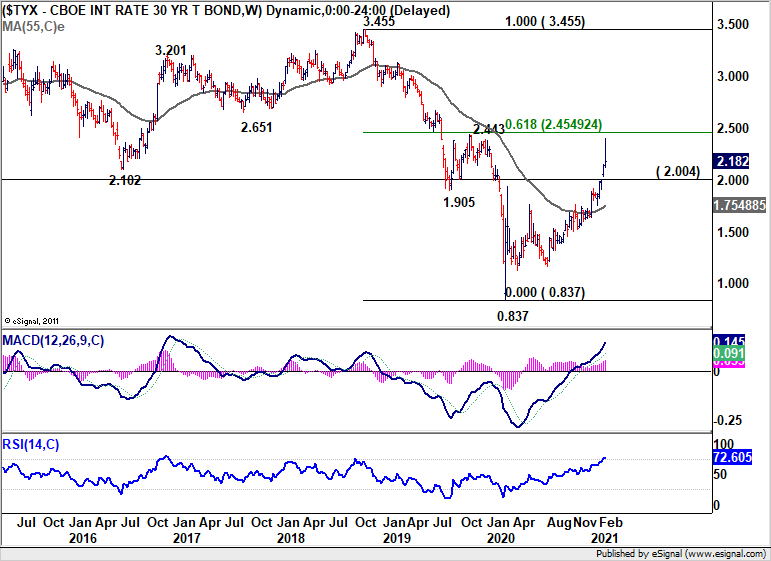
30-year yield was even stronger, and hit as high as 2.402. It was already close to the corresponding target zone of TNX. That is, 2.443 resistance, 55 month EMA at 2.498, and 61.8% retracement of 3.455 to 0.937 at 2.454. Outlook will stay bullish as long as 2.004 support holds. Another round of rally could push TYX to long term channel resistance at around 3.1. Though, rejection by the mentioned resistance zone would at least bring some pull back. That, if happens, could drag down TNX.
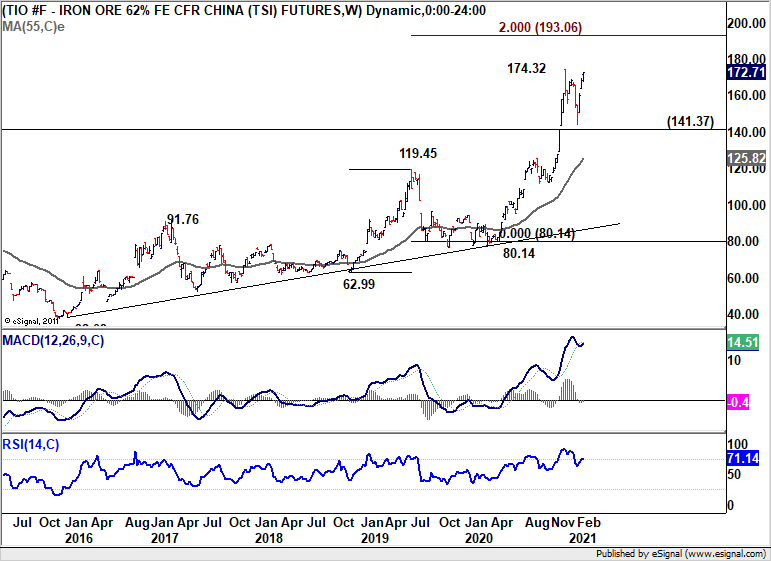
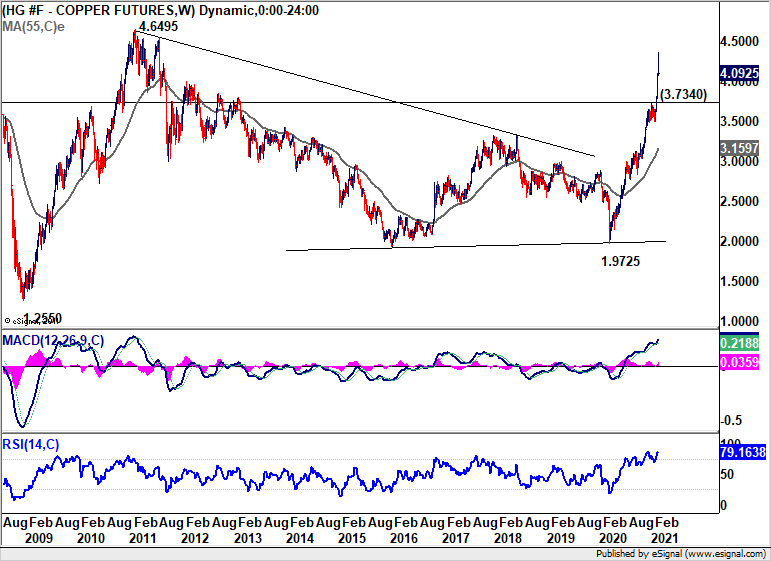
Iron ore ready for up trend resumption, Copper bullish despite losing momentum
Metals continued to be strong last week. Iron ore’s rally last week argues that correction could have completed after successfully defending the gap support at 141.37 (week of Nov 30). Immediate focus is back on 174.32 high this week. Firm break there will resume the long term up trend. Next target for TIO is 200% projection of 62.99 to 119.45 from 80.14 at 193.06.
Copper urged to as high as 4.363 last week, but gave up nearly all gains to close at 4.092. It could start to lose momentum approaching 4.6495 key resistance (2011 high). But still break of 3.734 support is needed to indicate medium topping. Or, it should at least have a concrete test on 4.6495 before turning into a medium term correction.
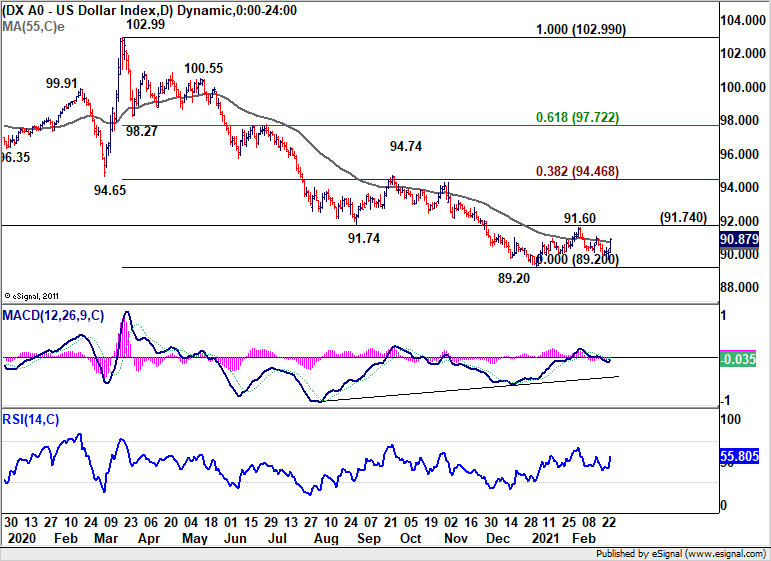
Dollar index extending sideway consolidation from 89.2 with another rise
Dollar index rebounded strongly last week to close at 90.87, back above 55 day EMA. Still, such rebound is seen as part of the sideway consolidation pattern from 89.20 only, as the third leg. Hence, while further rise might be seen, 91.74 support turn resistance could provide the strong resistance to limit upside again. Nevertheless, firm break of 91.74 will open up strong rise to 38.2% retracement of 102.99 to 89.20 at 94.46. That could be a signal to confirm the turn in other markets.
AUD/USD Weekly Outlook
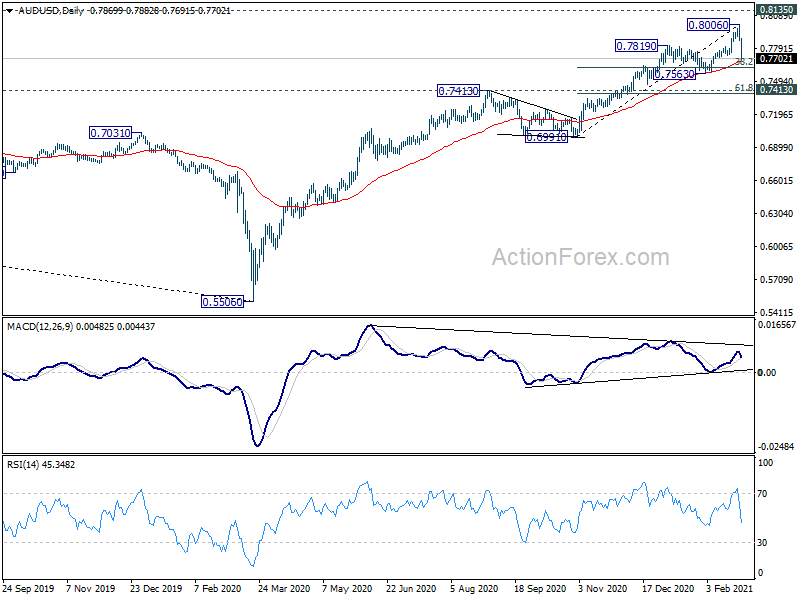
AUD/USD edged higher to 0.8006 last week but dropped sharply from there. With a short term top in place, initial bias is mildly on the downside this week for deeper pull back. But outlook will remain bullish as long as 0.7563 support holds. On the upside, above 0.7844 minor resistance will turn bias to the upside for retesting 0.8006. Break till extend larger up trend from 0.5506. However, decisive break of 0.7563 will bring deeper correction.
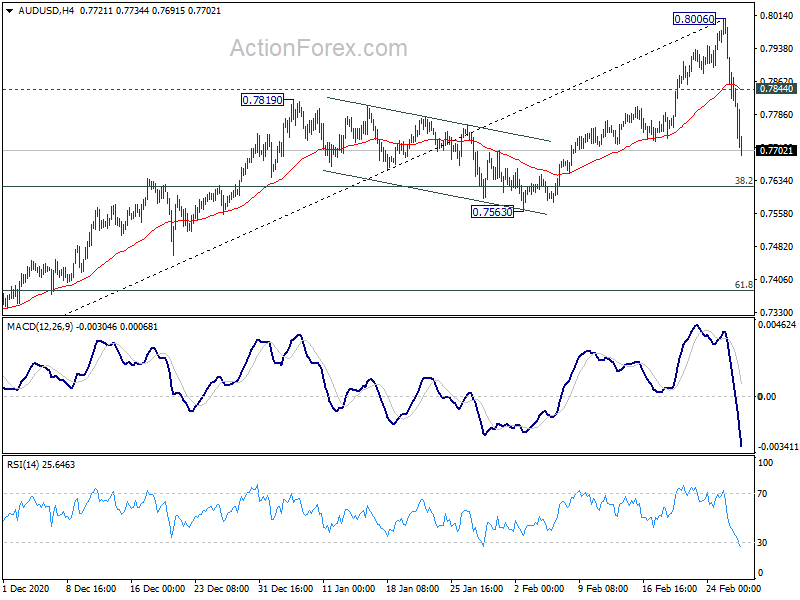
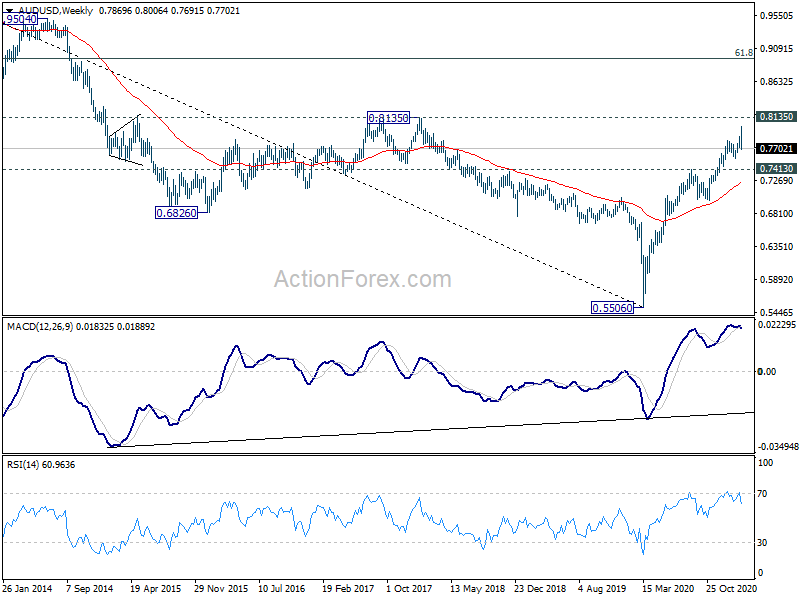
In the bigger picture, whole down trend from 1.1079 (2001 high) should have completed at 0.5506 (2020 low) already. Rise from 0.5506 could either be the start of a long term up trend, or a corrective rise. Reactions to 0.8135 key resistance will reveal which case it is. But in any case, medium term rally is expected to continue as long as 0.7413 resistance turned support holds.
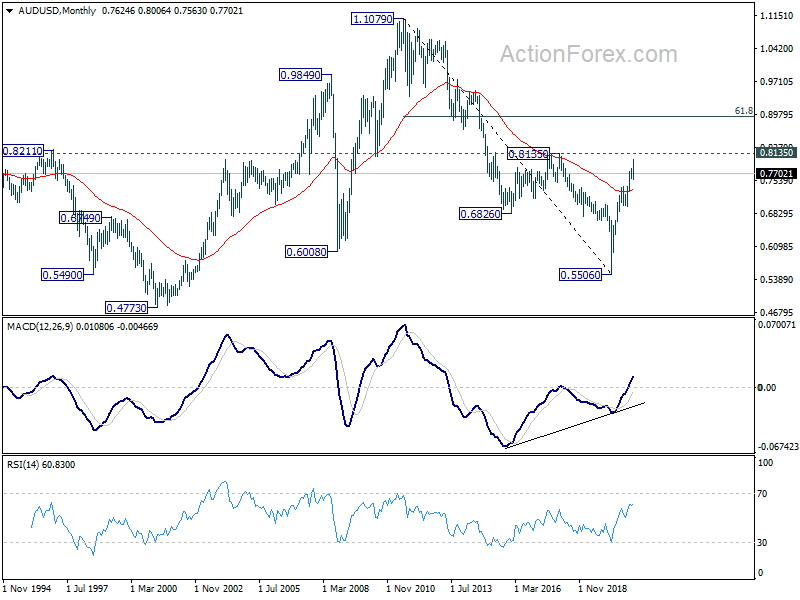
In the longer term picture, 0.5506 is a long term bottom, on bullish convergence condition in monthly MACD. Focus is now back on 0.8135 structural resistance. Decisive break there will raise the chance that rise from 0.5506 is an impulsive up trend. Next target should be 61.8% retracement at 0.8950 and above. Though, rejection by 0.8135 will keep the case of medium to long term sideway consolidation open.


