
As the global financial markets tread through turbulent waters marked by escalating treasury yields and declining stocks, the US Dollar emerged as a beacon of strength. A noticeable uplift in the currency was observed last week, an upward motion fuelled by the twin factors of soaring treasury yields and a pervasive risk-averse sentiment that gripped the global markets. The slight retraction of Dollar on Friday could be attributed more to end-of-quarter position adjustments than a shift in the currency’s overarching bullish tone.
Investors’ growing doubts regarding Fed’s capability to ensure a soft landing for US economy may exacerbate market jitters in the coming days. Adding to these concerns is the rapid normalization of the yield curve, signaling heightened recession risks. In such an environment, Dollar’s potential to ascend is potentiated if both risk aversion in the market and the rally in yields gain further momentum.
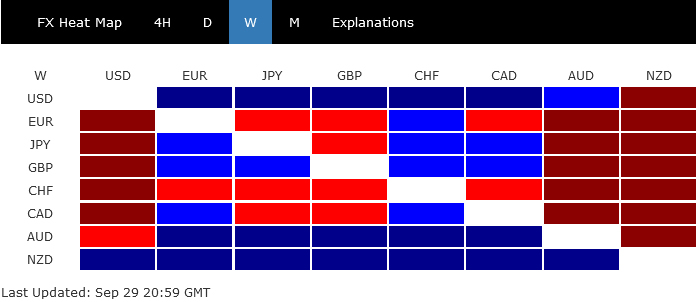
Yet, in the weekly performance matrix, Dollar, despite its robust showing, was eclipsed by New Zealand Dollar, with Australian Dollar trailing close behind. Kiwi and Aussie’s resilience, perhaps unexpectedly, could be tethered to a tentative revival of investor confidence in China’s economic outlook. However, this glimmer of optimism is tempered by a residue of caution. For these antipodean currencies to firmly establish their rebound, tangible evidence of renewed investor confidence in China will be imperative.
On the other end of the spectrum, Swiss Franc and Euro languished at the lower echelons, marked as the week’s underperformers, with Canadian Dollar not far ahead. Sterling and Yen presented a mixed bag.
Onset of whirlwind? Stocks plunge and yields skyrocket as yield curve normalizes swiftly
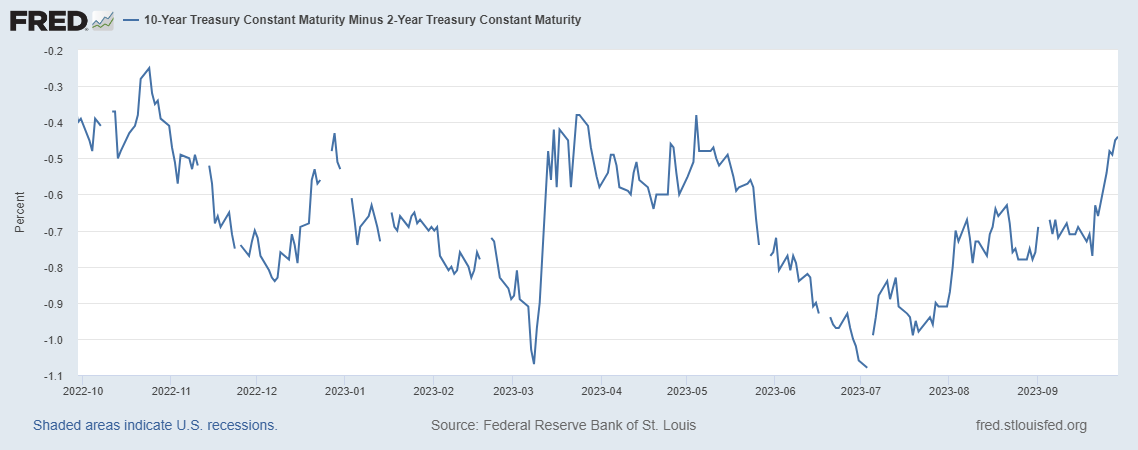
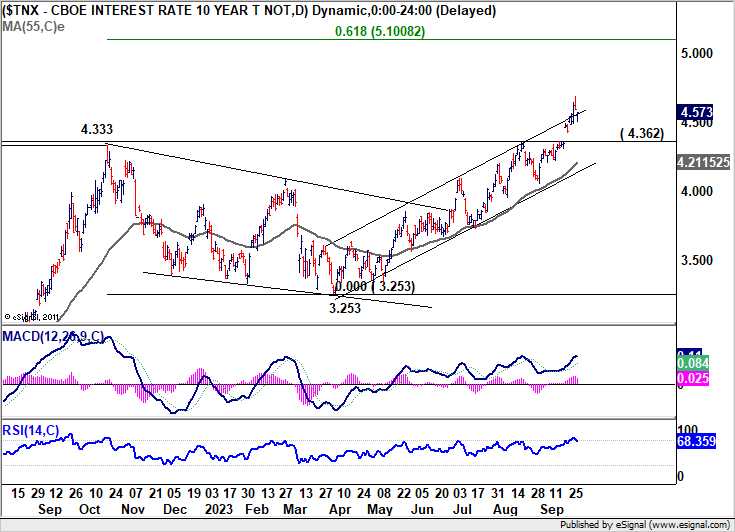
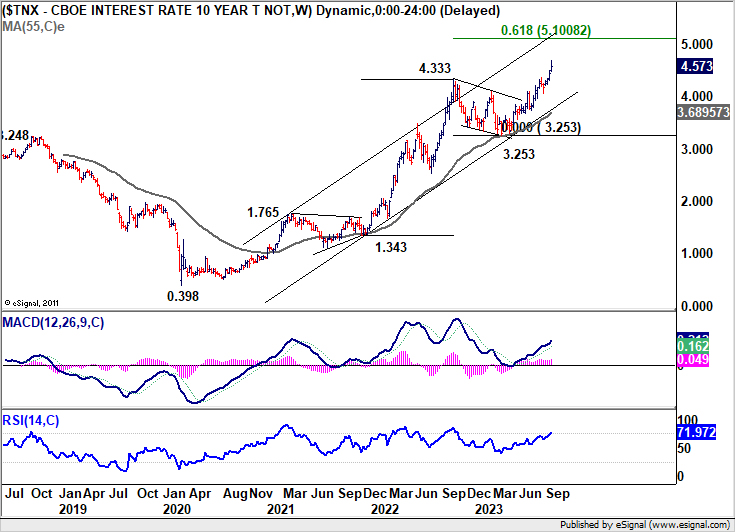
The financial markets in the US experienced a turbulent week, characterized by a sharp surge in long-term Treasury yields and a continued correction in the stock markets. 10-year yields reached a new 16-year peak, registering the largest weekly increase since July, while 30-year yield ascended to levels unseen since 2010. Concurrently, the yield curve underwent a swift normalization, with 10-year vs. 2-year Treasury spread narrowing significantly.
US stock markets also felt the pressure, with both DOW and S&P 500 closing the week in the negative, showing declines of about -1.3% and -0.7% respectively. To add to the tumult, S&P 500 and NASDAQ registered their most substantial monthly percentage declines for the year, with all three major indexes posting quarterly drops for the first time in 2023.
The risk-off sentiment was primarily fueled by expectations of persistently high interest rates and growing doubts regarding Fed’s ability to engineer a soft landing for the economy. High interest rates, coupled with escalating energy prices, are anticipated to dampen consumer spending, potentially leading to a more pronounced economic downturn than expected. The shadow of another partial US government shutdown further exacerbates the uncertainty, posing a threat to investor confidence.
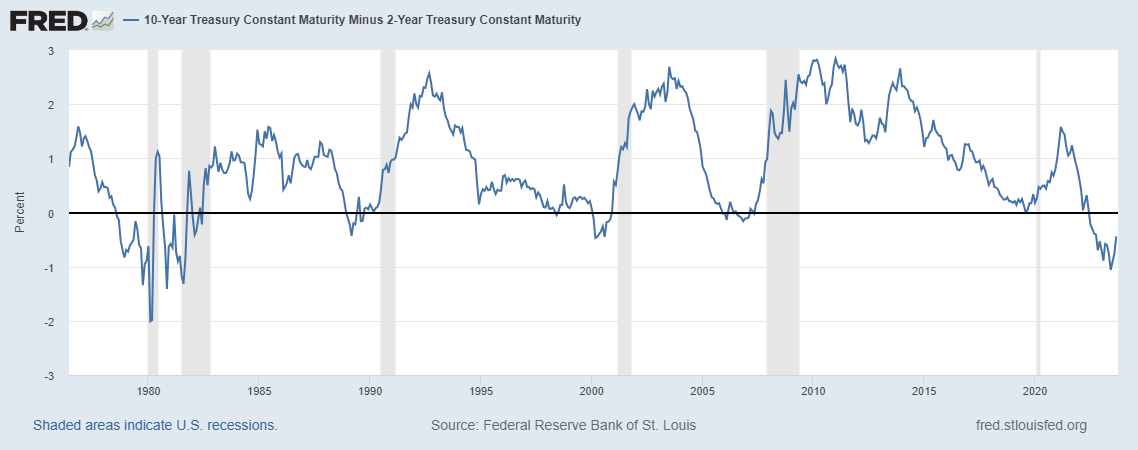
It’s been pointed out here multiple times before. Historically, normalization of the inverted 10- to 2-year yield curve could be a precursor to a looming recession. Although not yet a certainty, a spread below 0.4 could signal a rapid deterioration in outlook.
On a technical note, 10-year yield’s break of the medium-term rising channel resistance could seen as tentative sign of upside acceleration. Near term outlook will stay bullish as long as 4.362 resistance turned support holds. Next target is 61.8% projection of 1.343 to 4.333 from 3.253 at 5.100 (comparing to 2-yr yield at 5.054 currently).
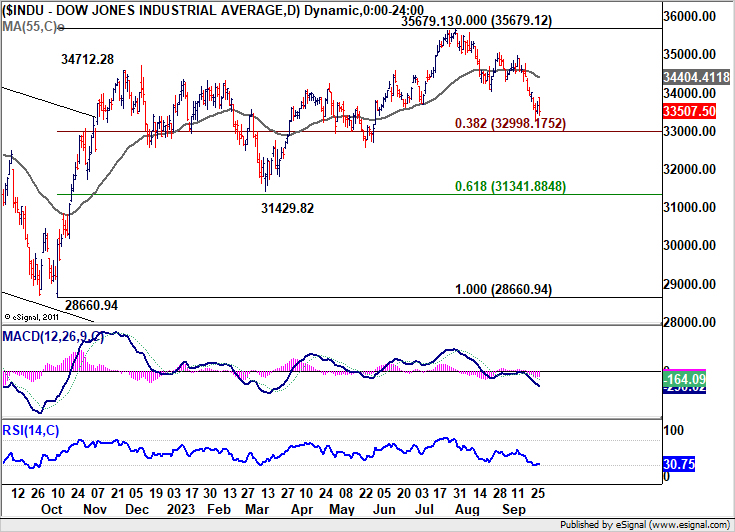
Meanwhile, DOW’s decline resumed last week. The close below 55 W EMA affirmed the case that rise from 28660.94 has completed with three waves up to 35679.13. Immediate focus is now on 38.2% retracement of 28660.94 to 35679.12 at 32998.17. Sustained break there should add more credence to this bearish case and target 61.8% retracement at 31341.88 and below.
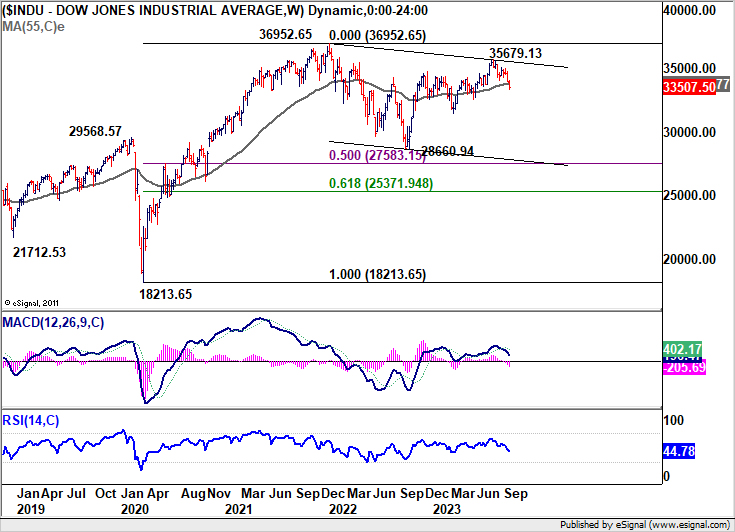
More importantly, as the third leg of the long term pattern from 36952.65 (2022 high), fall from 35679.13 has the potential to extend to 50% retracement of 18213.65 (2020 low) to 36952.65 at 27583.15.
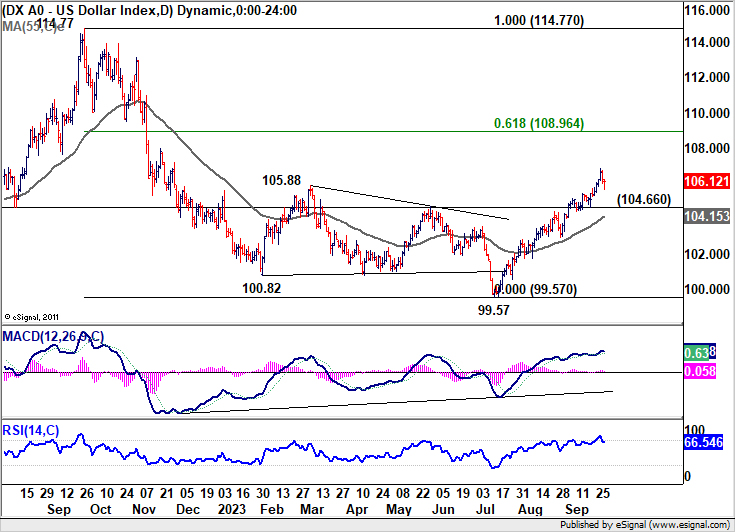
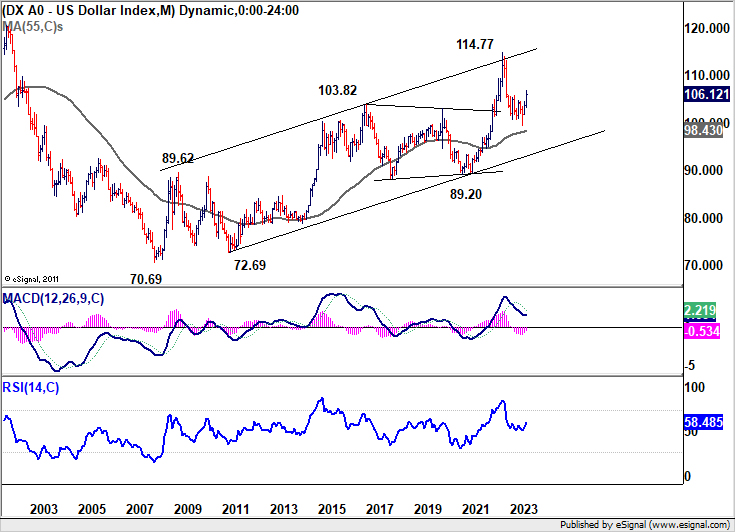
Dollar Index soared to as high as 106.83 before retreating to close at 106.21. Upside momentum appears to be flattening out as seen in D MACD. However, the amalgamation of escalating risk aversion and soaring yields might instigate a renewed upside acceleration. In any case, outlook will stay bullish as long as 104.66 support holds. Next target is 61.8% retracement of 114.77 (2022 high) to 99.57 at 108.96 and above.
Also, the index defended 55 M EMA (now at 98.43) comfortably. Uptrend from 70.69 (2008 low) remains intact. While it’s still early to conclude, current rise from 99.57 has the potential to develop into a sustainable medium term rally through 114.77 to resume the long term up trend.
A glimmer of resilience: AUD and NZD stand firm despite market volatility
Despite the prevailing risk-off sentiment in the global markets last week, Australian and New Zealand Dollar exhibited unexpected resilience. This firm stance could be attributed to a rebound in copper prices and increasing speculation of another interest rate hike by RBNZ.
Moreover, a slight recovery in investor sentiment towards China’s economy, evident from the late rebound in Hong Kong stocks and the Chinese Yuan. However, a pinch of skepticism remains as the ongoing issues in China’s property sector pose a lingering shadow. Also, August PMI data released over the weekend (manufacturing up from 49.7 to 50.2, non-manufacturing up from 51.0 to 51.7) showed no substantial improvement.
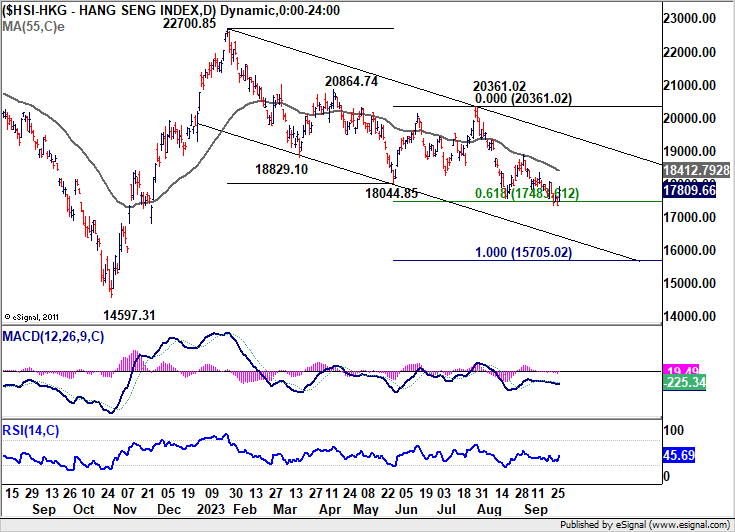
Diving into the technical aspects, Hong Kong’s HSI is at a pivotal juncture where a technical rebound seems plausible. The index defended 61.8% projection of 22700.85 to 18044.85 from 20361.02 twice last week. An extended rebound might be seen in the near term to 55 D EMA (now at 18412.79). Sustained break there could indeed bolster the case of trend reversal, for at least a take on 20361.02 resistance.
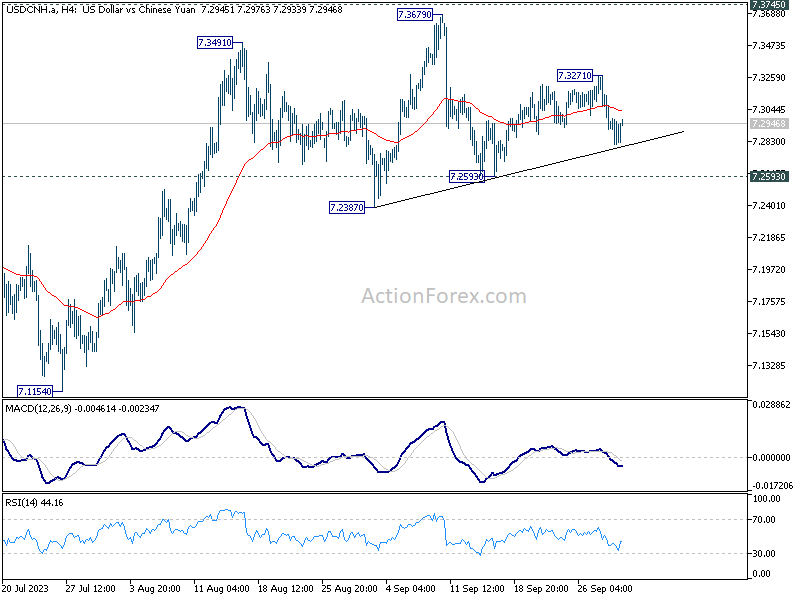
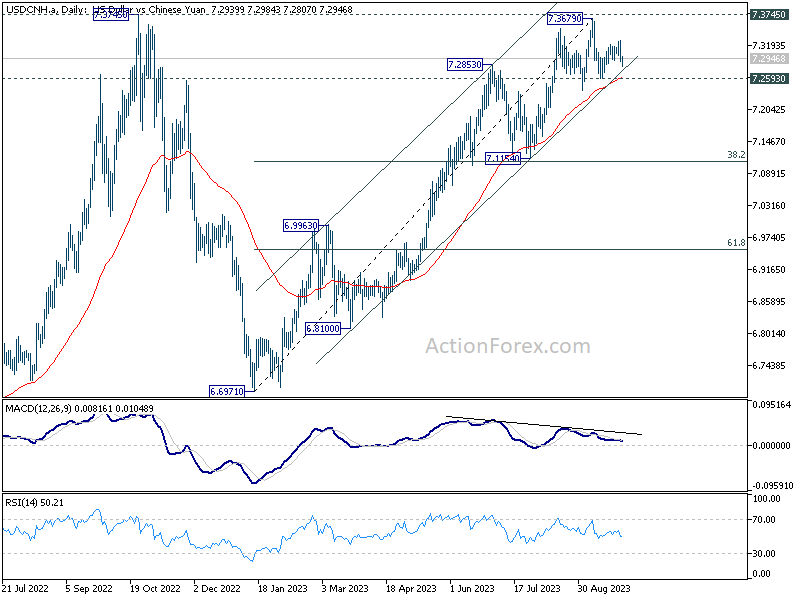
In the currency arena, USD/CNH is potentially crafting a head and shoulders top formation (ls: 7.3491; h: 7.3679; rs: 7.3271), just shy of 7.3745 (2022 high). Decisive break of 7.2593 support, and sustained trading below 55 D EMA (now at 7.2613) should prompt deeper selloff to 7.1154 cluster support (38.2% retracement of 6.6971 to 7.3679 at 7.1117).
Should these technical developments unfold as mentioned, Aussie and Kiwi might gain an upper hand against their European counterparts and potentially even Yen.
NZD/JPY’s uptrend got a fresh breath of life by surpassing the 89.67 resistance. Near term outlook will stay bullish as long as 88.23 support holds. Decisive break of 61.8% projection of 80.42 to 89.67 from 84.19 at 90.62 could prompt upside acceleration to 100% projection at 94.16 in the near term.
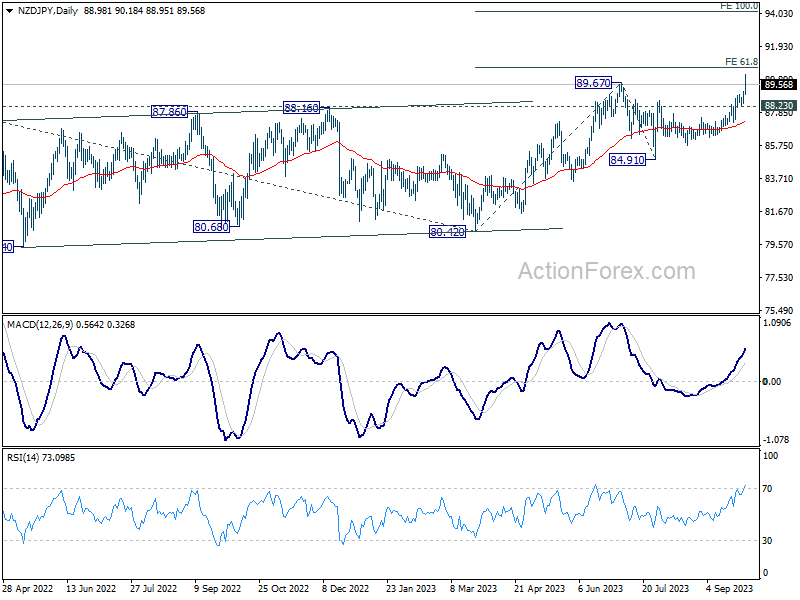
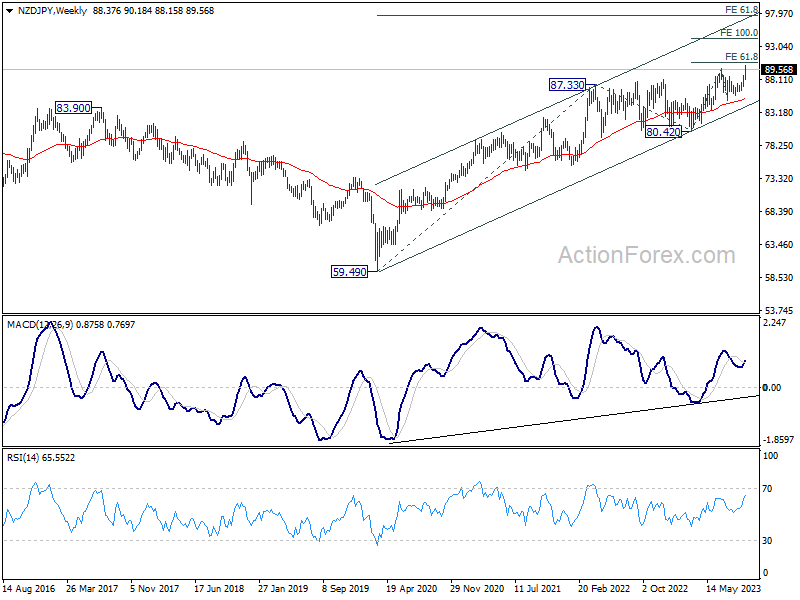
As for the medium term, the up trend from 59.49 (2020 low) could be target 61.8 projection of 59.49 to 87.33 from 80.42 at 97.62.
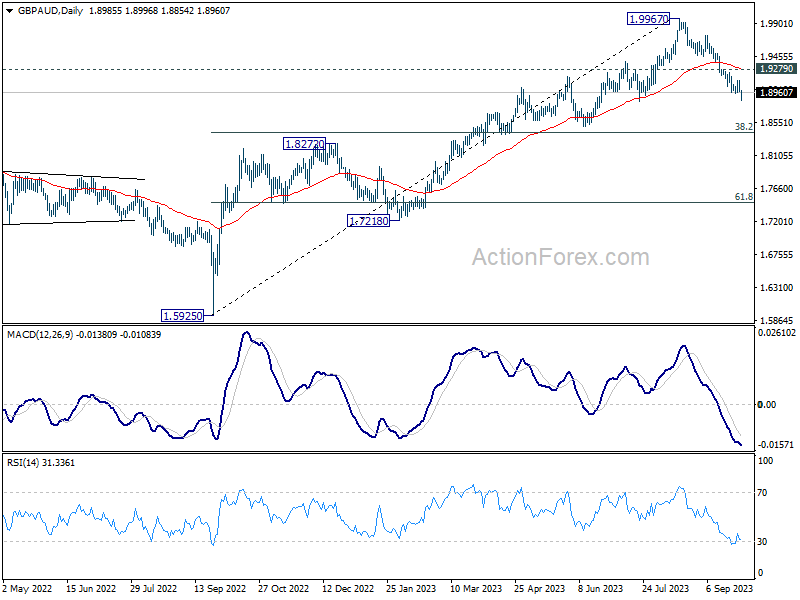
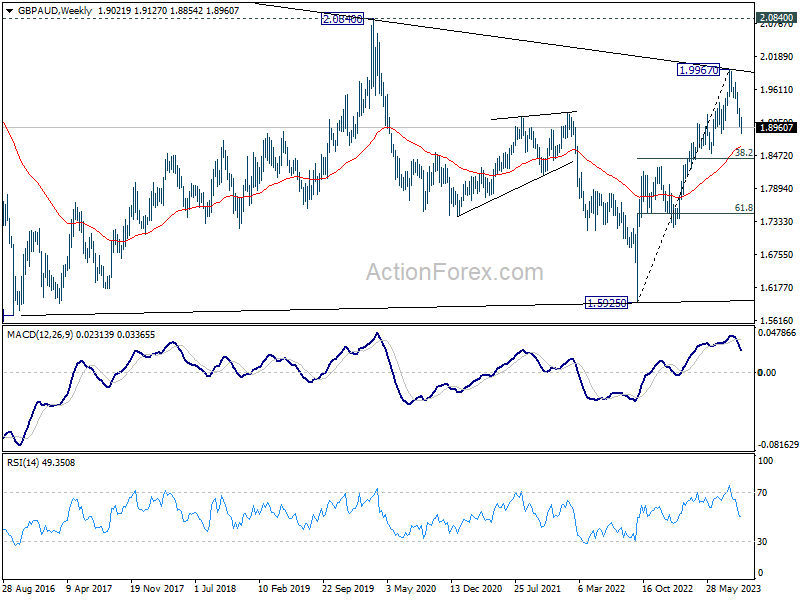
Meanwhile, GBP/AUD’s downturn continued unabated, plunging 1.8854. Near term outlook will stay bearish as long as 1.9279 resistance holds. Current fall should target 55 W EMA (now at 1.8618). Sustained break there will argue that it’s reversing whole rise from 1.5925 (2022 low). Next target will be 38.2% retracement of 1.5925 to 1.9967 at 1.8423, or even further to 61.8% retracement at 1.7469.
AUD/USD Weekly Report
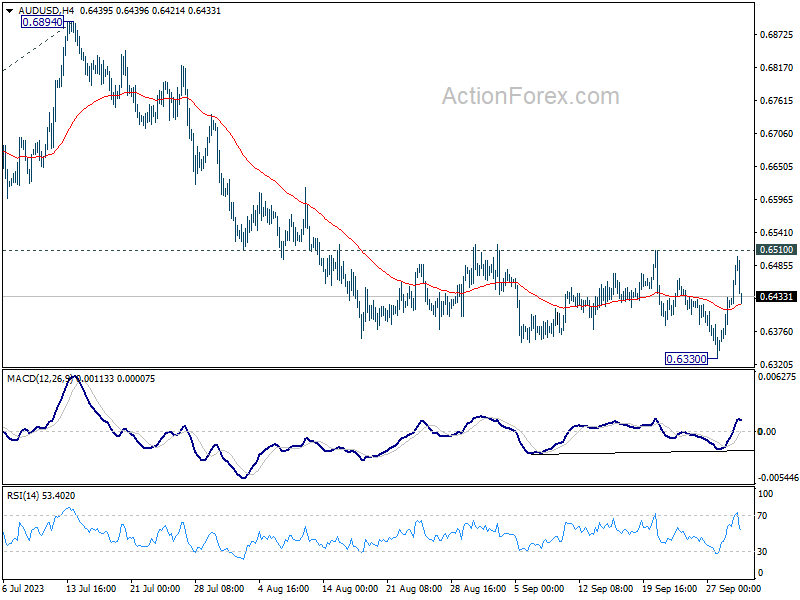
AUD/USD rebounded strongly after initial fall to 0.6630 last week. But upside is capped below 0.6510 resistance. Initial bias remains neutral this week and further fall is in favor. On the downside, break of 0.6330 will resume the whole decline from 0.7156 to 100% projection of 0.7156 to 0.6457 from 0.6894 at 0.6195. However, firm break of 0.6510 will confirm short term bottoming, and turn bias back to the upside.
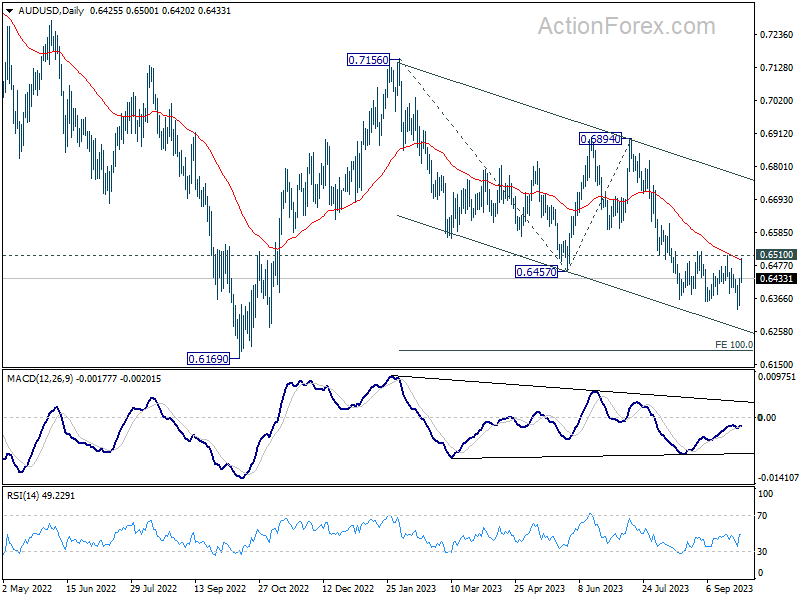
In the bigger picture, down trend from 0.8006 (2021 high) is possibly still in progress. Decisive break of 0.6169 will target 61.8% projection of 0.8006 to 0.6169 to 0.7156 at 0.6021. This will now remain the favored case as long as 0.6894, in case of strong rebound.
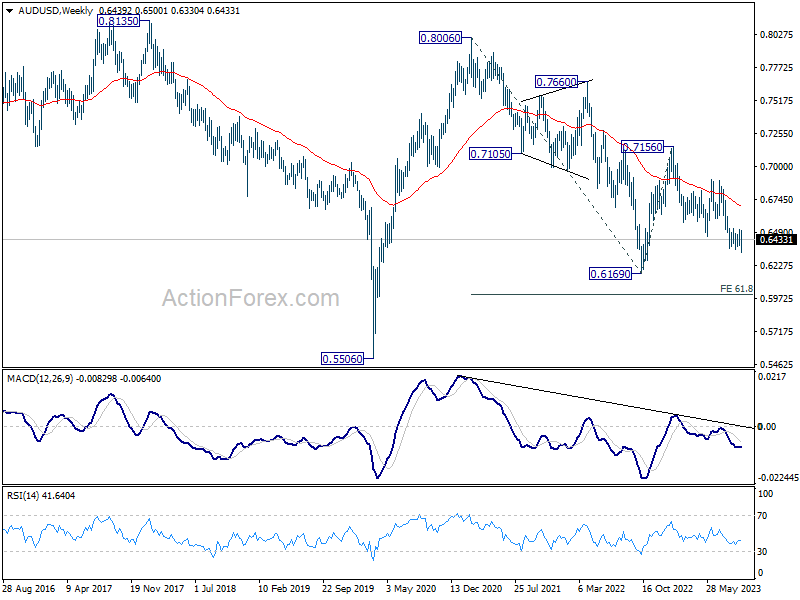
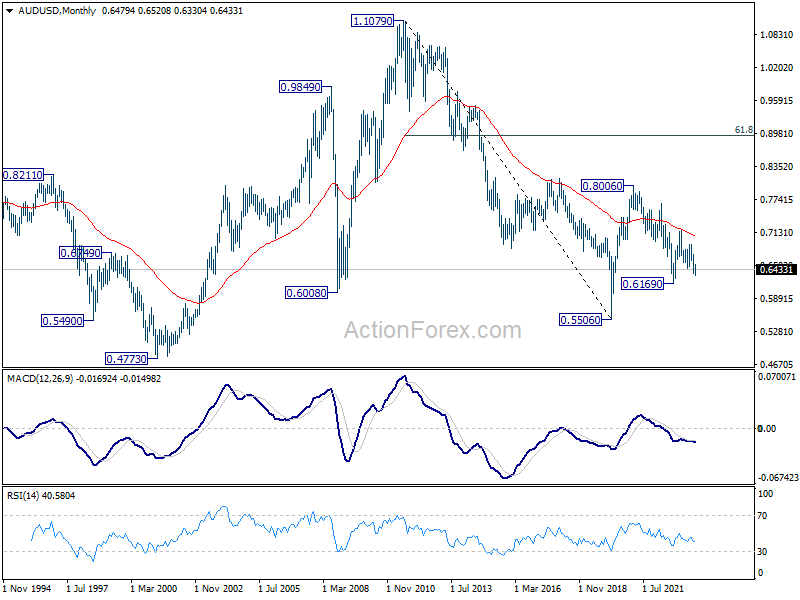
In the long term picture, while fall from 0.8006 might extend lower, the structure argues that it’s merely a correction to rise from 0.5506 (2020 low). In case of downside extension, strong support should emerge above 0.5506 to bring reversal. But still, momentum of the next move will be monitored to adjust the assessment.


