
- The laggards, Dow Jones Industrial Average & Russell 2000 have recorded stellar single-day outperformances on Friday, 2 June against the Nasdaq 100; at least a three-month high.
- Market breadth has improved but fundamental structure remains weak due to stagflation risk.
- Positive FOMO (“fear of missing out”) flows may persist at least in the short to medium term due to relatively low levels of positioning, exposure, and sentiment.
On Friday, 2 June, we witnessed a significant flow of rotation among the benchmark US stock indices ahead of the key 16 June “Triple Witching” US options expiration; prior laggards, the Dow Jones Industrial Average and Russell 2000 have recorded one of the best single day outperformance in at least three months against the leading mega-cap tech & AI concentrated Nasdaq 100.
Dow Jones Industrial Average & Russell 2000 recorded their highest single-day outperformance against Nasdaq 100 since February 2023 & October 2022
The ongoing medium-term uptrend of the Nasdaq 100 started on 13 October 2022, outperforming the Dow Jones Industrial Average and Russell 2000 in the past seven months. Interestingly, the Dow Jones Industrial Average / Nasdaq 1000 ratio recorded its strongest single-day performance on Friday since 3 Feb 2023 (1.38) while the Russell 2000 / Nasdaq 1000 ratio notched its strongest single-day performance since 26 October 2022 (2.81) supported by strong rallies seen in cyclical, industrial and banking stocks such as 3M (+8.7%), Caterpillar (+8.4%) and US regional banks (KRE ETF +6.2%) on Friday.
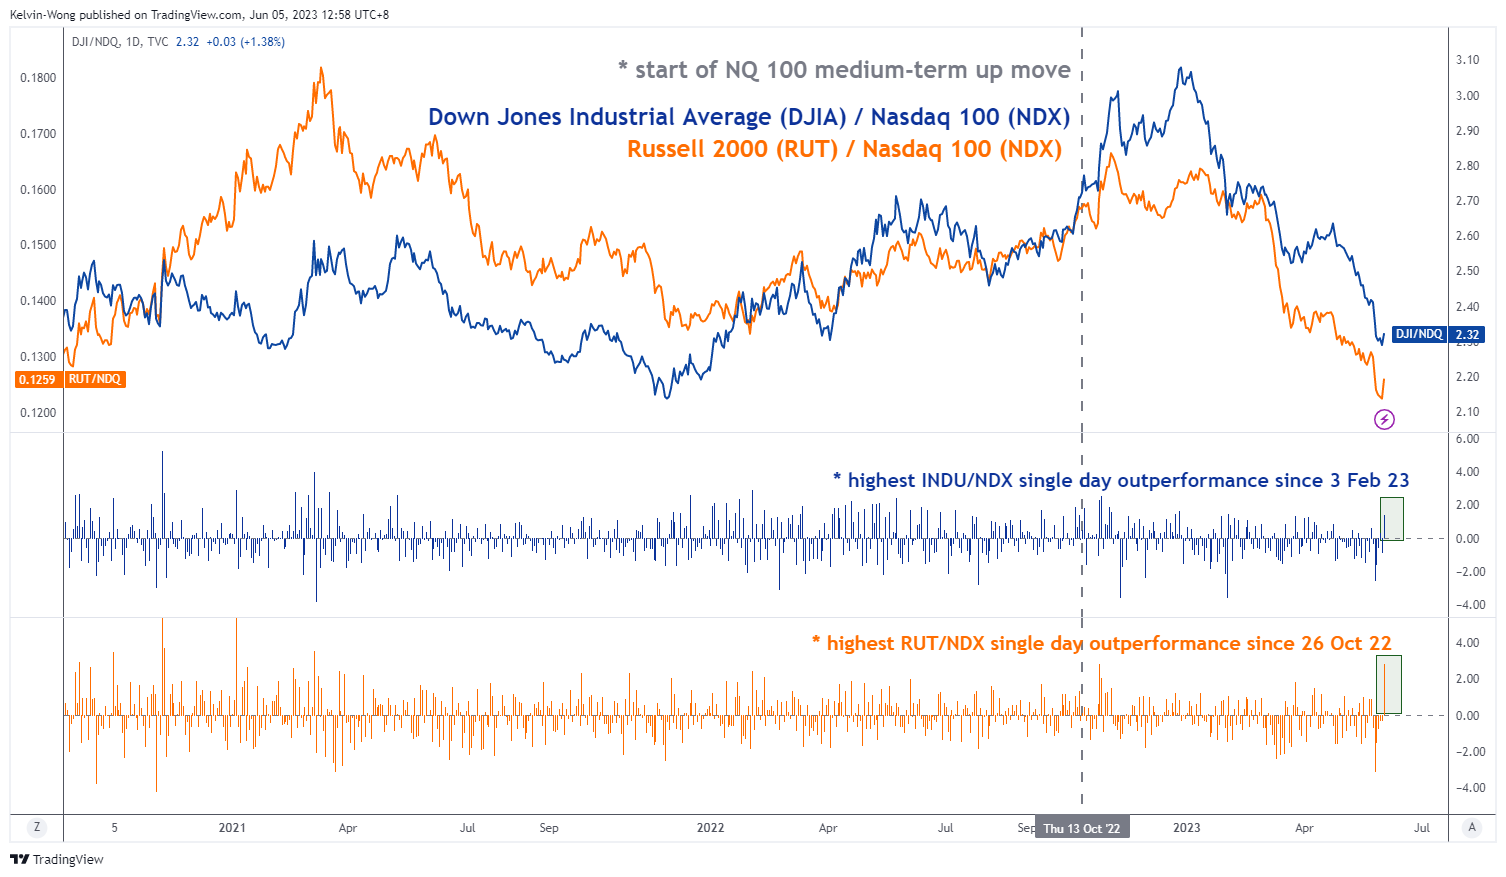
Fig 1: Performances of DJIA & Russell 2000 against Nasdaq 100 measured by their respective ratios as of 2 June 2023
(Source: TradingView, click to enlarge chart)
On the surface, these positive observations can be considered as an improvement in market breadth as rotation is being spread from the high-flying eight mega-cap tech stocks (FAANG plus MNT; Facebook/Meta, Apple, Amazon, Netflix, Google/Alphabet, Microsoft, Nvidia, and Tesla) that are leading the rally since late October 2022 towards the cyclical laggards.
A higher cost of funding environment cannot be ruled out
However, a higher cost of funding environment amid a lingering risk of stagflation may put a damper on earnings growth. The 10-year US Treasury yield has recovered above its 200-day moving ex-post US debt ceiling deal and is looking for a test on a key resistance at 3.90% with positive momentum.
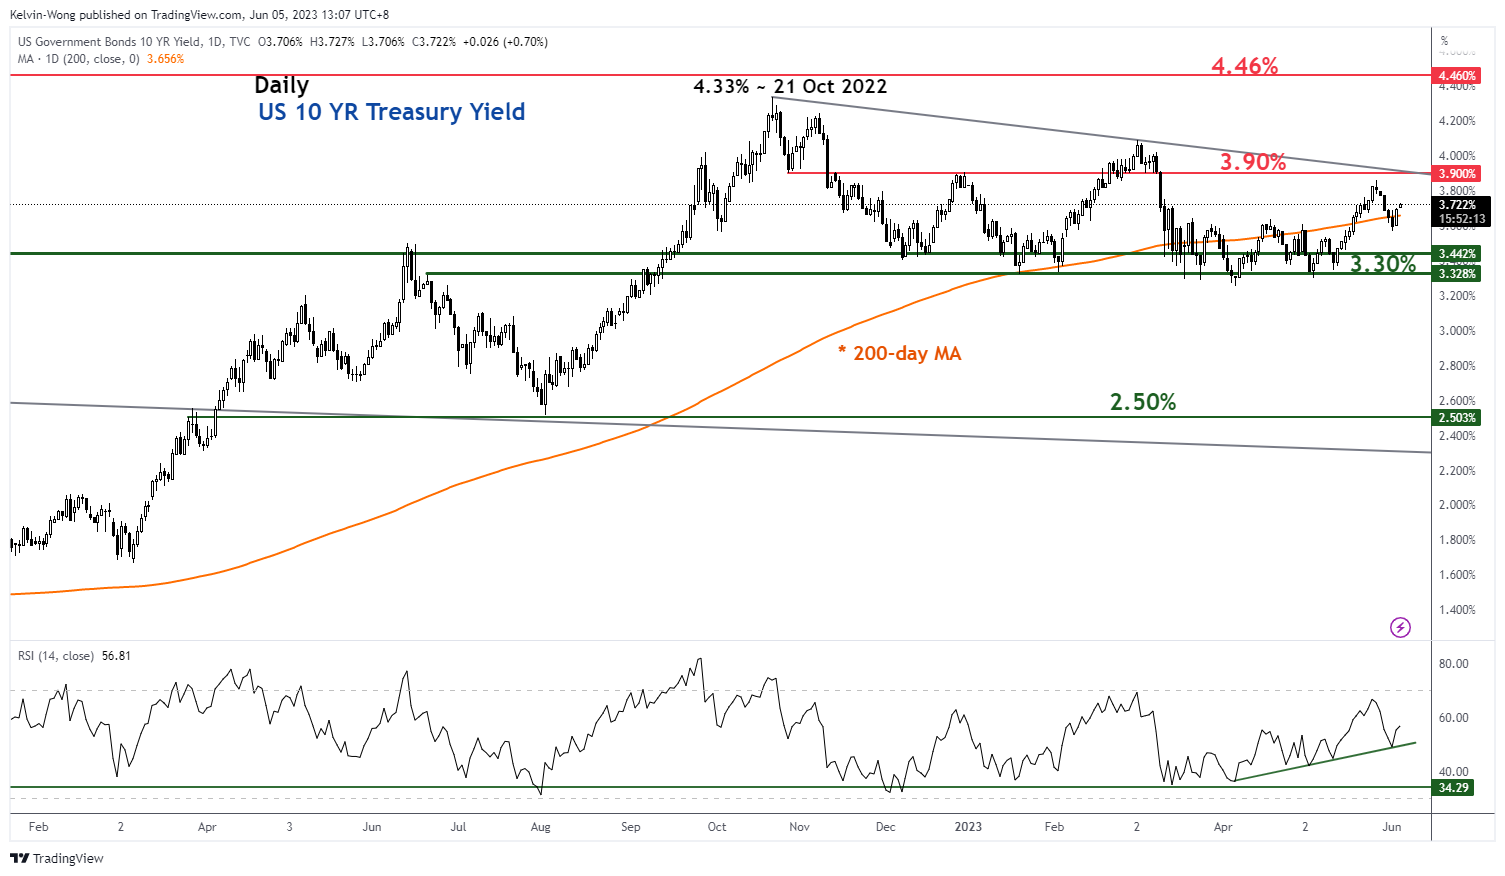
Fig 2: 10-year US Treasury yield trend as of 5 Jun 2023 (Source: TradingView, click to enlarge chart)
The leading inverted US Treasury yield curve is pointing to a potential imminent global recession
In addition, we cannot rule out an impending global recession as the leading US Treasury yield curve, the difference between the 10-year and 2-year is now at -0.81%; it’s the most inverted state in almost 42 years.
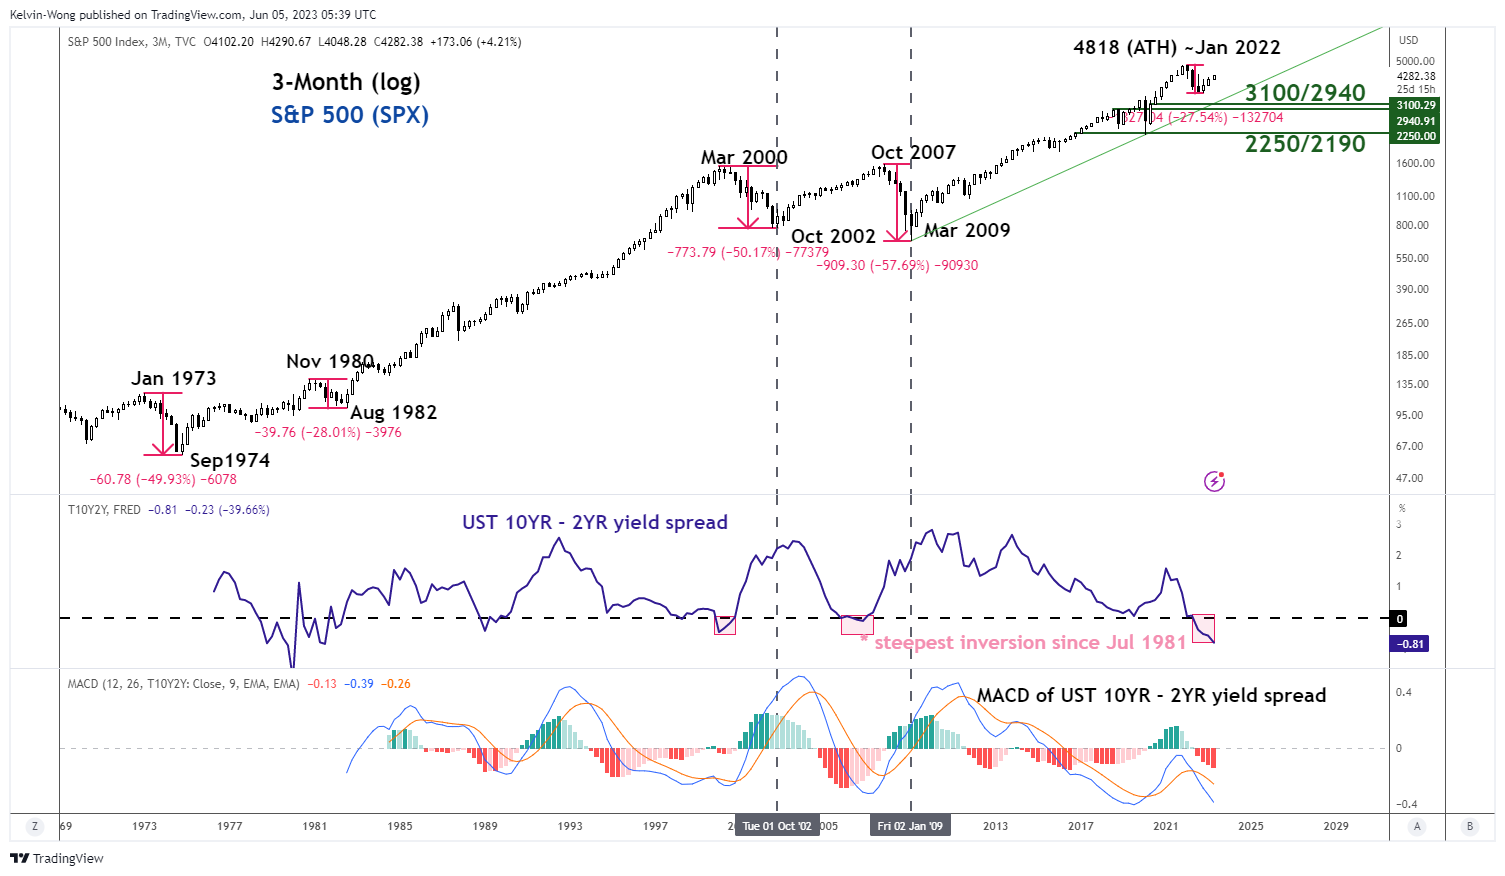
Fig 3: US Treasury yield curve (10-year over 2-year) trend as of 5 June 2023 (Source: TradingView, click to enlarge chart)
However, in a nutshell, the trend is always your friend until its ends so do not be surprised by such positive FOMO irrational behaviour that can persist in the short to medium-term time horizons which in turn may take the US stock market higher due to a relatively low level of positioning, exposure, and sentiment since the start of the year.


