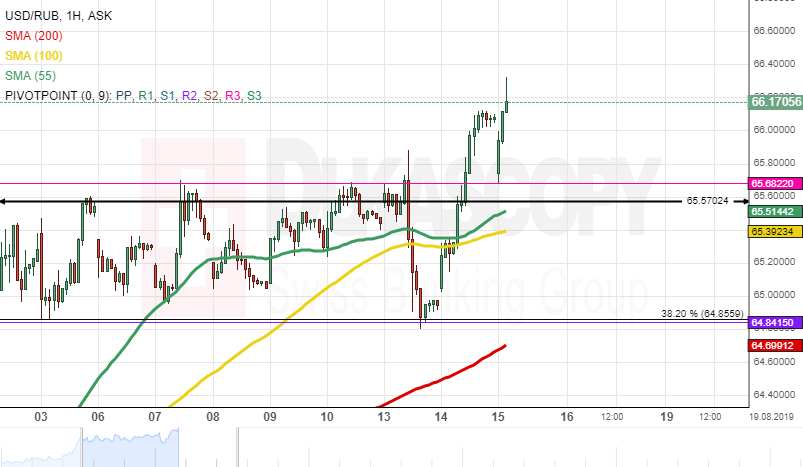
The Russian Ruble has been depreciating against the US Dollar since the middle of July when the USD/RUB currency pair reversed north from the psychological level at 62.50.
As apparent on the chart, the exchange rate has already reached the monthly R3 at the 65.68. Given, that the rate is supported by the 55-, 100– and 200-hour moving averages, currently located in the 64.56/65.38 range, it is likely, that some upside potential could prevail in the market. The pair could reach the Fibonacci 23.00% retracement at 67.14.
It is unlikely, that bears could prevail in the market, and the rate could drop lower than the 63.00 mark due to the support of the Fibonacci 50.00% retracement.