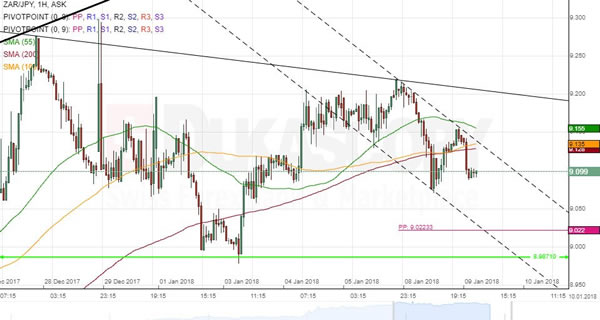
The prevailing pattern that has guided ZAR/JPY for the past two-and-a-half months is a channel up. The latest test of its upper boundary occurred on December 27 when the South African Rand reversed from the 9.27 area. Along the way, a descending triangle was likewise formed with the bottom boundary being the 8.9871 mark and the upper—a declining trend-line. The positioning of both patterns and the strength of the nearest resistance cluster suggest that the pair is likely to decline within this week. The pair should largely respect the triangle until the bottom channel boundary is reached in the 8.95/9.05 territory. Meanwhile, the dashed short-term channel is unlikely to hold for long, as the pair is expected to decline in a flatter manner.