
Sample Category Title
USD/JPY Daily Outlook
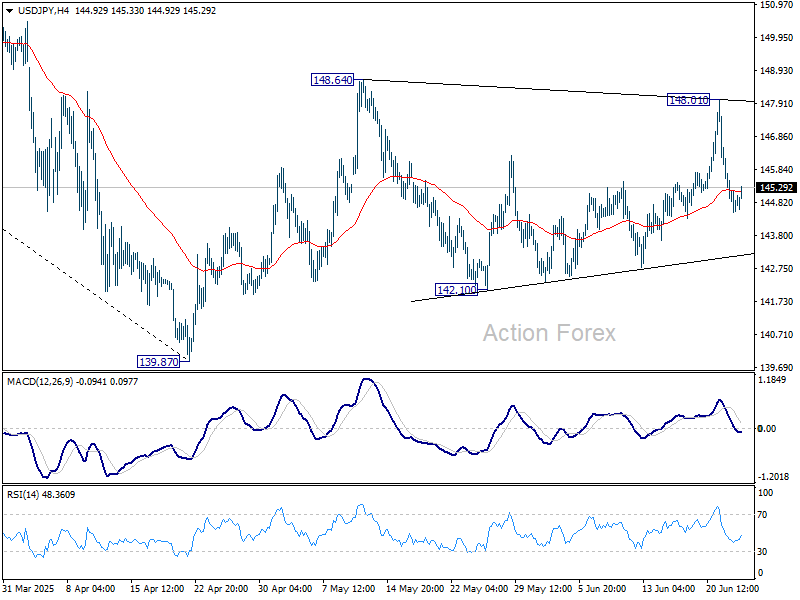
Daily Pivots: (S1) 145.43; (P) 146.72; (R1) 147.44; More...
Intraday bias in USD/JPY stays neutral at this point as sideway pattern from 148.64 is extending. Further rise will remain mildly in favor as long as 142.10 support holds. On the upside. firm break of 148.64 will resume the rise from 139.87 to 61.8% retracement of 158.86 to 139.87 at 151.22.
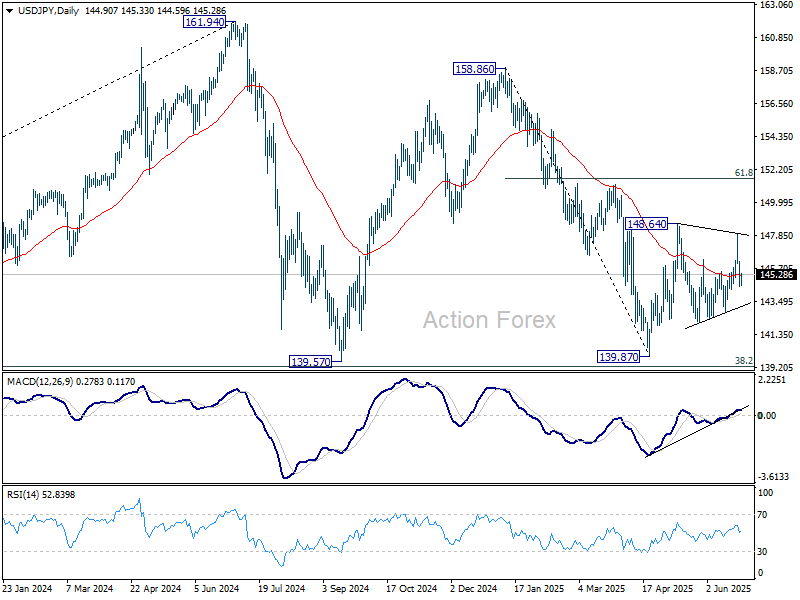
In the bigger picture, price actions from 161.94 are seen as a corrective pattern to rise from 102.58 (2021 low), with fall from 158.86 as the third leg. Strong support should be seen from 38.2% retracement of 102.58 to 161.94 at 139.26 to bring rebound. However, sustained break of 139.26 would open up deeper medium term decline to 61.8% retracement at 125.25.
July Too Early for Fed to Get More Clarity, But Options for September and Beyond Opening Up.
Markets
The ceasefire in the antinuclear attack of Isreal against Iran triggered a standard relief- risk on rebound. Oil supply not being disrupted in the Strait of Hormuz sent Brent crude prices all the way down from $80/b at the start of the week to currently $68/b. US (S&P 500 1.1%) and European equity indices (EuroStoxx +1.44) rebounded, with the former closing less than 1% from the all-time record. Despite this overall sentiment, US and European interest rate markets parted ways. US yields declined up to 5 bps across the curve, with the focus on cyclical weakness and the potential/presumed consequences for Fed policy going forward. A miss in the US Consumer confidence (conference board; headline 93 from 98.4, with both current conditions and expectations materially weaker than expected) triggered a first downleg. The move was almost immediately extended during Fed Powell’s hearing before the House financial committee. The Fed Chair repeated that the US economy and labour market remain in a solid position, allowing the Fed to wait before considering rate moves, especially as tariffs are likely to push inflation up. At the same time, Powell emphasized for the first time that lower inflation and/or a weaking labour market could mean an earlier rate cut. Especially after recent soft comments from the likes of Fed Bowman and Waller, markets read this as raising chances for accelerated Fed easing. The July meeting is too early for the Fed to get more clarity, but options for September and beyond are opening up. Focus in European/German interest markets turned to the supply side as the German government approved the budget framework for 2025-29. It highlighted the need for an additional €500bn(+) of borrowing. The German Finance agency immediately raised its Q3 bond issuance target from €66.5bn to €81.5bn. German yields added between 1.3 bps (2-y) and 6.5 bps (30-y). Lower oil prices, a loss of interest rate support and lingering structural issues pushed the trade-weighted dollar (DXY) close to the 96.7 YTD low (97.85). EUR/USD even touched a minor new YTD top just north of 1.1631. The broader risk-off move also supported a comeback of sterling (EUR/GBP 0.853 from 0.856) even as BoE Bailey in a hearing before Parliament admitted that the UK economy/labour market is heading for some excess capacity, supporting further gradual easing.
Asian markets maintain a modest risk-on bias this morning. US yields ease slightly further. The dollar holds yesterday’s losses. The eco calendar on both sides of the Atlantic is thin. Headlines from the NATO will dominate to newswires. The Czech National Bank is expected to keep its policy rate unchanged at 3.5%. With the dollar near key technical support (DXY and EUR/USD) we look out for further follow-through price action. In case of a sustained break (DXY 98 area, EUR/USD 1.1630/40), the technical picture of the US currency deteriorates further.
News & Views
New EU car registrations rose by 1.6% Y/Y in May. However, YTD they are 0.6% lower compared with the first five months of 2024. Hybrid-electric cars are most popular so far this year, accounting for 35.1% of registrations, followed by petrol cars (28.6%) and battery electric vehicles (15.4%). New battery-electric car sales reached 701,089 units. Three of the four largest markets in the EU, accounting for 62% of all battery-electric car registrations saw gains YTD: Germany (+43.2%), Belgium (+26.7%), and the Netherlands (+6.7%). This contrasted with France, which saw a decline of 7.1%. The combined market share of petrol and diesel cars fell to 38.1%, down from 48.5% over the same period in 2024. In Belgium, petrol cars remain most popular (42.2% share YTD), followed by battery electric vehicle (33.3% YTD) and hybrid electric vehicles (12%).
The Council and the European Parliament reached a provisional deal on the proposal amending the gas storage regulation, which extends by two years member states’ existing obligations to have enough gas in storage before the winter season. The agreement keeps the existing binding target of 90% of gas storage but provides flexibility to reach it anytime between 1 October and 1 December instead of the current 1 November deadline. Intermediary storage targets are indicative, to give predictability of storage levels while leaving sufficient flexibility for market participants to purchase gas throughout the year when it is more convenient.
Fed’s Not There Yet — But Markets Are
Tensions in the Middle East are deescalating after both sides fired missiles at each other—and Trump – not happy - said this:
“We basically have two countries that have been fighting so long and so hard that they don’t know what the fuck they’re doing.”
It was pretty effective—at least from the market’s point of view. Oil prices continued to fall. US crude dropped another 3.5% yesterday and is now down around 15% from Monday’s peak hit at the opening bell. Bears are now testing the critical $65 level, which coincides with the major 38.2% Fibonacci retracement on the year-to-date decline. A break below this level could signal a return to the negative trend that had been building since the start of the year—a trend supported by the quickening restoration of OPEC output and weakening demand prospects due to Trump’s trade war.
Brent is already consolidating below its own major 38.2% retracement and is testing the 50-DMA to the downside, while natural gas has returned to $3.60 per MMBtu after testing the $4.20 level at the height of the latest Middle East tensions.
Easing stress in energy markets is excellent news for everyone who doesn’t want to see higher oil prices translating into accelerating inflation and tighter monetary policy. So the market mood is restored—and the Federal Reserve (Fed) doves are pressing the lemon particularly hard these days.
Fed Chair Jerome Powell said on the first day of testimony before Congress that they don’t need to rush into rate cuts. But when asked specifically about July, he didn’t say, “No, we won’t cut.” That alone was enough to get the doves dancing in the streets. The US 2-year yield dropped below 4.80% this morning as the probability of a July rate cut jumped from zero to 20%.
The combination of Middle East de-escalation and rising dovish Fed expectations sent the S&P 500 more than 1% higher—almost near a record high—while the Nasdaq printed a fresh closing high. The US dollar fell.
Now, all this raises a few questions. First, Powell—who said just a week ago that ‘everyone he knows thinks that inflation will rise significantly due to tariffs —has been squeezed like a lemon for just a few drops of dovishness. And those few drops were interpreted as a potential green light for a July cut.
But the thing is, cutting rates in July would, in reality, be rushing—because the trade uncertainties won’t be resolved by then. In the best-case scenario, the US will go ahead and impose tariffs on trading partners without further negotiations. The tariffs that become effective in July—or August—won’t be reflected in consumer prices until the fall at the earliest. In the worst-case scenario, the tariff deadline will be pushed down the road—under the excuse that geopolitical tensions delayed negotiations—and the uncertainties, along with the inflation risks, will be postponed as well.
So even if the Fed is seen cutting rates twice before year-end, it would be more reasonable to wait until at least September—or even October—to proceed. The US economy is showing some signs of stress. House prices are falling, and consumer reports are volatile—strong one day, weak the next—which is ultimately hurting confidence. But company earnings remain strong, stock prices are near all-time highs, valuations are inflating, and the jobs market remains resilient. The Fed should keep some room to act if things truly worsen—it can’t just cut now and risk overheating the economy.
As such, it feels like the dovish Fed expectations are being pushed to the extreme. Long S&P500 positions are overly crowded among retail traders, while CFTC data suggests no strong interest from big players near record highs. So I think this latest rally is a time bomb. A correction is probably needed, and several factors could justify it: overdone Fed optimism, unresolved trade uncertainty, and the exploding US debt. Every additional point on the S&P 500 just increases the size of a potential drawdown.
In Europe, the convergence trade isn’t holding up well against the backdrop of rising dovish Fed expectations and the possibility of a pause from the European Central Bank (ECB).
The Stoxx 600 rebounded more than 1% yesterday after a 4% correction since mid-June. But the S&P 500 is clearly back in favour. European defense stocks, which carried the indices higher in H1, have probably already priced in most of the benefits from increased government spending. There could be another leg up—if the US doesn’t confirm it would protect a NATO member in case of attack—that’s a major current concern.
But beyond defense, the rest of Europe’s equities are facing tariff uncertainty. My concern is that the last bricks being added are making the tower too tall to stand on its own—and we could see a sizeable correction on both sides of the Atlantic sometime this summer. At least, that would justify the rising dovish Fed expectations.
Riksbank Minutes in the Limelight
In focus today
Today is a relatively quiet day in terms of macroeconomic data.
In Sweden, today is all about the Riksbank. First off, the minutes from last week's meeting will be published at 09.30 CET. As always, we are excited to dissect the separate viewpoints of the board members, especially in terms of the balance of risks with regards to the inflation and growth outlooks. Throughout the day three board members will be speaking; Governor Thedéen and Bunge at separate events (Bunge x2) at the Swedish political summit "Almedalen week", whereas vice Governor Anna Breman will participate at a conference arranged by the Bank of England, on the topic of "The Riksbank's monetary policy communication".
In the US, Fed Chair Powell returns to Capitol Hill for a testimony before the Senate Banking Committee, following his appearance yesterday before the House Financial Services Committee. Fed's Goolsbee will also be on the wire.
As the NATO summit in the Hague enters its second day, attention remains on discussions around the proposed increase in defence spending to 5% of GDP.
Economic and market news
What happened overnight
In Japan, the BoJ's June policy meeting summary highlighted a division among policymakers, with board member Tamura advocating for decisive interest rate hikes to address rising inflation risks, contrasting with Governor Ueda's call for a pause due to ongoing US trade uncertainties. While the BoJ kept rates steady at 0.5% on June 16-17, Tamura's hawkish stance underscores the board's split between managing inflationary pressures and assessing the economic impact of US tariffs.
What happened yesterday
In the Middle East conflict, a fragile US-brokered ceasefire began between Israel and Iran, with early accusations of violations from both sides. Despite tensions, the ceasefire appears to be holding for now, as Israel lifted emergency measures and Iran's president declared an end to the 12-day war. Israeli PM Netanyahu claimed Israel had disabled Iran's nuclear project, but a preliminary classified US report stated the strikes only delayed Iran's program by months. Netanyahu warned of full force action if Iran tries to rebuild. Stocks rallied and oil prices dropped further amid prospects of de-escalation.
In the US, the June Consumer Confidence Index came in weak at 93.0 (cons: 100). The 'Jobs Plentiful' index hit its lowest since 2021, reflecting concerns about employment. However, more people planning overseas vacations and lower inflation expectations offer some optimism amid economic uncertainty.
Speaking in Congress, Fed Chair Powell indicated resistance to immediate rate reductions, citing a robust economy and uncertain trade policy impacts. Despite calls for rate reductions by two board members, Powell remains cautious about inflation risks, with the benchmark target range remaining in restrictive territory at 4.25% to 4.5%.
In Germany, the Ifo index rose in June broadly as expected. The current assessment remained stable at 86.2 (cons: 86.5, prior: 86.1) while the expectations compensated for this by rising more than expected to 90.7 (cons: 89.9, prior: 89.0). The current assessment is slightly weaker than the signals we got from the PMI survey, which rose more than expected to 50.4. A weak Ifo current situation and PMIs close to 50 supports our outlook for near-term stagnation with improvements expected next year. We forecast 2025 growth at 0.3% y/y and growth to rise by the end of 2025, driven by monetary easing passthrough and higher real incomes. The fiscal package is expected to boost GDP growth to 1.1% y/y in 2026 and 1.5% y/y in 2027.
In Hungary, the central bank left its base rate steady at 6.50%, as widely expected.
Equities: Equities staged a powerful risk-on rally yesterday, with broad-based gains across countries, regions, sectors, and industries. S&P 500 and Nasdaq are now within roughly 1% of their previous highs from February and December, respectively.
What's worth highlighting is that the moves yesterday were yet again not macro-driven but rather driven by the geopolitics. This was also very visible through a cross-asset perspective, oil prices were lower together with yields as a sign of stabilisation in the Iran-Israel conflict - potentially even a sustainable ceasefire. Hence, we did not see the typical rotation risk-on move into cyclicals. Instead, the rally was balanced between defensives and cyclicals. In the US yesterday, Dow +1.2%, S&P 500 +1.1%, Nasdaq +1.4% and Russell 2000 +1.3%. Asian equities followed through with gains this morning, while European futures are pointing higher. US futures are more mixed.
FI and FX: Energy prices dropped sharply yesterday amid signs of de-escalation of the conflict between Israel and Iran, which led to easing fear of the risk that Iran would try to close the Strait of Hormuz and disrupt global oil and gas flows. The improved risk sentiment provided support for equities and cyclically sensitive currencies such as GBP and SEK during yesterday's session. The USD on the other hand continues to struggle to find firm footing with EUR/USD remaining above the 1.16 mark. There was a solid decline in the US Treasury yields yesterday on the back of comments from Federal Reserve Chairman Powell on monetary policy. He stated that if inflation was contained, they were prepared to cut policy rates sooner rather than later.
USD/CHF Daily Outlook
Daily Pivots: (S1) 0.8013; (P) 0.8074; (R1) 0.8114; More….
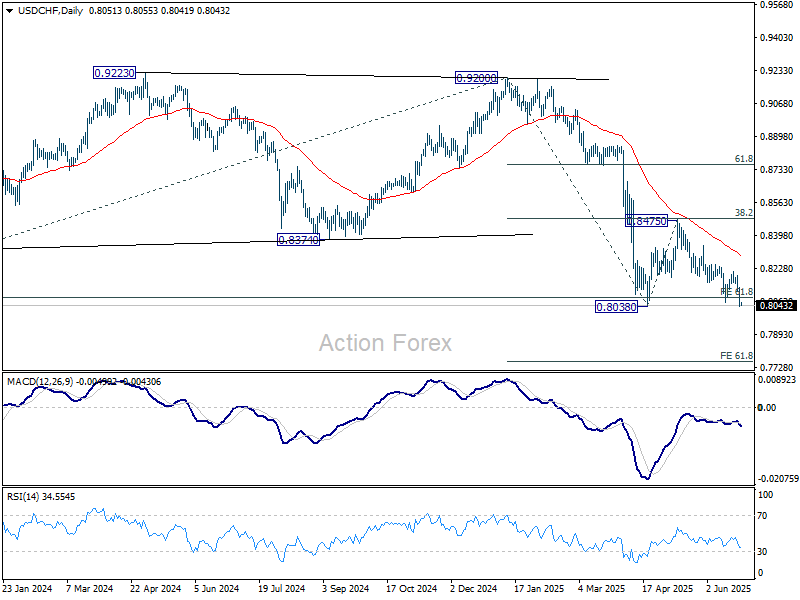
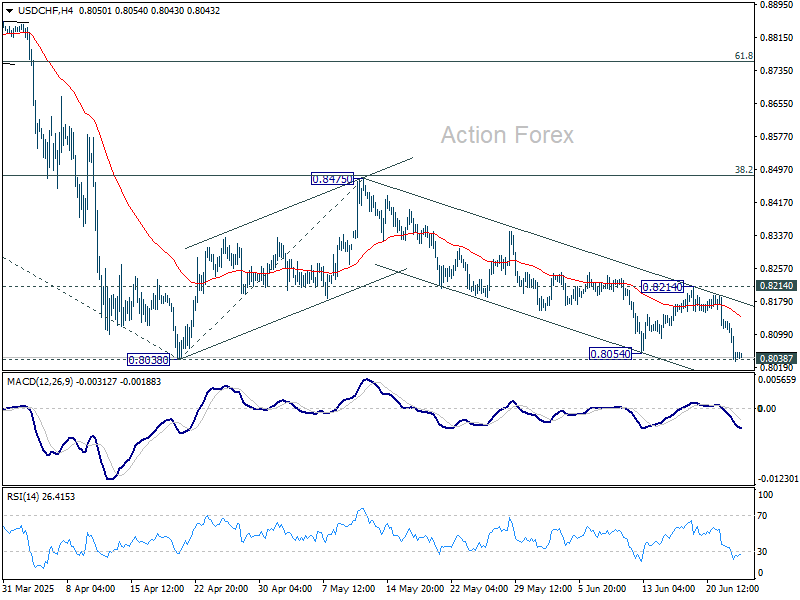
Immediate focus is now on 0.8038 low as fall from 0.8475 extends. Firm break there will confirm larger down trend resumption. Next target is 61.8% projection of 0.9200 to 0.8038 from 0.8475 at 0.7757. For now, risk will stay on the downside as long as 0.8214 resistance holds, in case of recovery.

In the bigger picture, long term down trend from 1.0342 (2017 high) is still in progress and met 61.8% projection of 1.0146 (2022 high) to 0.8332 from 0.9200 at 0.8079 already. In any case, outlook will stay bearish as long as 55 W EMA (now at 0.8640) holds. Sustained break of 0.8079 will target 100% projection at 0.7382.
Fed Officials Push Back on July Cut, But Dollar Remains Under Pressure
Dollar remains under broad pressure midweek and is currently the weakest performer among major currencies. While dovish signals from Fed Vice Chair Michelle Bowman and Governor Christopher Waller cracked open the door for a July rate cut, that narrative has cooled. Several other Fed officials have voiced caution, pushing back on the idea of imminent easing, and markets have since trimmed the probability of a July move to below 20%.
Nonetheless, expectations for a September rate cut continue to gain momentum, with market pricing now showing an 85% chance, compared to around 65% a week ago. The key source of uncertainty remains the expiration of the 90-day reciprocal tariff truce with the US, set to end in early July. Without a breakthrough or de-escalation in trade talks, it’s hard to see the Fed moving as soon as July. September offers a more plausible window, and offers the Fed more flexibility to assess incoming data and policy developments.
EU–US trade tensions remain unresolved. European Commission Executive Vice-President Stephane Sejourne warned that Europe would need to "retaliate and rebalance" if the US insists on an asymmetrical deal similar to its pact with the UK. Though talks have reportedly accelerated, time is tight, and the risk of escalation still looms large over markets.
In currency markets, Swiss Franc leads as the strongest currency so far this week, followed by Sterling and Kiwi. Dollar remains at the bottom, trailed by the Loonie and Aussie. Yen and Euro are holding in the middle. There is a lack of unifying theme for now, except Dollar weakness.
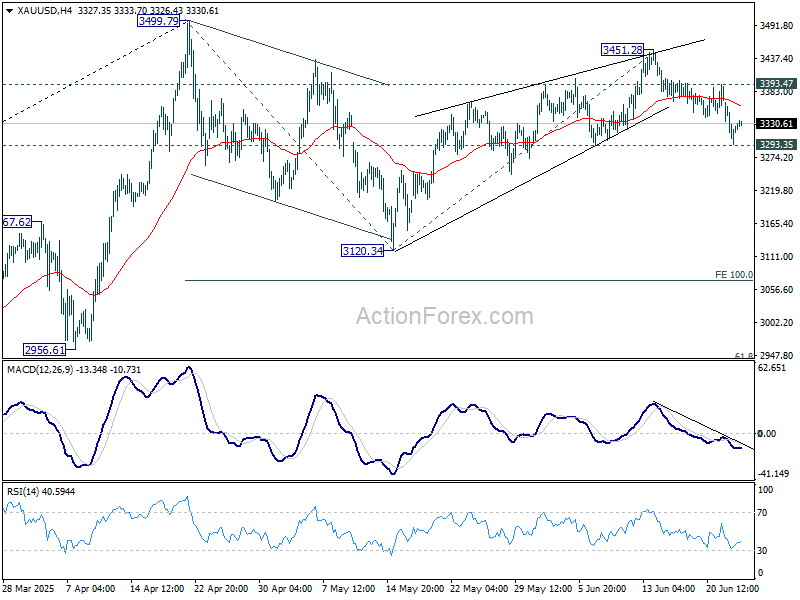
Technically, Gold recovered mildly after drawing support from 3293.35, but overall outlook is unchanged. Fall from 3451.28 is seen as the third leg of the corrective pattern from 3499.79 high. Firm break of 3293.35 support will solidify this case, and target 3120.34 support and possibly below.
In Asia, at the time of writing, Nikkei is up 0.31%. Hong Kong HSI is up 0.85%. China Shanghai SSE is up 0.45%. Singapore Strait Times is up 0.46%. Japan 10-year JGB yield is down -0.018 at 1.401. Overnight, DOW rose 1.19%. S&P 500 rose 1.11%. NASDAQ rose 1.43%. 10-year yield fell -0.027 to 4.293.
BoJ: Split emerges over of tariffs impact and rising domestic prices
BoJ's Summary of Opinions from its June 16–17 meeting highlighted a growing divide among policymakers over the risks posed by US tariffs. While recent hard data for April and May "relatively solid", several officials warned that the real effects of the tariffs have "yet to materialize". One member emphasized the need to assess the impact carefully, as it would "certainly" weigh on bsusiness sentiment, while another described the economy as “somewhat stagnant.”
Still, the board was not unanimous in its pessimism. Some members maintained that the damage from tariffs would be limited, pointing to robust wage growth and stable consumer inflation. One member even highlighted the influence of rice prices on "perceived inflation and inflation expectations", urging close monitoring. Others noted that the domestic backdrop remains relatively firm, with wages rising and inflation slightly exceeding forecasts.
BoJ left its policy rate unchanged at 0.5% and decided to taper the pace of its bond holdings reduction more gradually starting next year.
BoJ’s Tamura: Will raise rates "without haste or delay" if outlook justifies It
BOJ board member Naoki Tamura said today that the central bank must remain prepared to adjust its policy rate “in a timely and appropriate manner” based on evolving data, even in the face of ongoing uncertainties. While real interest rates remain low, Tamura emphasized that rate hikes would be guided by evidence of sustained improvements in activity and inflation, stressing the need for being "without haste or delay".
Tamura added that uncertainty is a constant in policy-making, but that should not paralyze decision-making. If the risks to inflation shift meaningfully to the upside or the likelihood of hitting the 2% target increases, the BoJ should be ready to “act decisively.”
Australia CPI slows to 2.1% yoy in May, weakest since October 2024
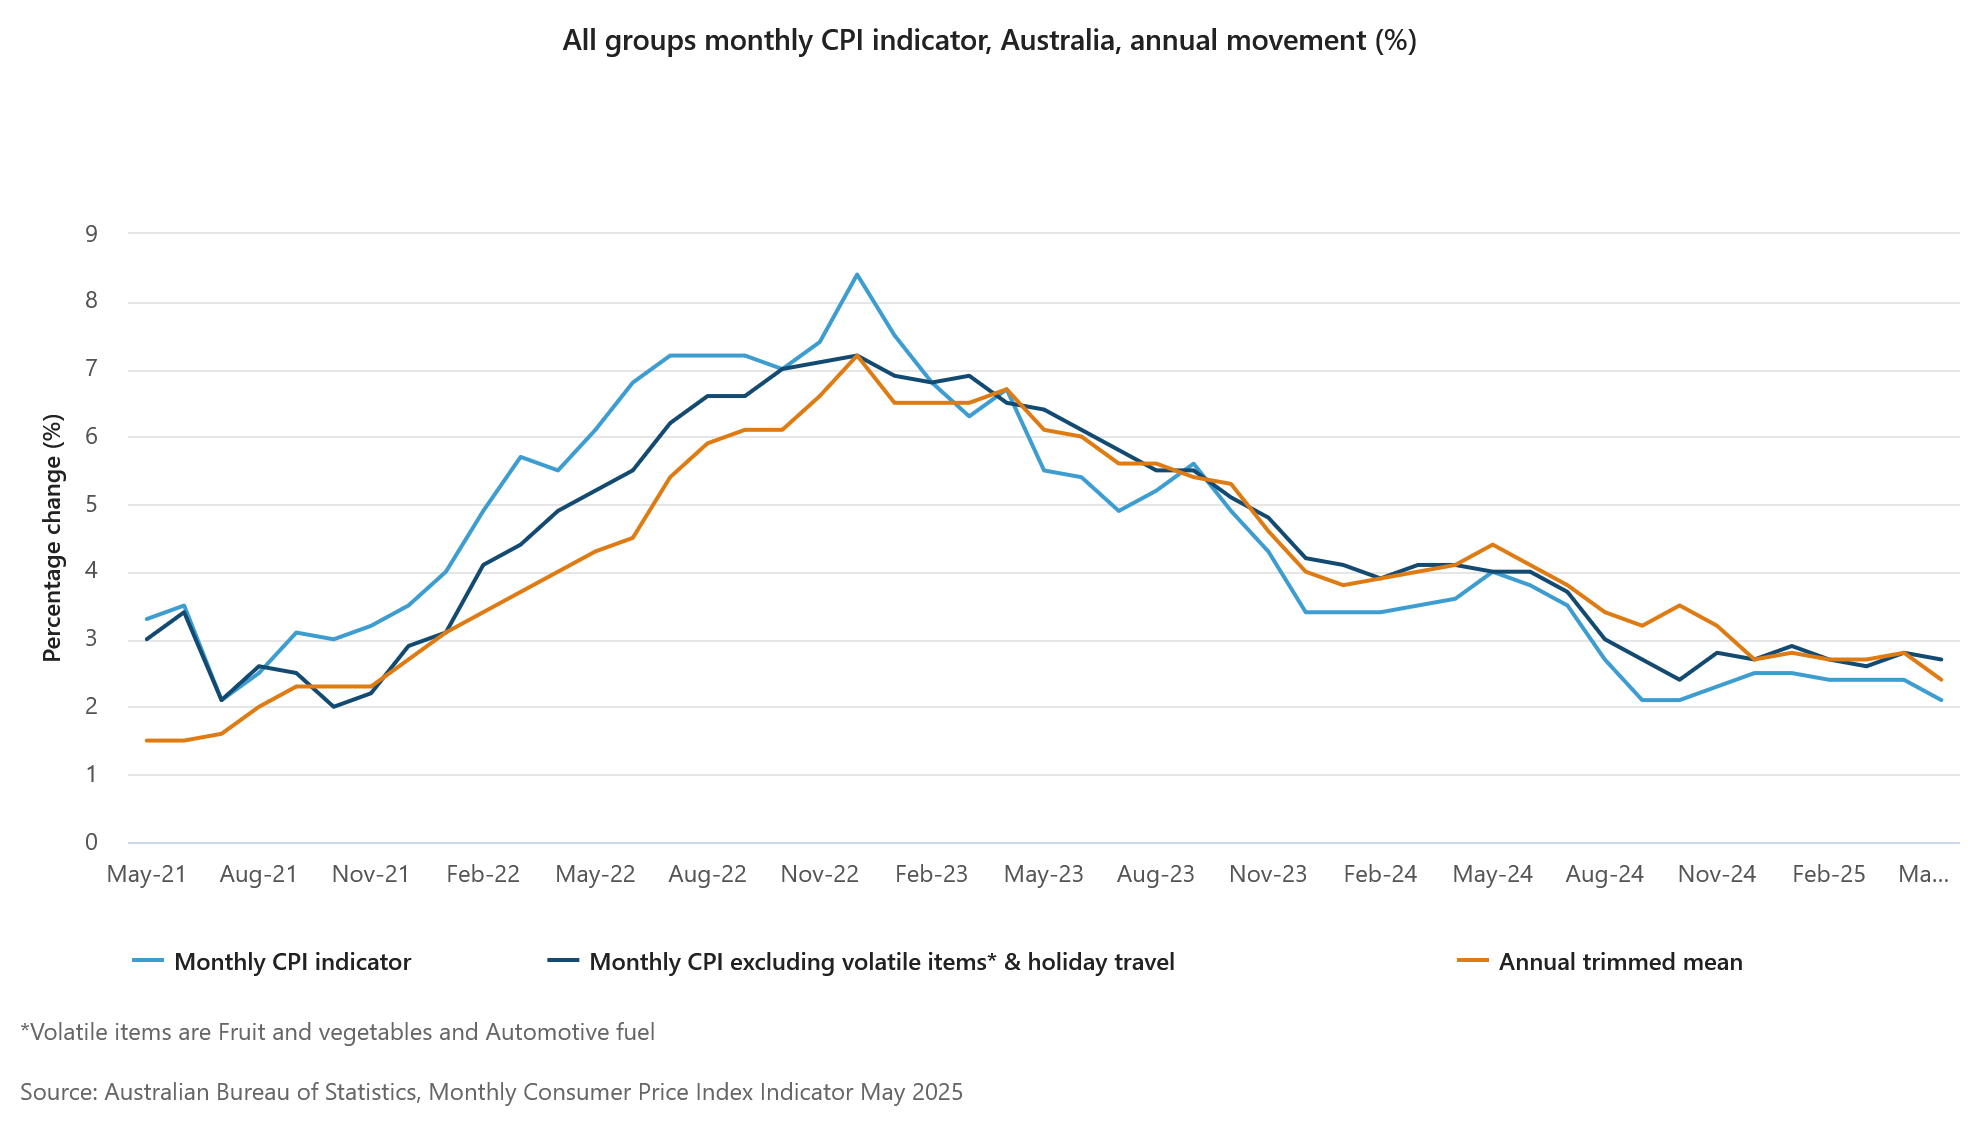
Australia’s monthly CPI eased more than expected in May, dropping from 2.4% yoy to 2.1% yoy, the lowest level since October 2024 and below forecasts of 2.4% yoy.
Underlying inflation also softened, with trimmed mean CPI falling from 2.8% yoy to 2.4% yoy, reinforcing signs that underlying price pressures are easing across the economy. Excluding volatile items and holiday travel, inflation ticked down slightly to 2.7% yoy from 2.8% yoy.
The largest annual price increases came from food and non-alcoholic beverages (+2.9%), housing (+2.0%), and alcohol and tobacco (+5.9%).
The overall print strengthens the case for additional RBA rate cuts in the second half of the year, particularly as disinflation broadens.
Fed’s Barr: Tariffs to push inflation higher, but policy can wait
Fed Governor Michael Barr warned that the recent wave of tariffs is likely to drive inflation higher, citing the potential "Higher short-term inflation expectations, supply chain adjustments, and second-round effects". Speaking overnight, Barr acknowledged that this could add to inflation persistence even as the broader economy slows and unemployment, currently at 4.2%, edges higher.
Despite these headwinds, Barr said the Fed is in a good position to “wait and see” how economic conditions evolve before adjusting policy. He noted the "considerable uncertainty about tariff policies and their effects," stressing that monetary policy requires balancing "tradeoffs" between supporting growth and containing inflation.
Fed’s Williams sees growth slowing to 1%, tariffs to push inflation to 3%
New York Fed President John Williams warned overnight that the combination of policy uncertainty, restrictive trade measures, and declining immigration will drag significantly on the US economy this year. He projects growth will decelerate to just 1%, with unemployment rising to 4.5% by the end of 2025. Williams also anticipates a near-term spike in inflation to 3%, driven by tariffs, though he expects that to slowly subside back toward 2% over the next two years.
While Williams described the hard economic data as still solid, he acknowledged a growing disconnect with softer indicators that point to rising concerns among consumers and businesses. Nonetheless, he welcomed signs that inflation expectations remain anchored despite recent price shocks.
Looking ahead, Williams emphasized that monetary policy will be guided by data due “over the next few months,” which will inform whether and when Fed should adjust interest rates. Though he reiterated that “interest rates eventually need to get back to more normal levels”, his comments suggest a wait-and-see approach remains the most likely course for now.
Fed's Kashkari: Staying patient amid tariff uncertainty, sees strong economy
Minneapolis Fed President Neel Kashkari reiterated Fed's cautious stance overnight, emphasizing that policymakers remain in “wait and see mode” as they monitor the economic fallout from tariff policy. He noted that while officials are hesitant to make any "dramatic changes" to the policy outlook just yet, their priority is to gain clarity on how tariffs will impact inflation and broader growth dynamics.
Kashkari struck a generally optimistic tone on the domestic economy, saying the fundamentals remain “quite strong” and that inflation appears to be trending back toward the 2% target. He pointed to recent data suggesting underlying inflation is running near 2.5%, which—while still above target—is showing a welcome moderation.
However, the lingering uncertainty around tariffs continues to cloud the outlook. Kashkari warned that "nervousness" around trade is leading some firms to pause investment and may amplify inflation risks. While ongoing negotiations offer a path forward, he made clear that "ultimately we need to see what actually happens and then adjust our analysis of the economy."
Fed’s Schmid backs wait-and-see stance amid uncertainty
Speaking overnight, Kansas City Fed President Jeff Schmid called Fed’s “wait-and-see” stance appropriate, especially given that inflation remains above target and the effects of rising tariffs are still filtering through the economy. "The resilience of the economy gives us the time to observe how prices and the economy develop," he added
Schmid noted that business contacts “almost uniformly” expect tariffs to drive prices higher and weigh on activity, putting Fed’s inflation and employment mandates at odds. But "there is far less clarity on when and by how much," said Schmid, who argued there’s little justification for near-term rate adjustments until the economic picture becomes clearer.
USD/CHF Daily Outlook
Daily Pivots: (S1) 0.8013; (P) 0.8074; (R1) 0.8114; More….
Immediate focus is now on 0.8038 low as fall from 0.8475 extends. Firm break there will confirm larger down trend resumption. Next target is 61.8% projection of 0.9200 to 0.8038 from 0.8475 at 0.7757. For now, risk will stay on the downside as long as 0.8214 resistance holds, in case of recovery.
In the bigger picture, long term down trend from 1.0342 (2017 high) is still in progress and met 61.8% projection of 1.0146 (2022 high) to 0.8332 from 0.9200 at 0.8079 already. In any case, outlook will stay bearish as long as 55 W EMA (now at 0.8640) holds. Sustained break of 0.8079 will target 100% projection at 0.7382.

Bitcoin Momentum Returns — Will Bulls Maintain It Above Resistance?
Key Highlights
- Bitcoin started a fresh increase above the $103,000 resistance.
- BTC/USD is approaching a major bearish trend line with resistance at $107,000 on the 4-hour chart.
- Ethereum recovered losses and climbed above the $2,300 resistance.
- XRP price is consolidating and facing hurdles near $2.250.
Bitcoin Price Technical Analysis
Bitcoin price started a fresh increase above the $102,500 zone against the US Dollar. BTC was able to surpass the $103,000 and $103,500 resistance levels.
Looking at the 4-hour chart, the price settled above the $104,000 level and tested the 100 simple moving average (red, 4-hour). The price surpassed the 61.8% Fib retracement level of the downward move from the $108,978 swing high to the $98,169 low.
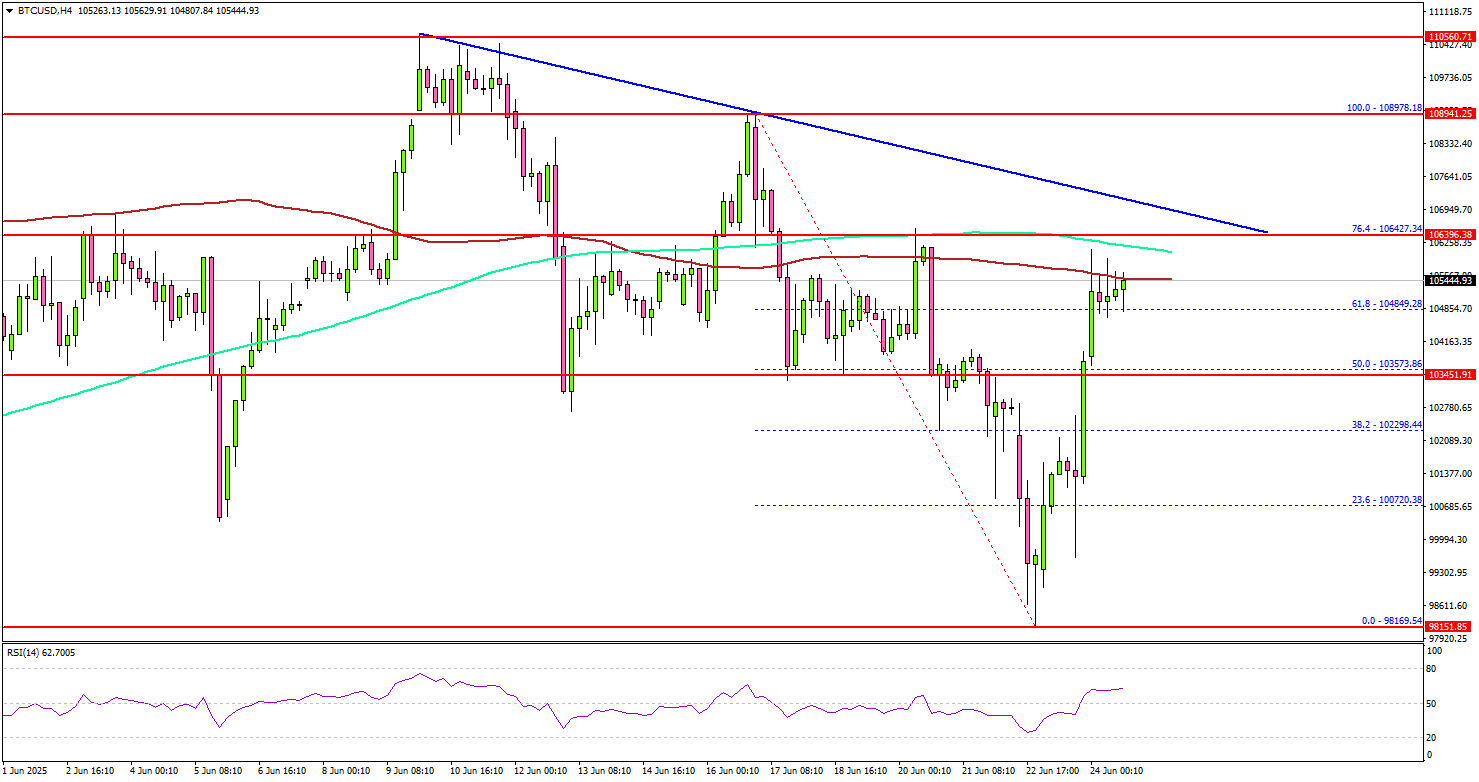
On the upside, the price could face resistance near the $106,500 level or the 76.4% Fib retracement level of the downward move from the $108,978 swing high to the $98,169 low.
The next key resistance is $107,000. There is also a major bearish trend line forming with resistance at $107,000 on the same chart. A successful close above $107,000 might start another steady increase.
In the stated case, the price may perhaps rise toward the $110,000 level. Any more gains might call for a test of $112,000. If there is a pullback, Bitcoin might find support near the $103,500 level.
A downside break below $103,000 might send BTC toward the $101,500 support. Any more losses might send the price toward the $100,000 support zone.
Looking at Ethereum, the bulls seem to be in control, and they were able to push the price above the $2,300 resistance zone.
Today’s Economic Releases
- Fed's Chair Powell testifies.
- US New Home Sales for May 2025 (MoM) – Forecast 1.5% versus 10.9% previous.
Australia CPI slows to 2.1% yoy in May, weakest since October 2024
Australia’s monthly CPI eased more than expected in May, dropping from 2.4% yoy to 2.1% yoy, the lowest level since October 2024 and below forecasts of 2.4% yoy.
Underlying inflation also softened, with trimmed mean CPI falling from 2.8% yoy to 2.4% yoy, reinforcing signs that underlying price pressures are easing across the economy. Excluding volatile items and holiday travel, inflation ticked down slightly to 2.7% yoy from 2.8% yoy.
The largest annual price increases came from food and non-alcoholic beverages (+2.9%), housing (+2.0%), and alcohol and tobacco (+5.9%).
The overall print strengthens the case for additional RBA rate cuts in the second half of the year, particularly as disinflation broadens.
BoJ’s Tamura: Will raise rates “without haste or delay” if outlook justifies It
BoJ board member Naoki Tamura said today that the central bank must remain prepared to adjust its policy rate “in a timely and appropriate manner” based on evolving data, even in the face of ongoing uncertainties. While real interest rates remain low, Tamura emphasized that rate hikes would be guided by evidence of sustained improvements in activity and inflation, stressing the need for being "without haste or delay".
Tamura added that uncertainty is a constant in policy-making, but that should not paralyze decision-making. If the risks to inflation shift meaningfully to the upside or the likelihood of hitting the 2% target increases, the BoJ should be ready to “act decisively.”
BoJ: Split emerges over of tariffs impact and rising domestic prices
BoJ's Summary of Opinions from its June 16–17 meeting highlighted a growing divide among policymakers over the risks posed by US tariffs. While recent hard data for April and May "relatively solid", several officials warned that the real effects of the tariffs have "yet to materialize". One member emphasized the need to assess the impact carefully, as it would "certainly" weigh on business sentiment, while another described the economy as “somewhat stagnant.”
Still, the board was not unanimous in its pessimism. Some members maintained that the damage from tariffs would be limited, pointing to robust wage growth and stable consumer inflation. One member even highlighted the influence of rice prices on "perceived inflation and inflation expectations", urging close monitoring. Others noted that the domestic backdrop remains relatively firm, with wages rising and inflation slightly exceeding forecasts.
BoJ left its policy rate unchanged at 0.5% and decided to taper the pace of its bond holdings reduction more gradually starting next year.