Sample Category Title
EUR/GBP Daily Outlook
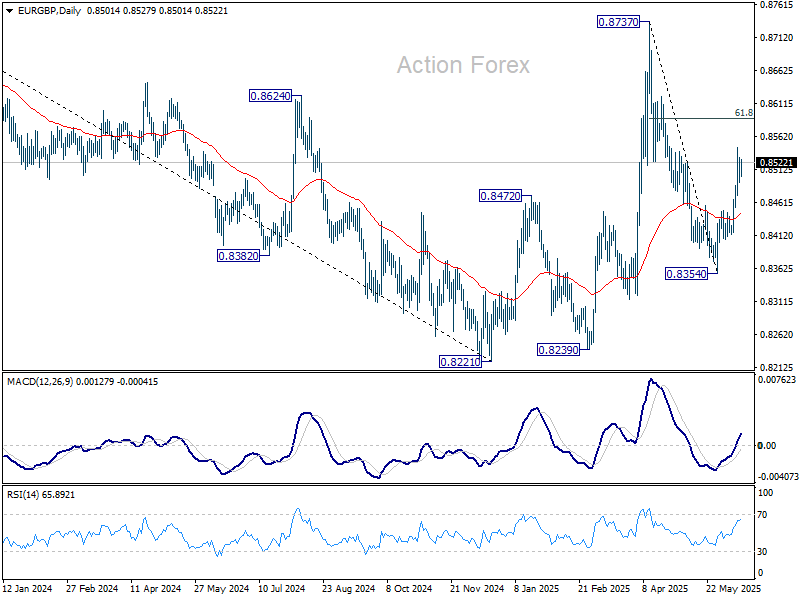
Daily Pivots: (S1) 0.8491; (P) 0.8512; (R1) 0.8530; More...
Intraday bias in EUR/GBP remains neutral for consolidations below 0.6545 temporary top. Further rally is expected as long as 0.8416 support holds. Above 0.8545 will target for 61.8% retracement of 0.8737 to 0.8354 at 0.8591. Firm break there will pave the way to 0.8373 resistance.
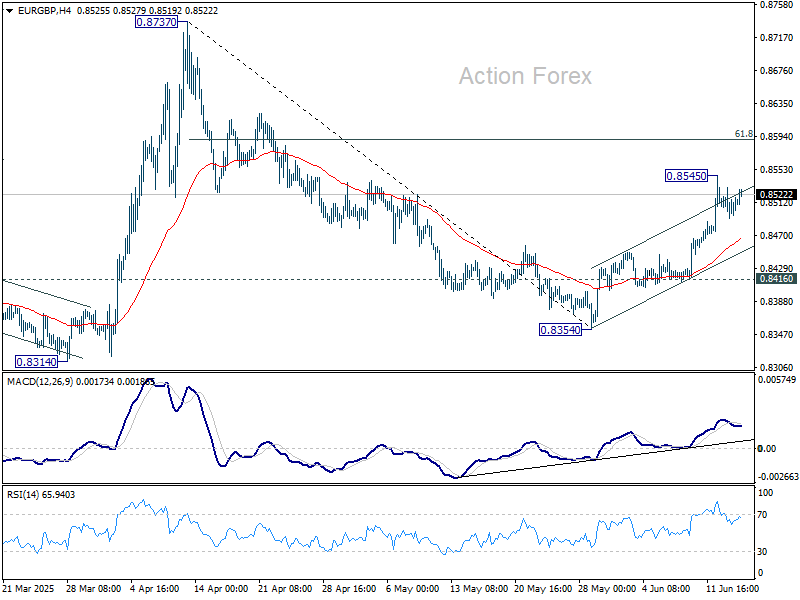
In the bigger picture, price actions from 0.8221 medium term bottom are merely forming a corrective pattern to the down trend from 0.9267 (2022 high). Nevertheless, there is no clear momentum to break through 0.8201 key support (2022 low) yet. Hence, range trading is expected between 0.8221/8737 for now.
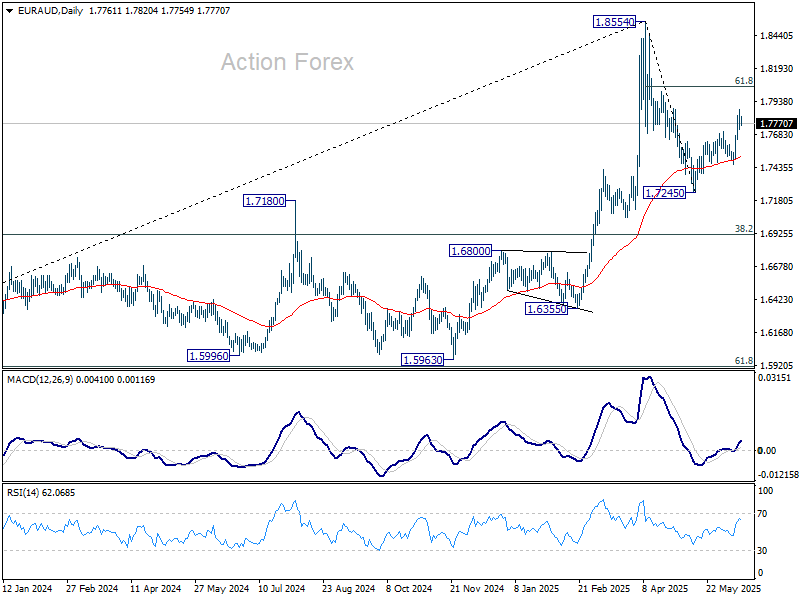
EUR/AUD Daily Outlook
Daily Pivots: (S1) 1.7731; (P) 1.7807; (R1) 1.7885; More...
Intraday bias in EUR/AUD remains neutral for the moment, and more consolidations could be seen below 1.7880 temporary top. Overall development suggests that fall from 1.8554 has completed as a corrective move. Further rise is expected as long as 1.7459 support holds. Above 1.7880 will target 61.8% retracement of 1.8554 to 1.7245 at 1.8054. Firm break there will pave the way to 1.8554.
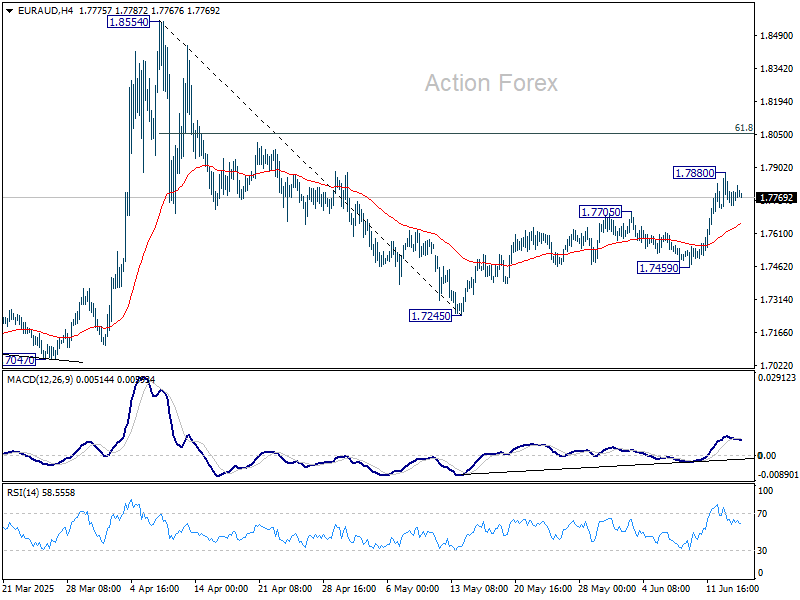
In the bigger picture, with 55 W MACD staying well below signal line, 1.8554 is likely a medium term top already. Price actions from there are seen as a corrective pattern only. While deeper pullback might be seen, downside should be contained by 38.2% retracement of 1.4281 (2022 low) to 1.8554 at 1.6922 to bring rebound. Up trend from 1.4281 is still expected to resume at a later stage.
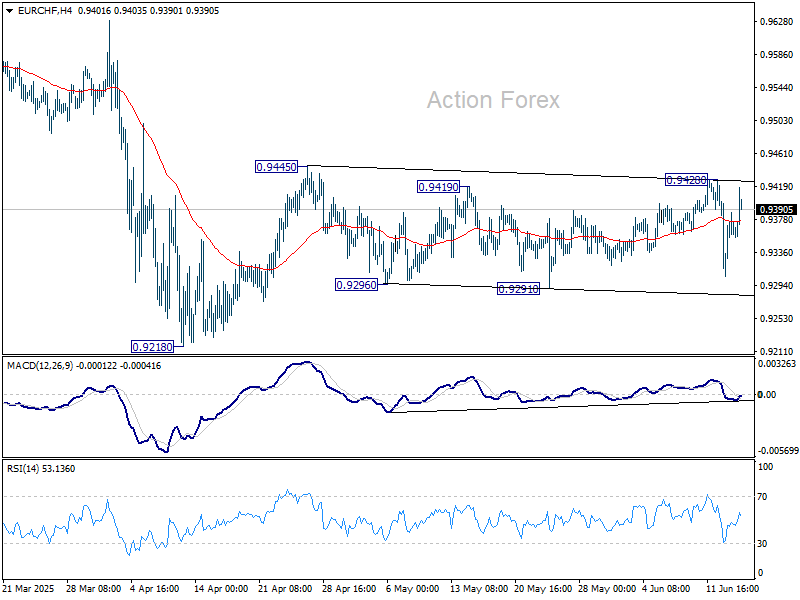
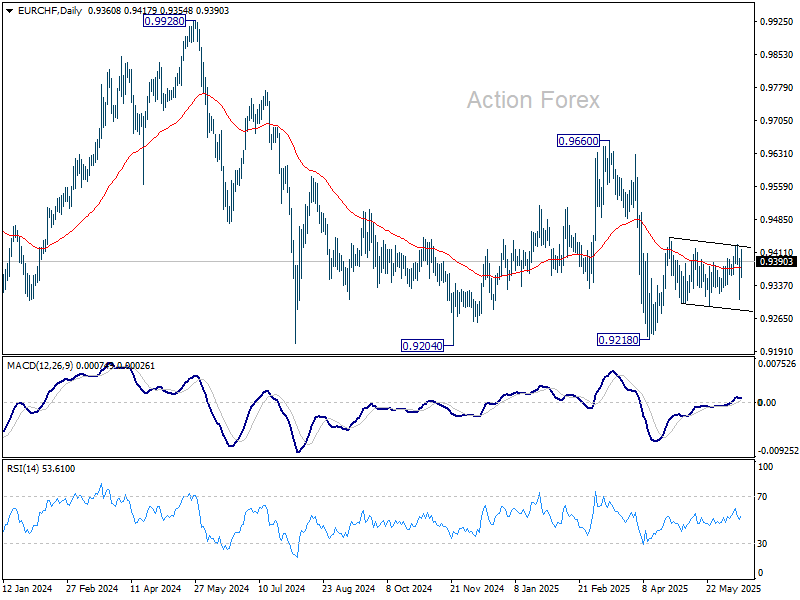
EUR/CHF Daily Outlook
Daily Pivots: (S1) 0.9312; (P) 0.9363; (R1) 0.9419; More....
EUR/CHF rebounded further today but stays inside range of 0.9291/9428. Intraday bias remains neutral at this point. On the upside, break of 0.9428 will resume the rebound from 0.9218 through 0.9445 resistance. However, break of 0.9291 will bring retest of 0.9218 instead.
In the bigger picture, prior rejection by long-term falling channel resistance (now at 0.9527) retains medium term bearishness. That is, down trend from 1.2004 (2018 high) is still in progress. Firm break of 0.9204 (2024 low) will confirm resumption. This will remain the favored case as long as 0.9660 resistance holds.
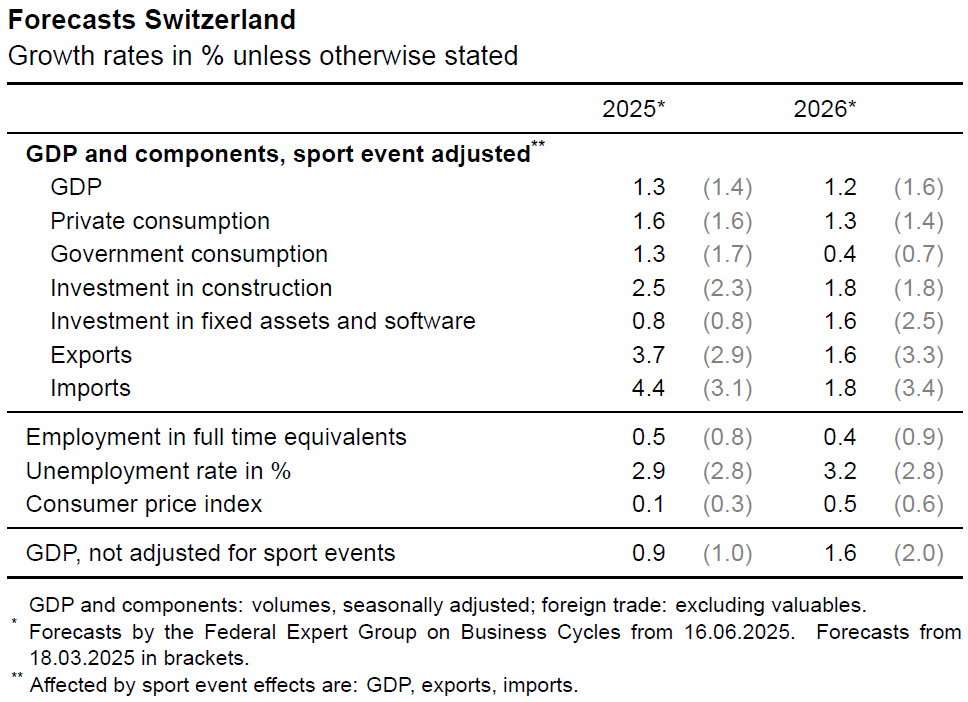
Swiss government cuts GDP forecast, warns of below-average growth in 2025–26
Switzerland’s Federal Government Expert Group has lowered its economic growth forecasts, citing persistent global trade uncertainty and weaker investment momentum. GDP, adjusted for sporting events, is now projected to grow just 1.3% in 2025 and 1.2% in 2026, down from March’s forecasts of 1.4% and 1.6%, respectively.
These figures imply a period of significantly below-average growth for the Swiss economy, even under the assumption that the recent US import tariffs remain capped at current levels and that the trade conflict does not escalate further.
The inflation forecast for 2025 has been revised down to just 0.1%. In 2026, inflation is projected to pick up to 0.5%.
Gold Hits Record Highs as Risk Aversion Dominates the Market
The price of gold surged to a new record on Monday, reaching 3,446 USD per troy ounce, approaching the peaks seen in April. The rise reflects intensified demand for safe-haven assets as investors react to heightened geopolitical tensions and a broadly weaker US dollar.
Geopolitical fears and monetary policy in focus
The ongoing conflict between Israel and Iran has escalated, prompting fears of a broader geopolitical fallout in the region. This environment is driving capital into defensive assets, such as gold, as risk appetite continues to wane.
Meanwhile, markets are shifting their attention to this week’s US Federal Reserve meeting, which begins on Tuesday and concludes on Wednesday evening. While the Fed is expected to hold interest rates steady, investors will closely watch for any forward guidance on rate cuts, especially following the release of weaker-than-expected US inflation data, which has reinforced speculation of a policy easing as early as September.
Additionally, market participants are awaiting details on President Donald Trump's next wave of tariffs, which the White House is reportedly preparing to implement in the coming weeks. These trade measures are key in evaluating the broader economic outlook.
The US dollar remains under pressure, which continues to support the bullish momentum in gold.
Technical analysis of XAU/USD
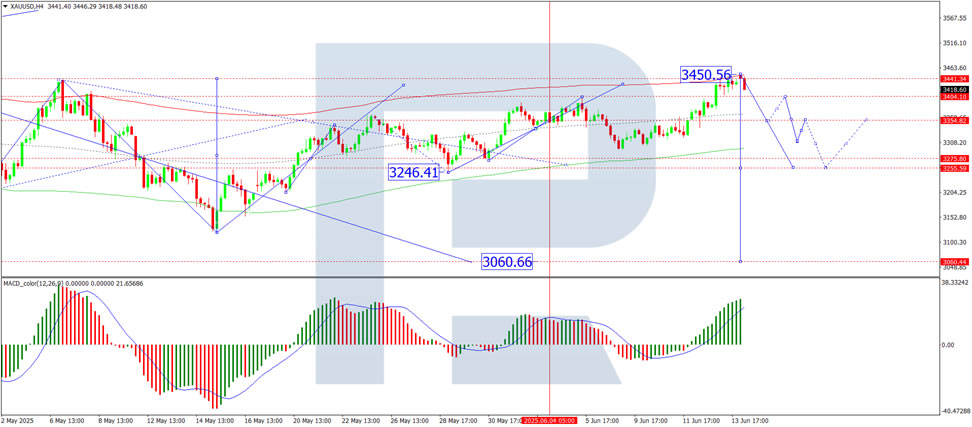
On the H4 chart, XAU/USD has completed the fifth wave of growth, reaching a peak at 3,450 USD. A new decline towards 3,400 USD is now expected. If this support is breached, the trend may extend further down to 3,350 USD. The MACD indicator supports this bearish outlook, with its signal line above zero, exiting the histogram zone and suggesting a potential reversal towards new lows.
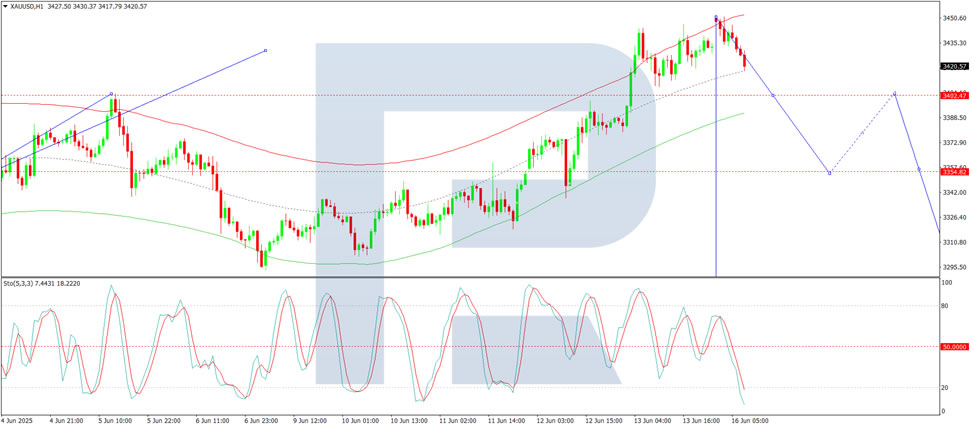
On the H1 chart, the pair is building a downward wave structure targeting 3,400 USD. The price is currently testing the lower boundary of the consolidation range at the top of the wave. After reaching 3,400 USD, a correction towards 3,424 USD is anticipated, likely followed by the development of a new downward wave towards 3,375 USD, considered the next local target. The Stochastic oscillator supports this view, with its signal line below 50 and heading towards 20, indicating growing bearish momentum.
Conclusion
Gold remains strongly supported by geopolitical instability, a weak dollar, and dovish monetary policy expectations. While the asset is trading near record highs, technical indicators suggest a potential short-term pullback towards 3,400 USD and possibly deeper to 3,375-3,350 USD. However, the overall bullish trend remains intact as long as risk-off sentiment prevails and macro uncertainty lingers.
Gold and WTI Crude Oil Regain Bullish Momentum
Gold price started a fresh surge above the $3,375 resistance level. WTI Crude oil prices climbed higher above $70.00 and might extend gains.
Important Takeaways for Gold and WTI Crude Oil Prices Analysis Today
- Gold price started a fresh surge and traded above $3,420 against the US Dollar.
- A key bullish trend line is forming with support at $3,415 on the hourly chart of gold at FXOpen.
- WTI Crude oil prices started a decent increase above the $65.00 and $68.50 resistance levels.
- There is a major bullish trend line forming with support at $71.50 on the hourly chart of XTI/USD at FXOpen.
Gold Price Technical Analysis
On the hourly chart of Gold at FXOpen, the price formed a base near the $3,300 zone. The price started a steady increase above the $3,350 and $3,375 resistance levels.
There was a decent move above the 50-hour simple moving average and $3,400. The bulls pushed the price above the $3,420 resistance zone. A high was formed near $3,450 and the price is now consolidating gains.
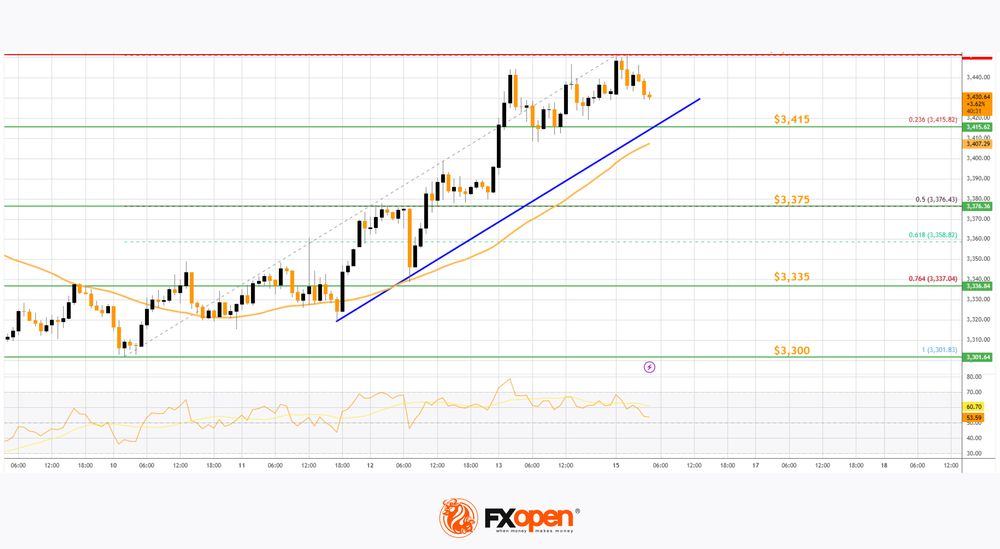
On the downside, immediate support is near the $3,415 level and the 23.6% Fib retracement level of the upward move from the $3,301 swing low to the $3,451 high.
Besides, there is a key bullish trend line forming with support at $3,415. The next major support sits at $3,375 and the 50% Fib retracement level of the upward move from the $3,301 swing low to the $3,451 high.
A downside break below the $3,375 support might send the price toward the $3,335 support. Any more losses might send the price toward the $3,300 support zone.
Immediate resistance is near the $3,450 level. The next major resistance is near the $3,460 level. An upside break above the $3,460 resistance could send Gold price toward $3,480. Any more gains may perhaps set the pace for an increase toward the $3,500 level.
Oil Price Technical Analysis
On the hourly chart of WTI Crude Oil at FXOpen, the price started a decent upward move from $65.00 against the US Dollar. The price gained bullish momentum after it broke the $68.50 resistance and the 50-hour simple moving average.
The bulls pushed the price above the $69.50 and $71.50 resistance levels. The recent high was formed at $74.80 and the price started a downside correction. There was a minor move below the 50% Fib retracement level of the upward move from the $69.55 swing low to the $74.83 high.
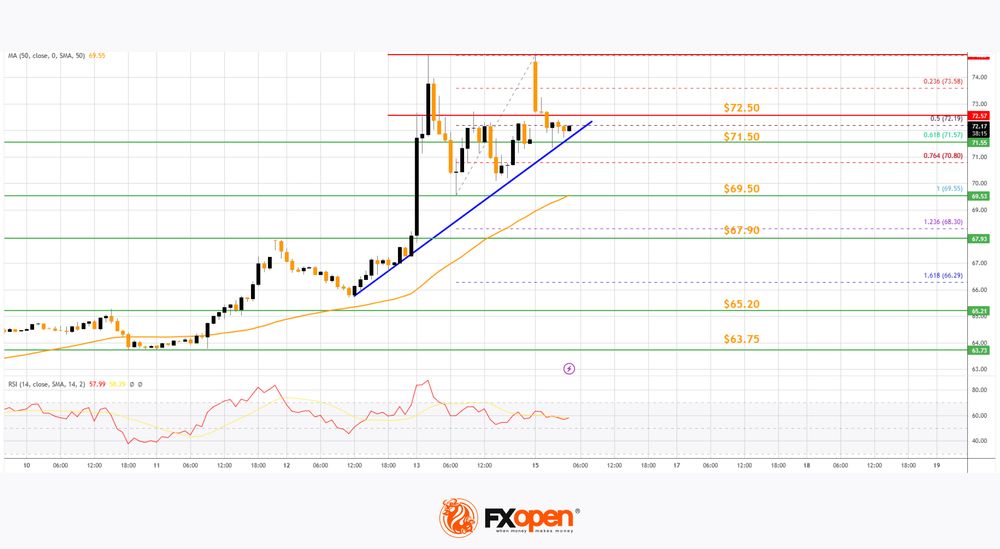
The RSI is now below the 60 level. Immediate support on the downside is near the $71.50 zone. There is also a major bullish trend line forming with support at $71.50 and the 61.8% Fib retracement level of the upward move from the $69.55 swing low to the $74.83 high.
The next major support on the WTI crude oil chart is near the $69.50 zone, below which the price could test the $67.90 level. If there is a downside break, the price might decline toward $65.20. Any more losses may perhaps open the doors for a move toward the $63.75 support zone.
If the price climbs higher again, it could face resistance near $72.50. The next major resistance is near the $74.80 level. Any more gains might send the price toward the $78.50 level.
Start trading commodity CFDs with tight spreads. Open your trading account now or learn more about trading commodity CFDs with FXOpen.
This article represents the opinion of the Companies operating under the FXOpen brand only. It is not to be construed as an offer, solicitation, or recommendation with respect to products and services provided by the Companies operating under the FXOpen brand, nor is it to be considered financial advice.
XAU/USD Chart Analysis Following Israel-Iran Strikes
In 2025, the price of gold continues to form a long-term upward trend, highlighted by the black line. The red line previously acted as resistance, resulting in the formation of a contracting triangle on the XAU/USD chart – a typical sign of market equilibrium.
However, this red line was breached (as indicated by the arrow) amid news of the exchange of strikes between Israel and Iran. In response, gold price movements have more clearly outlined the rising blue channel, which began to take shape in the second half of May.
Over the weekend, the strikes continued, and on Monday morning, trading opened with a modest bullish gap. This indicates that geopolitical risk concerns are helping to keep gold prices anchored above the red line.
What could happen to the price of gold next?
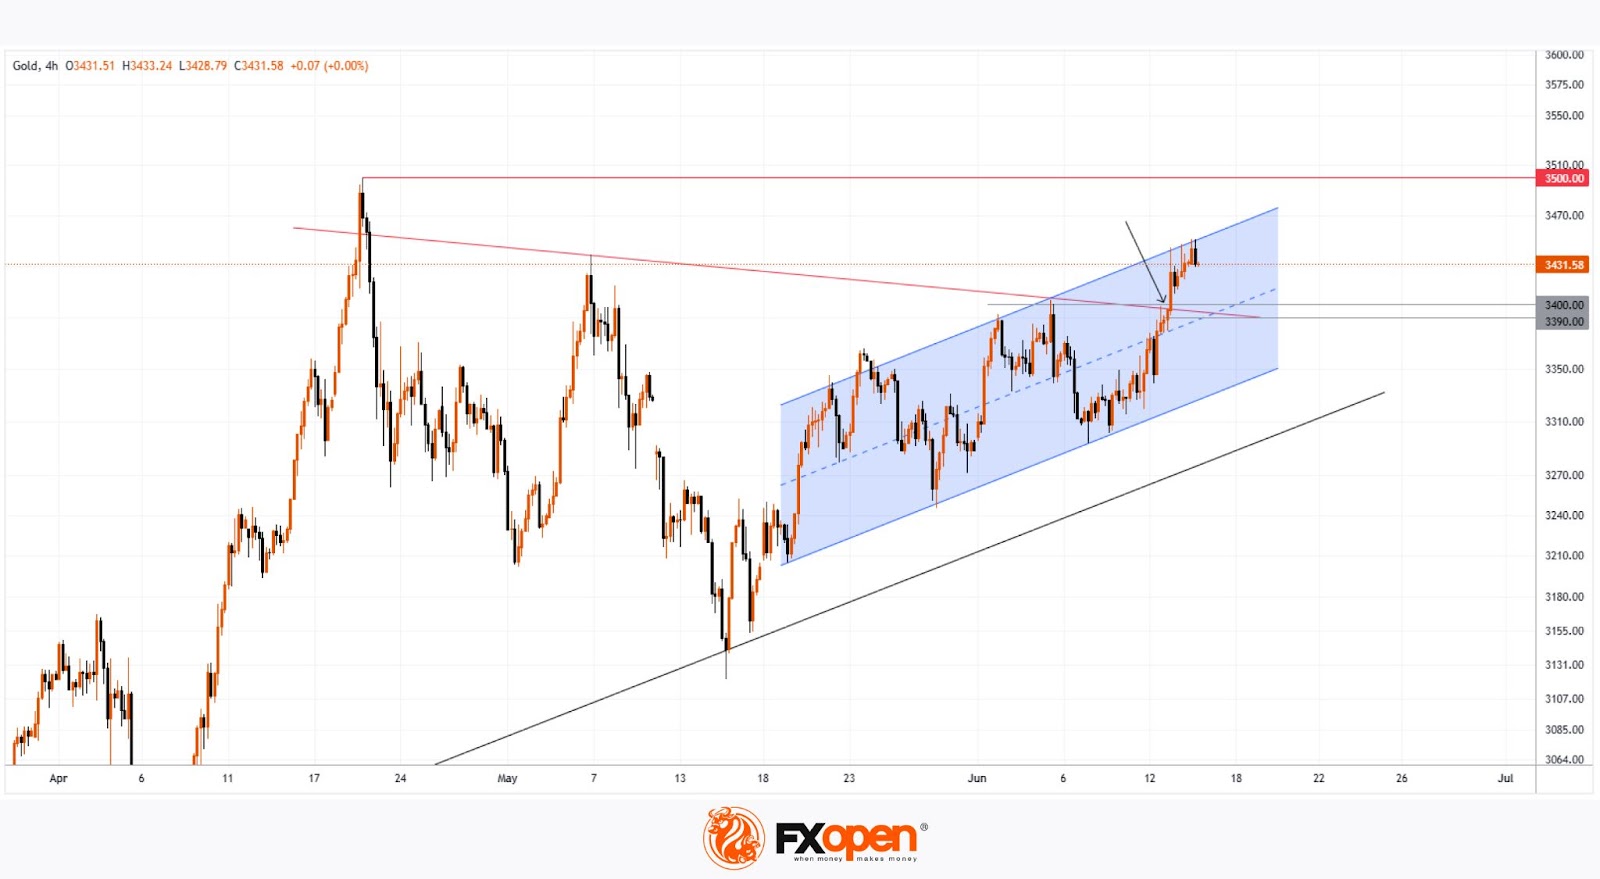
Much will depend on how the situation in the Middle East develops. Should the exchange of strikes between Iran and Israel subside and official statements offer hope for de-escalation, a pullback from the upper boundary of the blue channel is likely.
If such a scenario plays out, technical analysts may focus on the support zone around $3,390–3,400 on the XAU/USD chart, formed by:
→ the psychological level of $3,400;
→ the red line, which previously acted as resistance;
→ the median of the blue channel.
Start trading commodity CFDs with tight spreads. Open your trading account now or learn more about trading commodity CFDs with FXOpen.
This article represents the opinion of the Companies operating under the FXOpen brand only. It is not to be construed as an offer, solicitation, or recommendation with respect to products and services provided by the Companies operating under the FXOpen brand, nor is it to be considered financial advice.
EUR/USD Daily Outlook
Daily Pivots: (S1) 1.1491; (P) 1.1552; (R1) 1.1616; More...
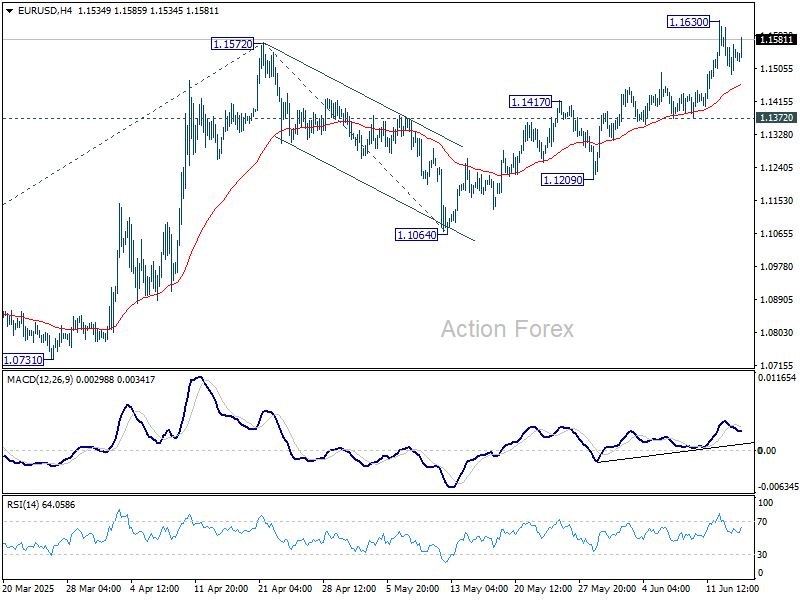
EUR/USD is staying in consolidations below 1.1630 and intraday bias remains neutral. Further rise is expected as long as 1.1372 support holds. Break of 1.1572 will extend the rally from 1.0176. Next target is 61.8% projection of 1.0176 to 1.1572 from 1.1064 at 1.1927. However, break of 1.1372 support will indicate short term topping, and turn bias to the downside for deeper pullback.
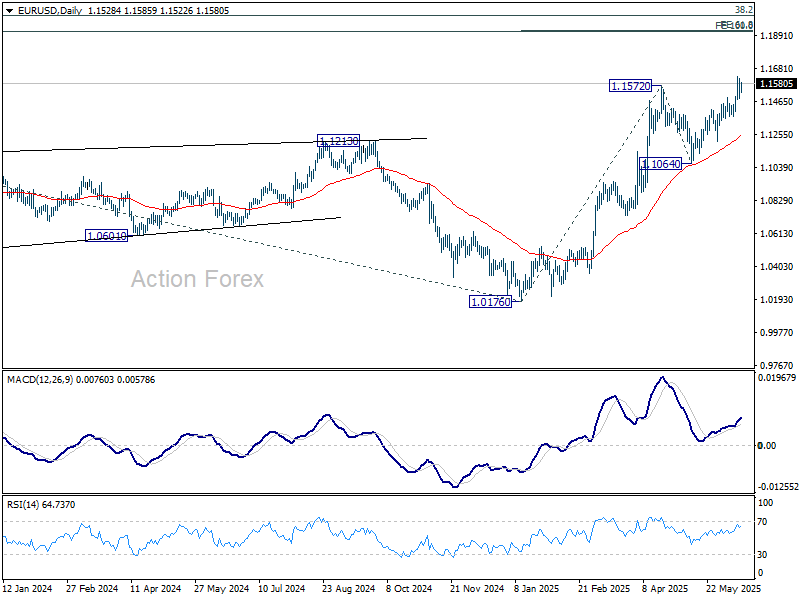
In the bigger picture, rise from 0.9534 long term bottom could be correcting the multi-decade downtrend or the start of a long term up trend. In either case, further rise should be seen to 100% projection of 0.9534 to 1.1274 from 1.0176 at 1.1916. This will now remain the favored case as long as 1.1604 support holds.
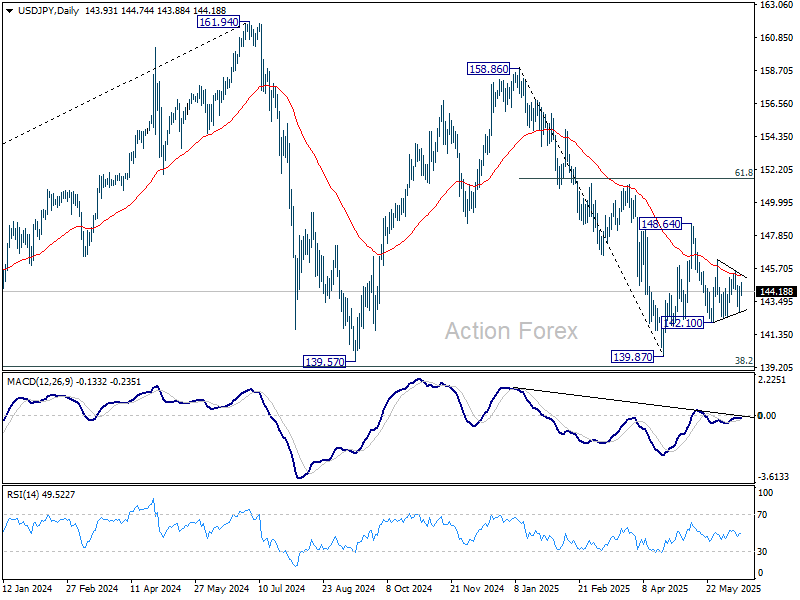
USD/JPY Daily Outlook
Daily Pivots: (S1) 143.10; (P) 143.79; (R1) 144.78; More...
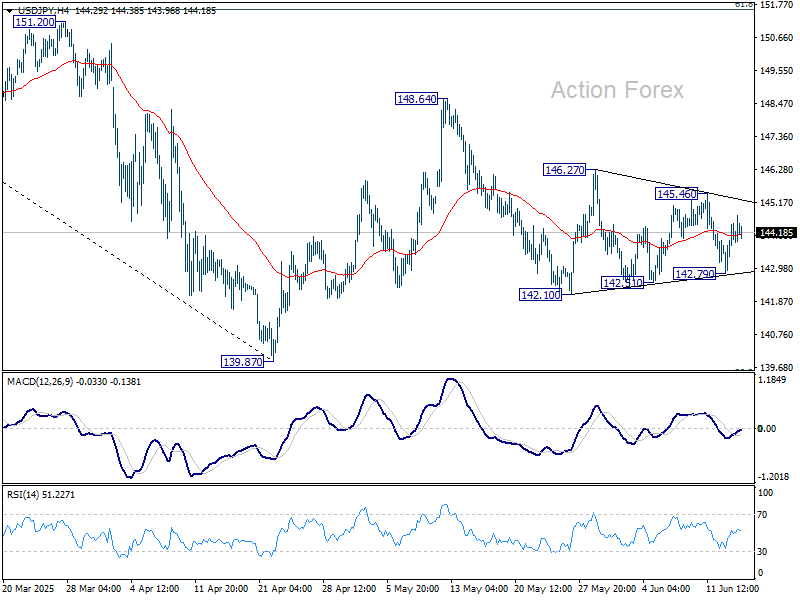
Sideway trading continues in USD/JPY and intraday bias remains neutral. On the downside, break of 142.10 support will resume the fall from 148.64 to retest 139.87 low. On the upside, above 145.46 will turn bias to the upside for 146.27 first. Firm break there will target 148.64 resistance.
In the bigger picture, price actions from 161.94 are seen as a corrective pattern to rise from 102.58 (2021 low), with fall from 158.86 as the third leg. Strong support should be seen from 38.2% retracement of 102.58 to 161.94 at 139.26 to bring rebound. However, sustained break of 139.26 would open up deeper medium term decline to 61.8% retracement at 125.25.
GBP/USD Daily Outlook
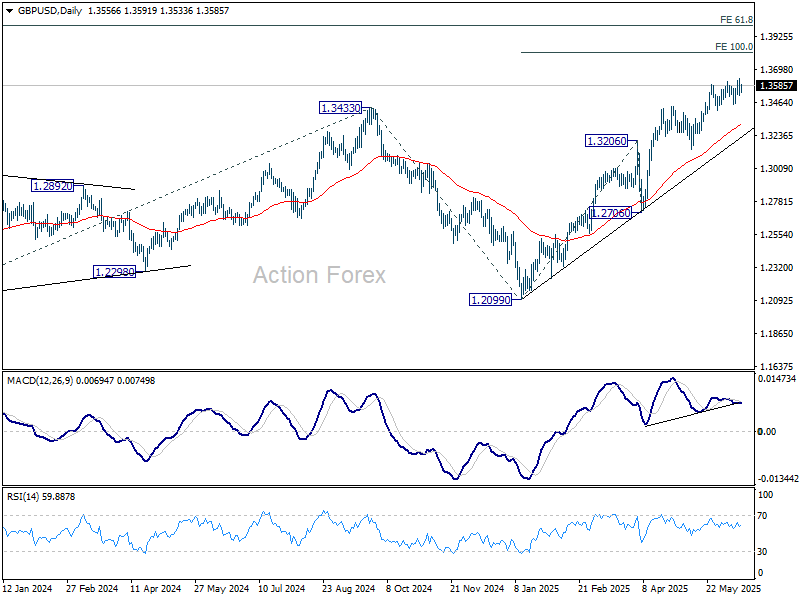
Daily Pivots: (S1) 1.3517; (P) 1.3574; (R1) 1.3632; More...
Intraday bias in GBP/USD stays neutral at this point. Consolidations could continue below 1.3631 temporary top. But further rally is expected as long as 1.3455 support holds. Break of 1.3631 will resume the rise from 1.2099 and target 100% projection of 1.2099 to 1.3206 from 1.3138 at 1.3813. On the downside, break of 1.3455 support should confirm short term topping, and bring deeper correction to 55 D EMA (now at 1.3320) instead.
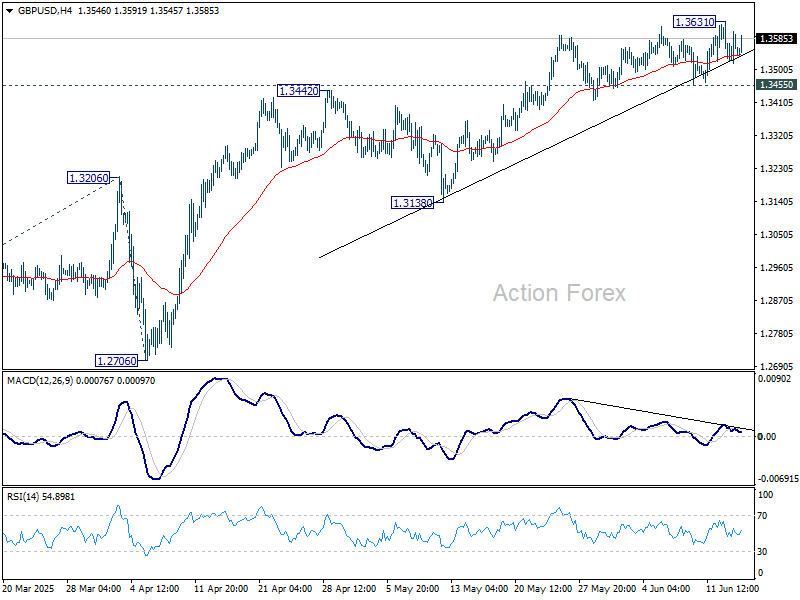
In the bigger picture, up trend from 1.3051 (2022 low) is in progress. Next medium term target is 61.8% projection of 1.0351 to 1.3433 from 1.2099 at 1.4004. Outlook will now stay bullish as long as 55 W EMA (now at 1.2937) holds, even in case of deep pullback.