
Sample Category Title
AUD/USD Weekly Report
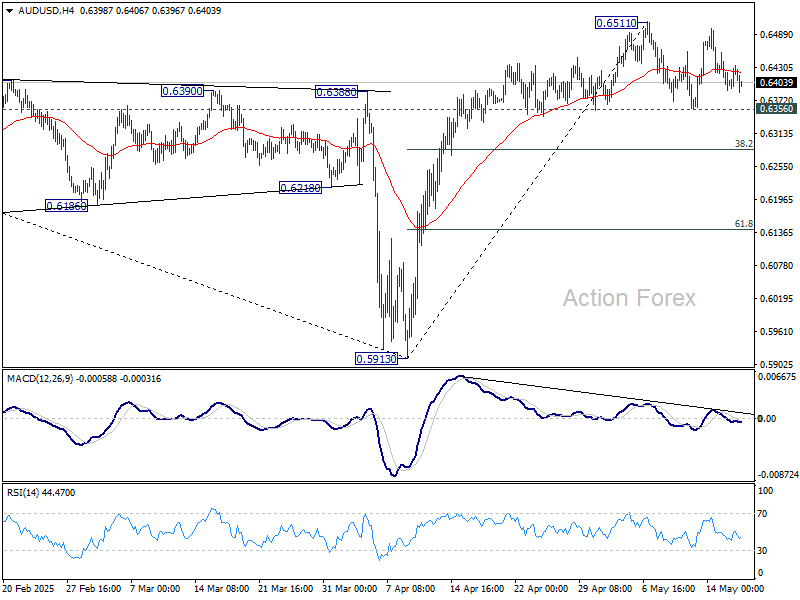
AUD/USD stayed in range trading below 0.6511 short term top last week. Initial bias remains neutral this week first, and further rise is in favor as long as 0.6356 support holds. One the upside, break of 0.6511 will resume the rise from 0.5913 and target 61.8% retracement of 0.6941 to 0.5913 at 0.6548. However, firm break of 0.6356 will bring deeper pullback to 38.2% retracement of 0.5913 to 0.6511 at 0.6283 first.
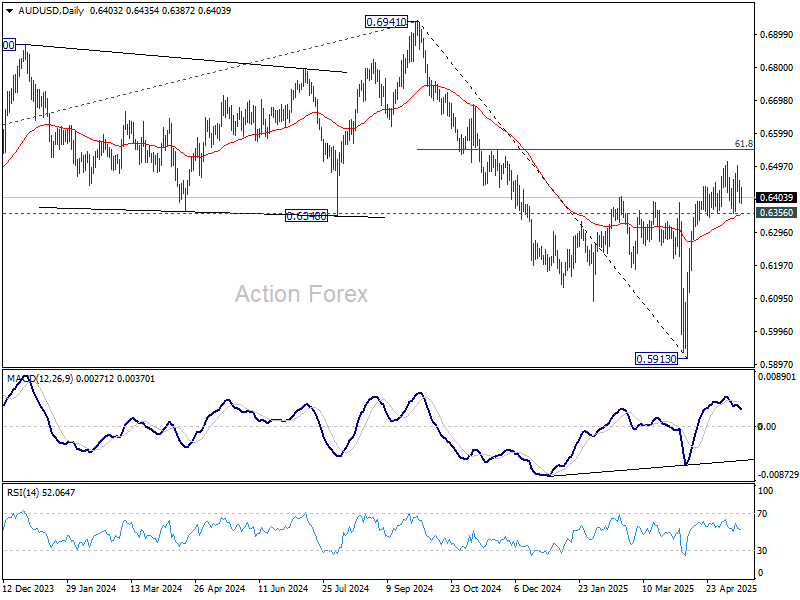
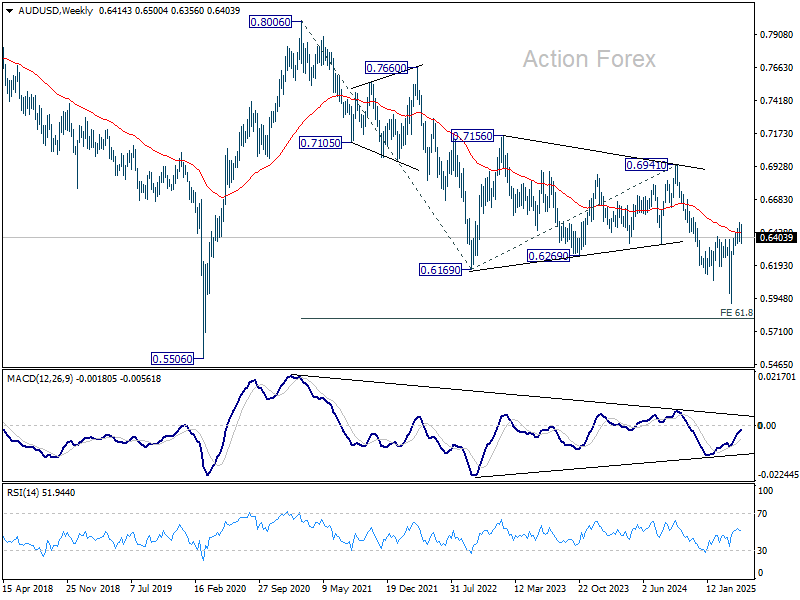
In the bigger picture, as long as 55 W EMA (now at 0.6441) holds, down trend from 0.8006 (2021 high) should resume later to 61.8% projection of 0.8006 to 0.6169 from 0.6941 at 0.5806. However, sustained trading above 55 W EMA will argue that a medium term bottom was already formed, and set up further rebound to 0.6941 resistance instead.
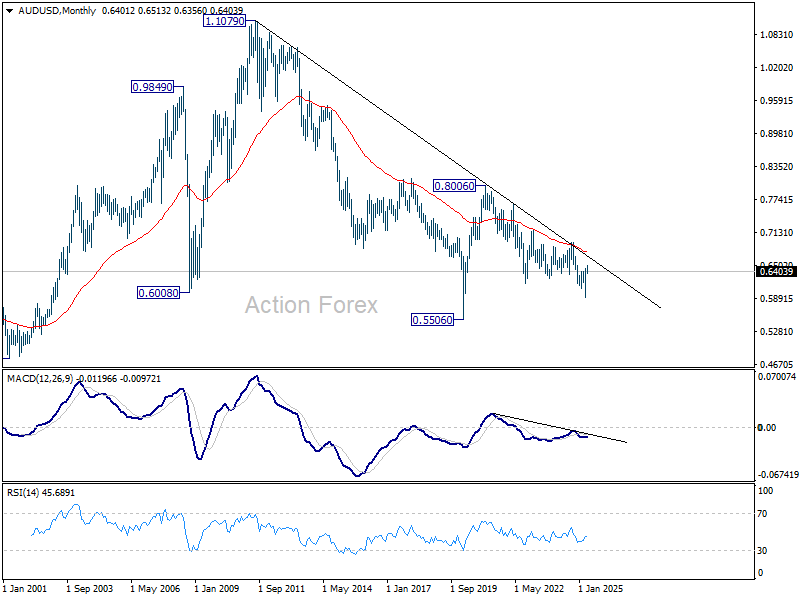
In the long term picture, prior rejection by 55 M EMA (now at 0.6764) is taken as a bearish signal. But for now, fall from 0.8006 is still seen as the second leg of the corrective pattern from 0.5506 long term bottom (2020 low). Hence, in case of deeper decline, strong support should emerge above 0.5506 to contain downside to bring reversal.
USD/CAD Weekly Outlook
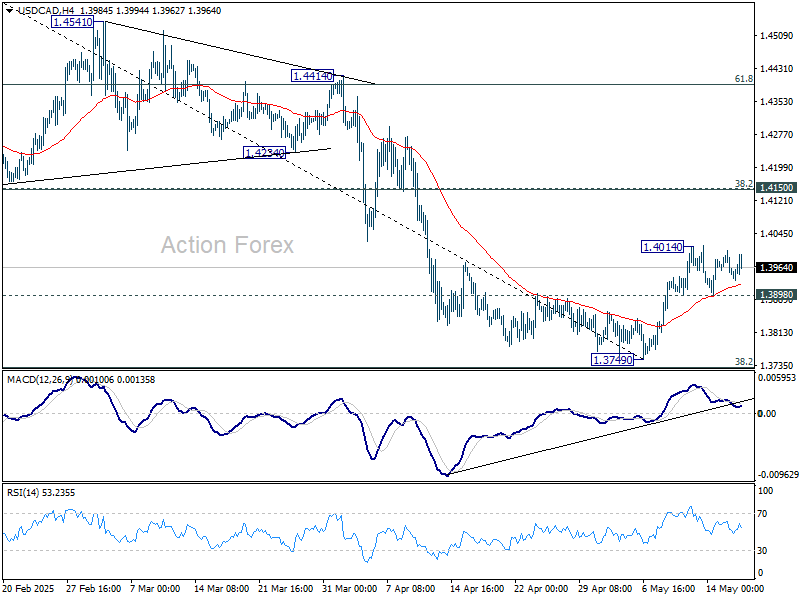
USD/CAD rose to 1.4014 last week but turned sideway since then. Initial bias remains neutral this week, and further rise is expected as long as 1.3898 support holds. Above 1.4014 will resume the rebound from 1.3749 short term bottom to 1.4150 cluster resistance (38.2% retracement of 1.4791 to 1.3749 at 1.4147). However, firm break of 1.3898 will bring retest of 1.3749 low instead.
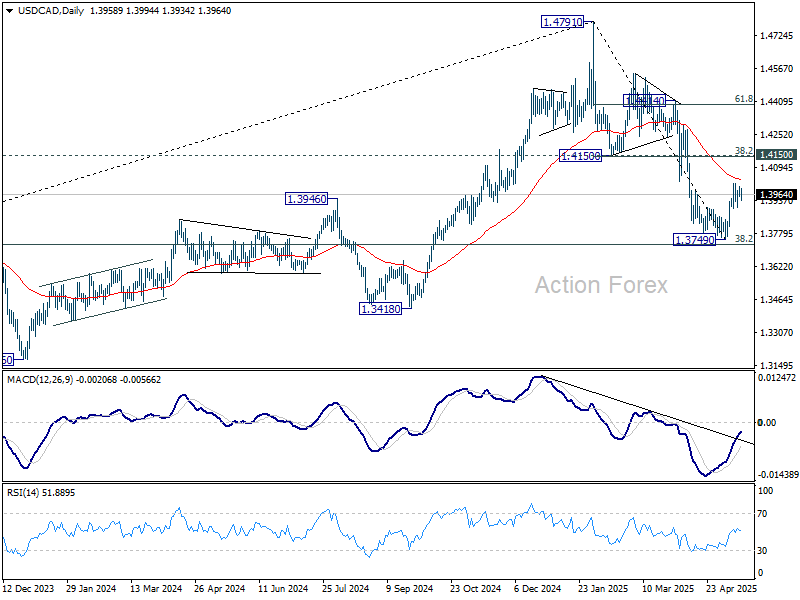
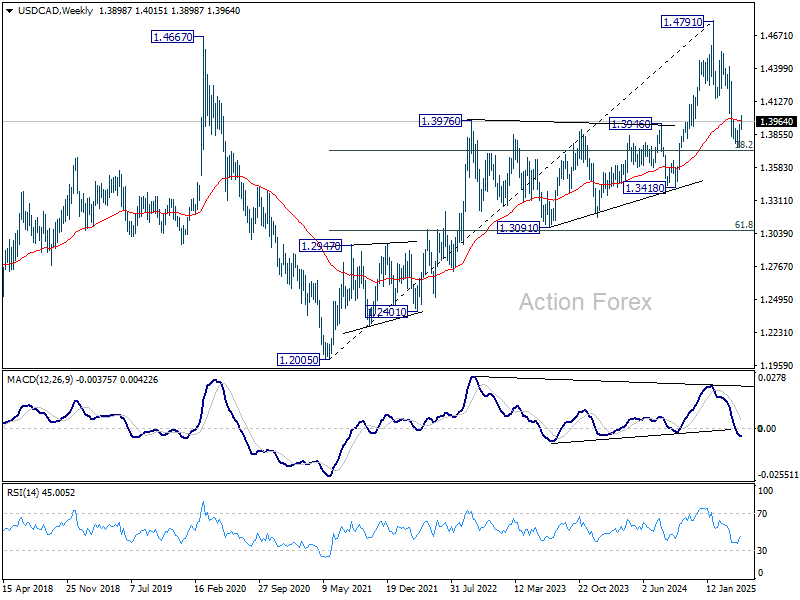
In the bigger picture, price actions from 1.4791 medium term top could either be a correction to rise from 1.2005 (2021 low), or trend reversal. In either case, further decline is expected as long as 1.4150 resistance turned support holds. Firm break of 38.2% retracement of 1.2005 (2021 low) to 1.4791 at 1.3727 will pave the way back to 61.8% retracement at 1.3069.
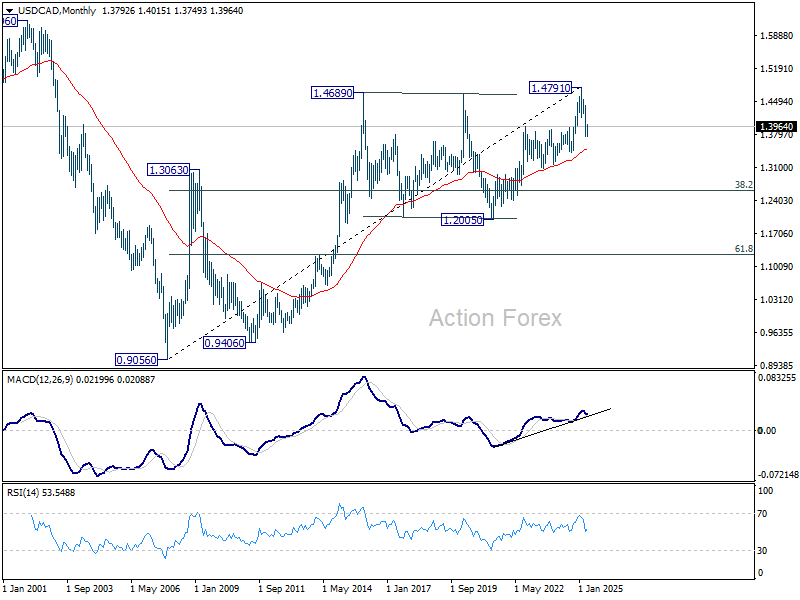
In the long term picture, as long as 55 M EMA (now at 1.3493) holds, up trend from 0.9056 (2007 low) should still resume through 1.4791 at a later stage. However, sustained trading below 55 M EMA will argue that the up trend has already completed, with rise from 1.2005 to 1.4791 as the fifth wave. 1.4791 would then be seen as a long term top and deeper medium term down trend should then follow.
GBP/JPY Weekly Outlook
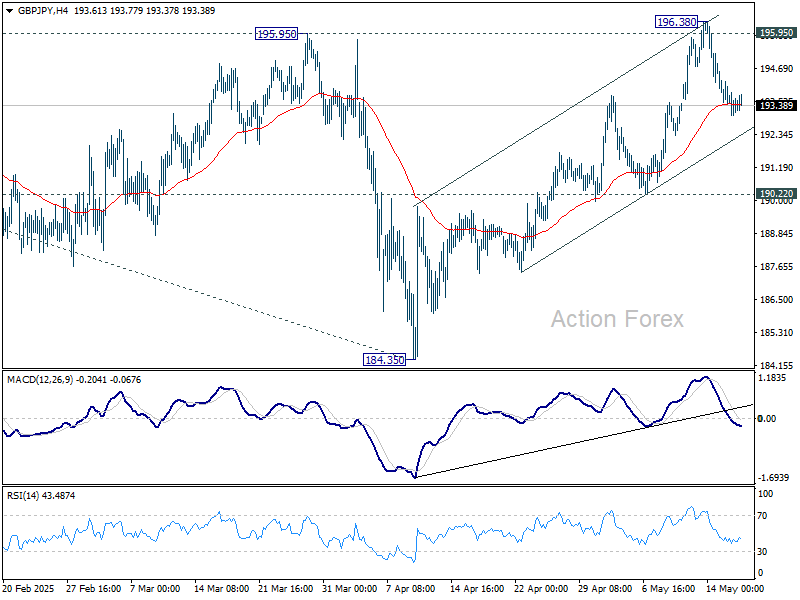
GBP/JPY surged to 196.38 last week but failed to sustain above 195.95 resistance and retreated. Nevertheless, downside is contained well above 190.22 support so far. Initial bias remains neutral this week, and further rise is in favor. On the upside, firm break of 195.95 will suggest that whole choppy decline from 199.79 has completed, and target this resistance next.
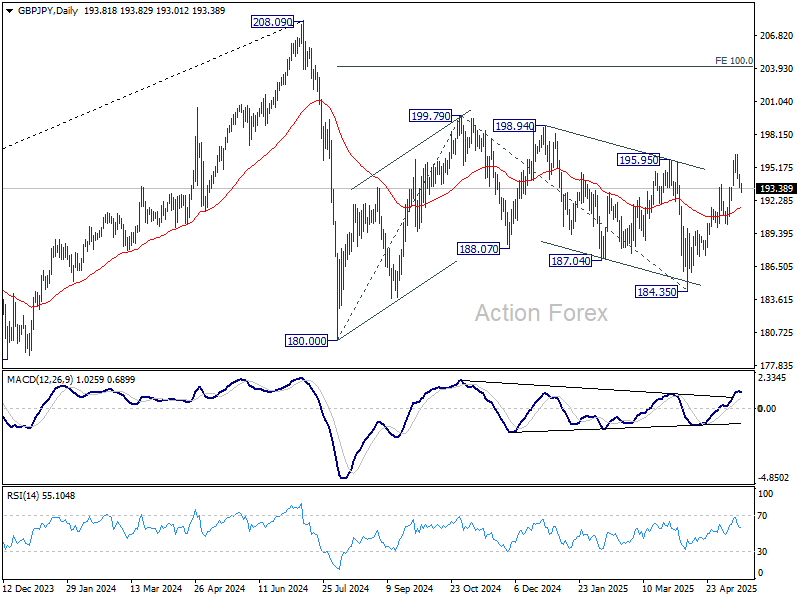
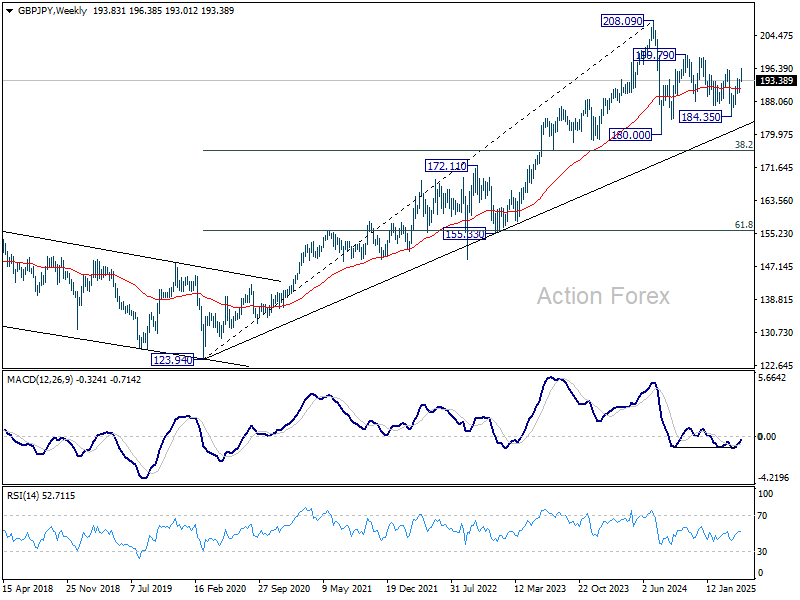
In the bigger picture, price actions from 208.09 are seen as a correction to rally from 123.94 (2020 low). Strong support should be seen from 38.2% retracement of 123.94 to 208.09 at 175.94 to contain downside. However, sustained break of 175.94 will bring deeper fall even still as a correction.
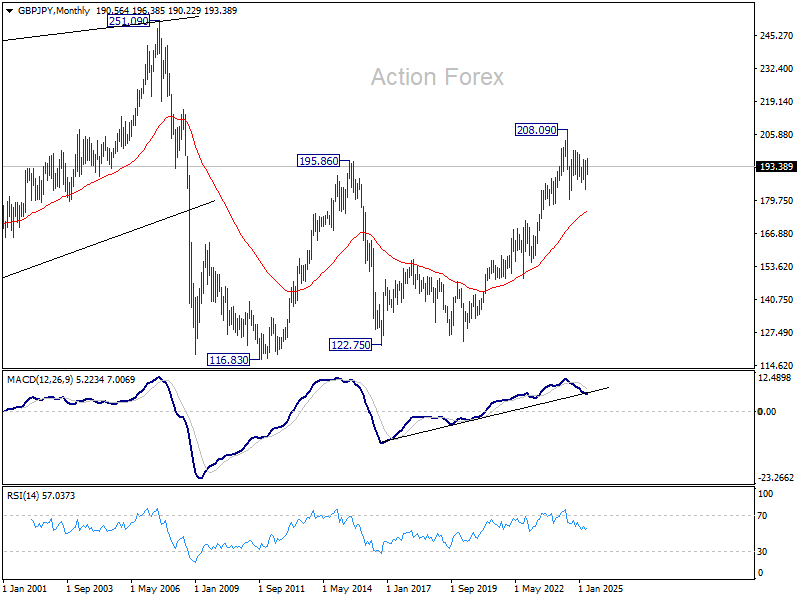
In the longer term picture, while a medium term top was formed at 208.09 (2024 high), it's still early to conclude that the up trend from 122.75 (2016 low) has completed. But GBP/JPY is at least in a medium term corrective phase, with risk of correction to 55 M EMA (now at 175.85).
EUR/JPY Weekly Outlook
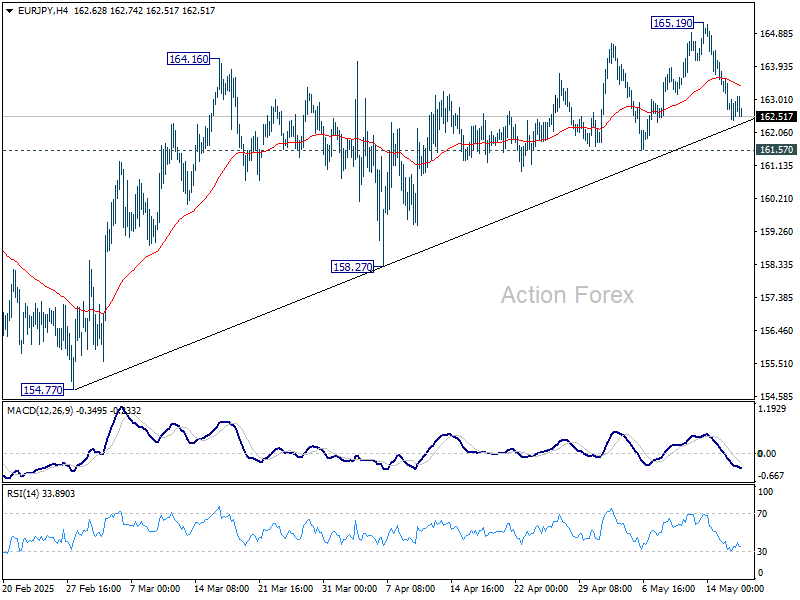
EUR/JPY edged higher to 165.19 last week but retreated since then. Nevertheless, downside is contained above 161.57 support. Initial bias remains neutral this week and further rally is in favor. Break of 165.19 will resume the rise from 154.77 to 166.67 resistance. However, firm break of 161.57 will indicate near term reversal, and turn bias back to the downside.
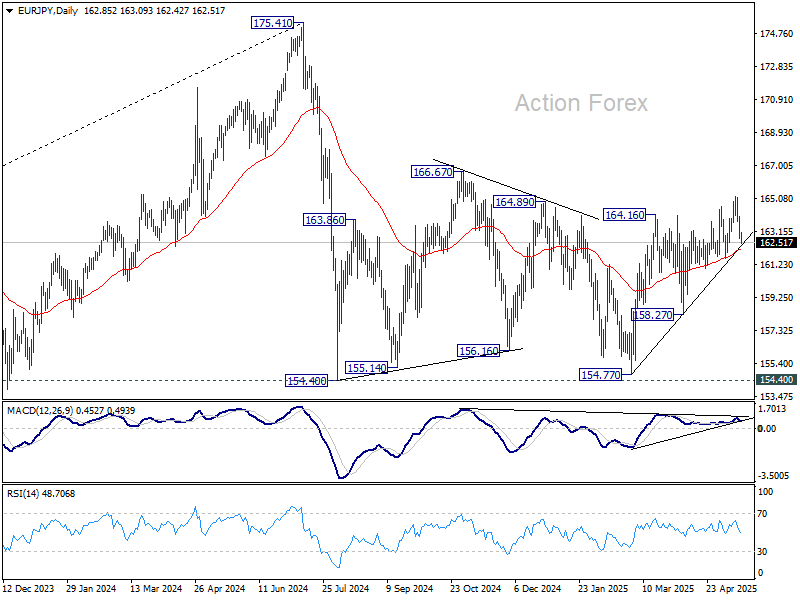
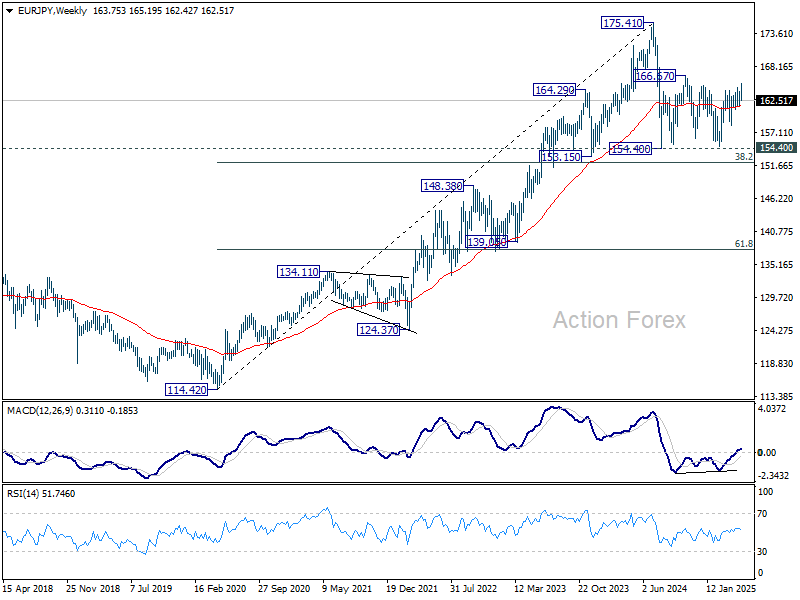
In the bigger picture, price actions from 175.41 are seen as correction to rally from 114.42 (2020 low). Strong support should be seen from 38.2% retracement of 114.42 to 175.41 at 152.11 to contain downside. However, sustained break of 152.11 will bring deeper fall even still as a correction.
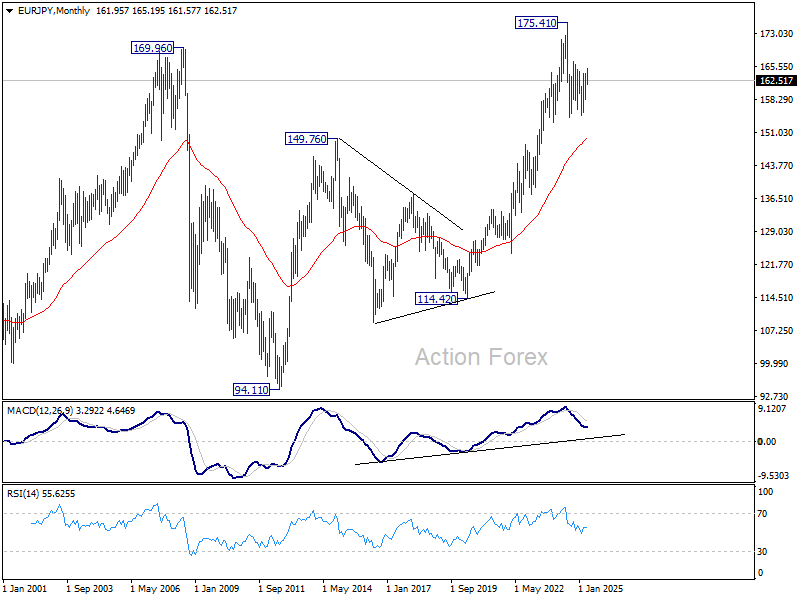
In the long term picture, while 175.41 is at least a medium term top, it's still early to conclude that up trend from 94.11 (2012 low) has completed. A medium term corrective phase is in progress with risk of deeper fall back to 55 M EMA (now at 149.91).
EUR/GBP Weekly Outlook
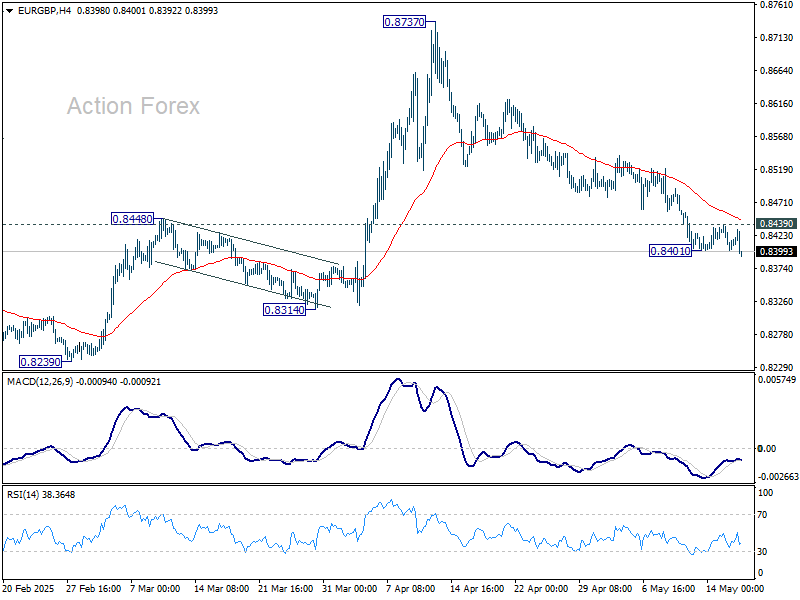
EUR/GBP's decline from 0.8737 continued last week despite interim recovery. As noted before, rise from 0.8221 should have completed as a correction to 0.8737. Initial bias is on the downside this week for 0.8221/8239 support zone. On the upside, above 0.8439 minor resistance will turn intraday bias neutral again first.
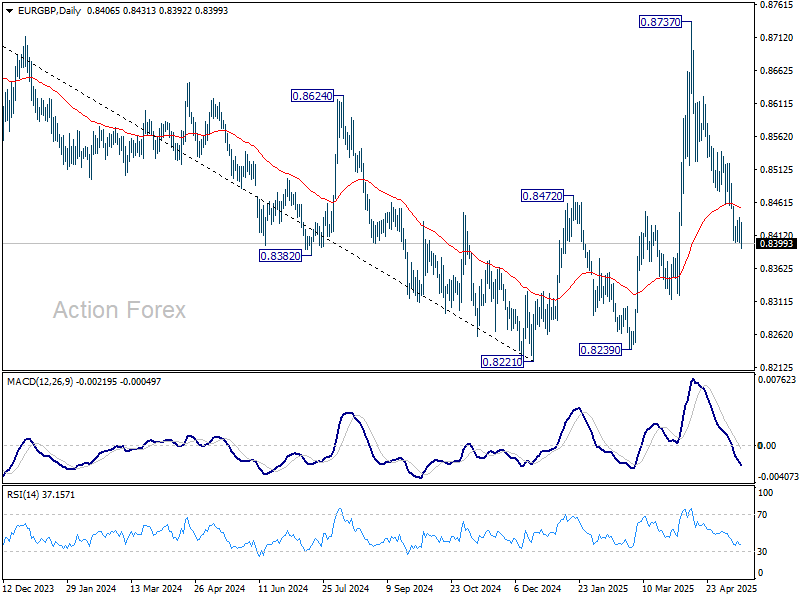
In the bigger picture, current development suggests that price actions from 0.8221 medium term bottom are merely forming a corrective pattern. However, there is no clear momentum to break through 0.8201 key support (2022 low) yet. Hence, range trading is expected between 0.8221/8737 for now.
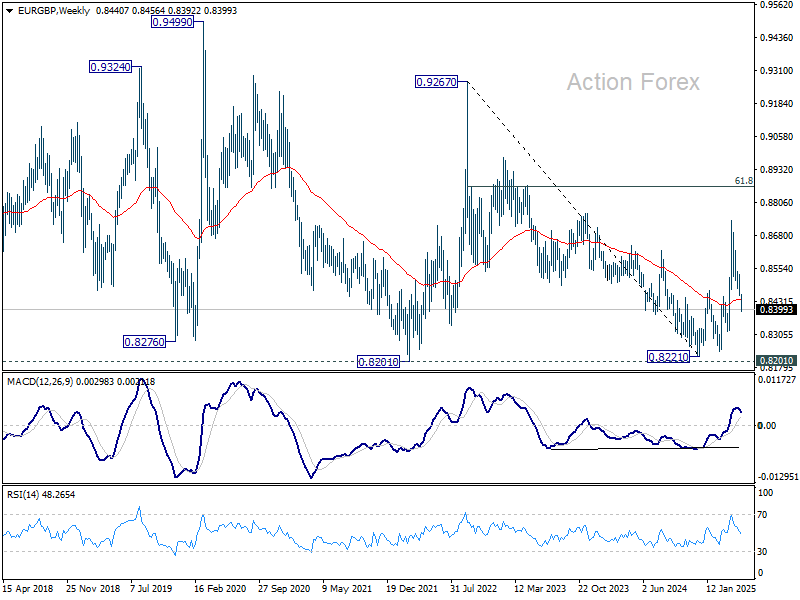
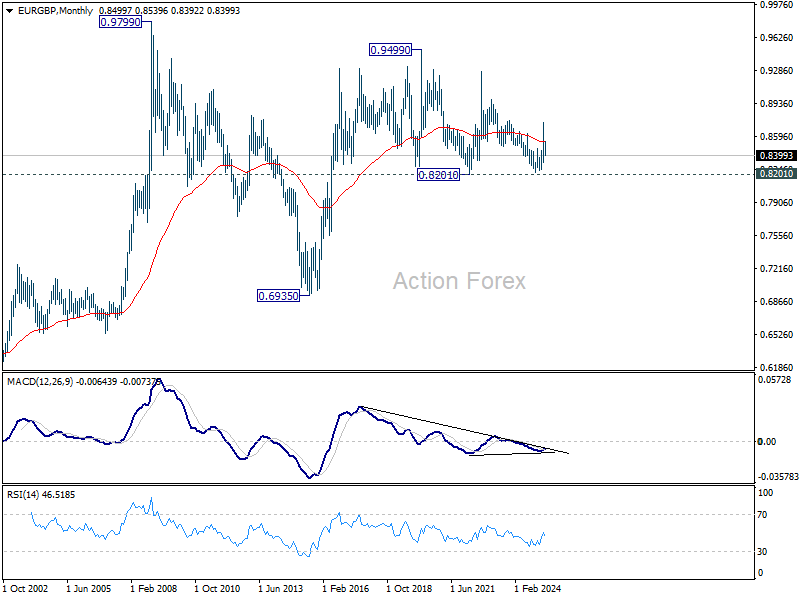
In the long term picture, price action from 0.9499 (2020 high) is seen as part of the long term range pattern from 0.9799 (2008 high). Range trading should continue between 0.8201 and 0.9499, until there is clear signal of imminent breakout.
EUR/AUD Weekly Outlook
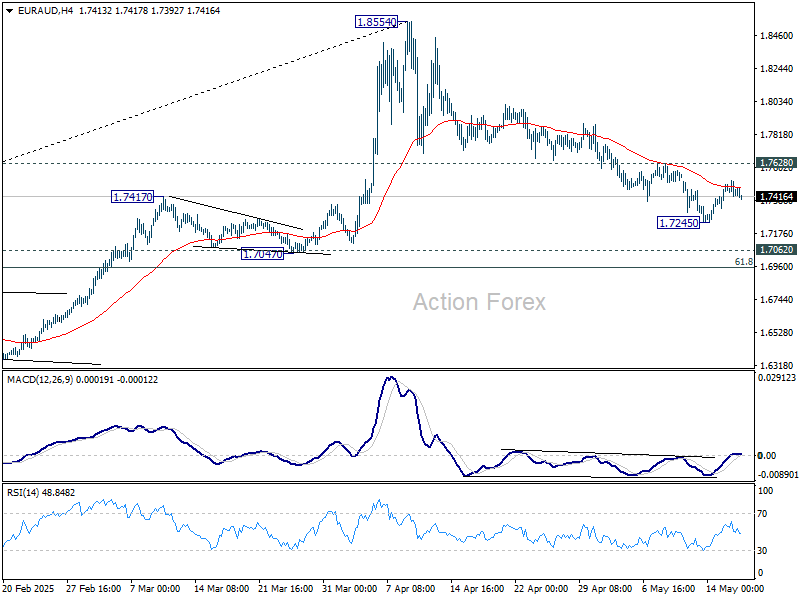
EUR/AUD fell further to 1.7245 last week but recovered since then. Initial bias stays neutral this week first. On the upside, firm break of 1.7628 resistance will suggest that fall from 1.8554 as completed as a correction, and retain larger bullishness. Intraday bias will be back on the upside for stronger rebound. However, below 1.7245 will resume the fall to 61.8% retracement of 1.5963 to 1.8554 at 1.6953.
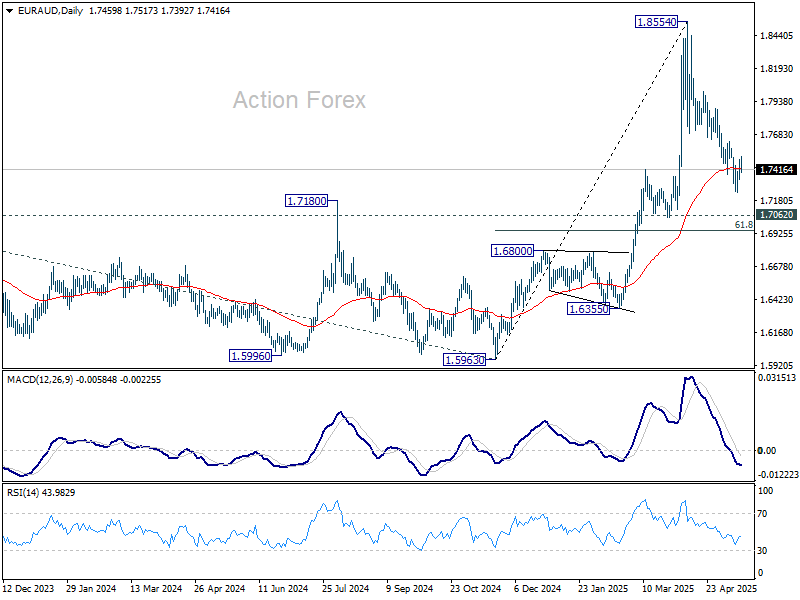
In the bigger picture, as long as 1.7062 resistance turned support (2023 high) holds, up trend from 1.4281 (2022 low) should still be in progress. Break of 1.8554 will target 100% projection of 1.4281 to 1.7062 from 1.5963 at 1.8744. However, sustained break of 1.7062 will confirm medium term topping and bring deeper fall back to 1.5963 support.
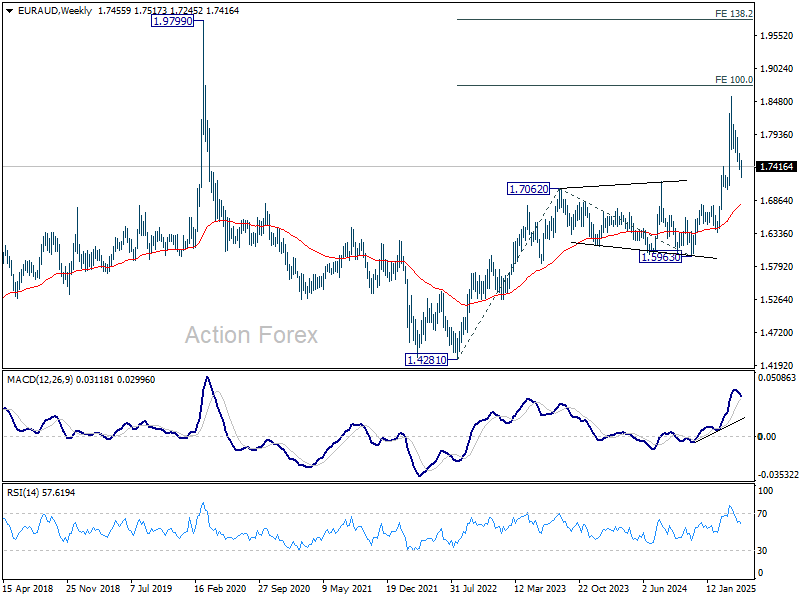
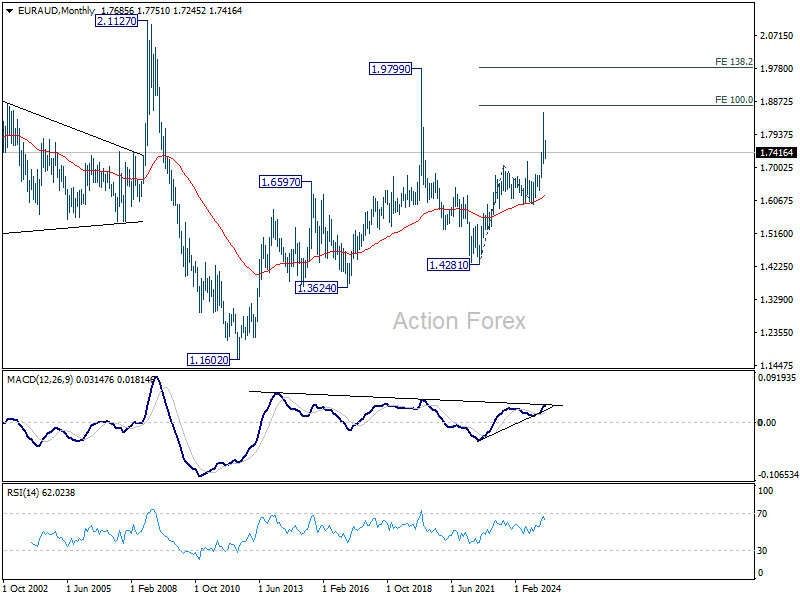
In the longer term picture, rise from 1.4281 is seen as the second leg of the pattern from 1.9799 (2020 high), which is part of the pattern from 2.1127 (2008 high). As long as 55 M EMA (now at 1.6240) holds, this second leg could still extend higher. However, firm break of the above mention 1.8744 projection level with strong momentum will argue that it's indeed resuming the up trend from 1.1602 (2012 low).
EUR/CHF Weekly Outlook
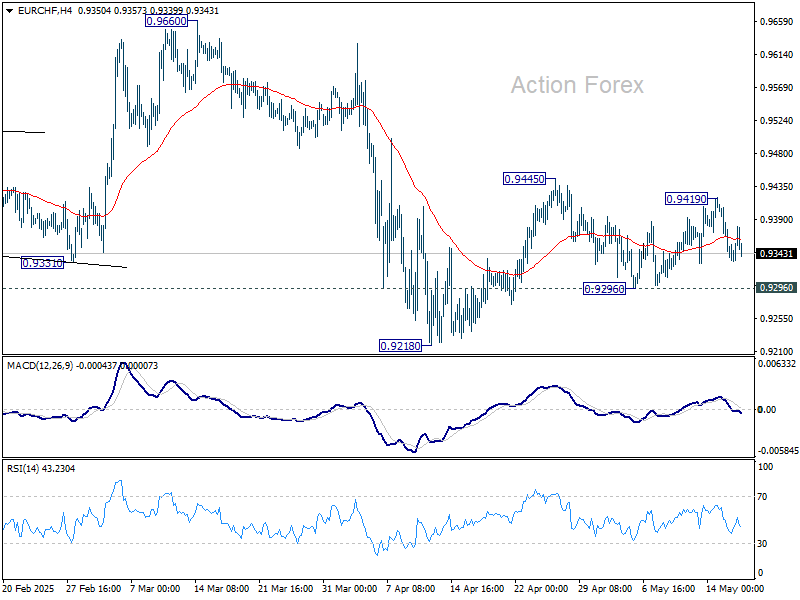
EUR/CHF continued to gyrate in range below 0.9445 last week. Initial bias remains neutral this week first. Price actions from 0.9218 are seen as either a corrective move or the third leg of the pattern from 0.9204. On the upside, break of 0.9419 will resume the rise from 0.9218 through 0.9445 resistance. However, break of 0.9296 support will bring retest of 0.9218 low.
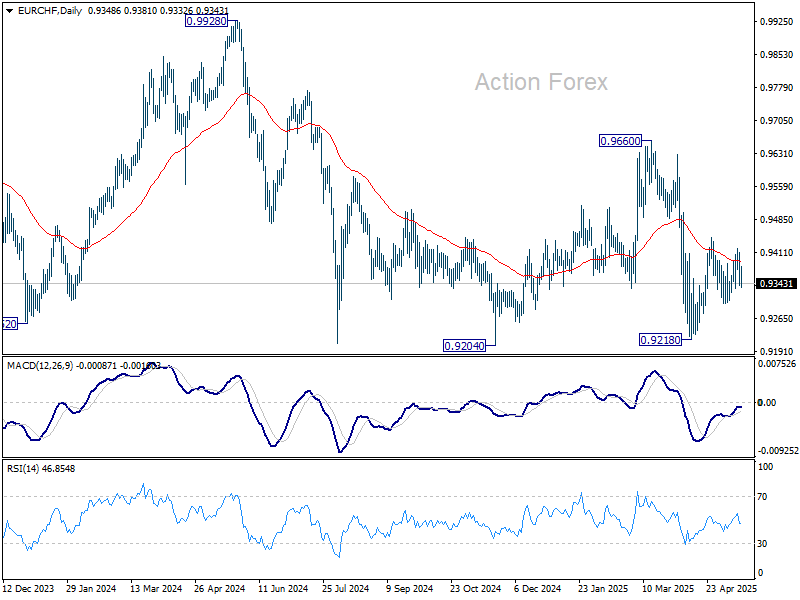
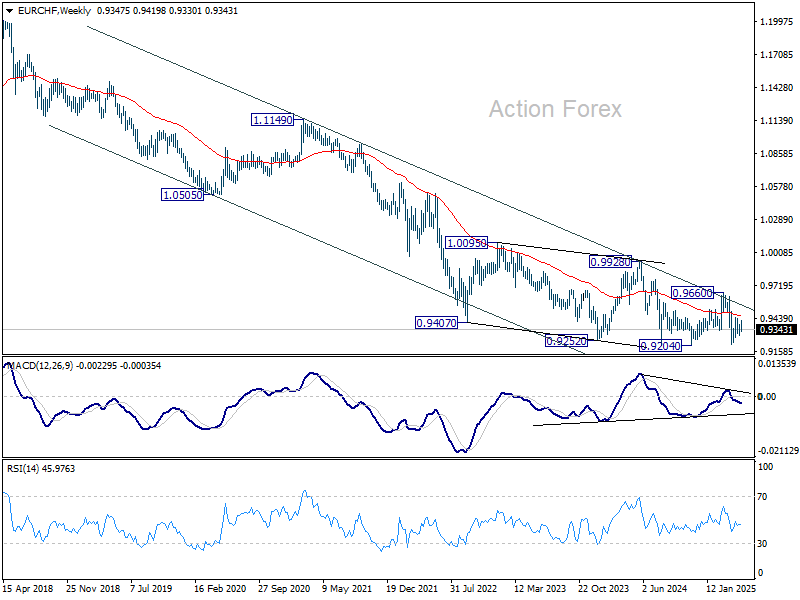
In the bigger picture, prior rejection by long-term falling channel resistance (now at 0.9548) retains medium term bearishness. That is, down trend from 1.2004 (2018 high) is still in progress. Firm break of 0.9204 (2024 low) will confirm resumption. This will remain the favored case as long as 0.9660 resistance holds.
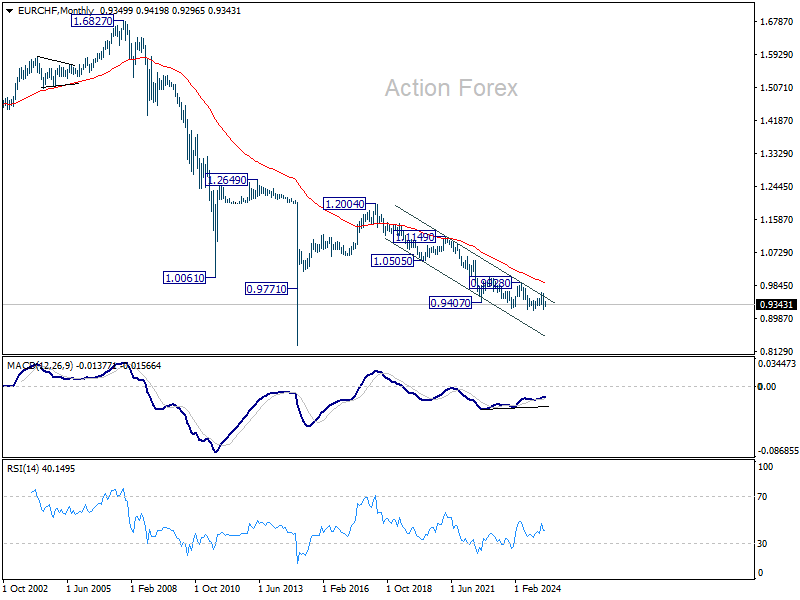
In the long term picture, overall long term down trend is still in force in EUR/CHF. Outlook will continue to stay bearish as long as 55 M EMA (now at 0.9919) holds.
Summary 5/19 – 5/23
Monday, May 19, 2025
| GMT | Ccy | Events | Consensus | Previous |
|---|---|---|---|---|
| 22:30 | NZD | Business NZ PSI Apr | 49.1 | |
| 22:45 | NZD | PPI Input Q/Q Q1 | 0.20% | -0.90% |
| 22:45 | NZD | PPI Output Q/Q Q1 | 0.10% | -0.10% |
| 23:01 | GBP | Rightmove House Price Index M/M May | 1.40% | |
| 02:00 | CNY | Industrial Production Y/Y Apr | 5.70% | 7.70% |
| 02:00 | CNY | Retail Sales Y/Y Apr | 6.00% | 5.90% |
| 02:00 | CNY | Fixed Asset Investment YTD Y/Y Apr | 4.40% | 4.20% |
| 04:30 | JPY | Tertiary Industry Index M/M Mar | -0.20% | 0.00% |
| 09:00 | EUR | Eurozone CPI Y/Y Apr F | 2.20% | 2.20% |
| 09:00 | EUR | Eurozone CPI Core Y/Y Apr F | 2.70% | 2.70% |
| GMT | Ccy | Events | |
|---|---|---|---|
| 22:30 | NZD | Business NZ PSI Apr | |
| Forecast: | Previous: 49.1 | ||
| 22:45 | NZD | PPI Input Q/Q Q1 | |
| Forecast: 0.20% | Previous: -0.90% | ||
| 22:45 | NZD | PPI Output Q/Q Q1 | |
| Forecast: 0.10% | Previous: -0.10% | ||
| 23:01 | GBP | Rightmove House Price Index M/M May | |
| Forecast: | Previous: 1.40% | ||
| 02:00 | CNY | Industrial Production Y/Y Apr | |
| Forecast: 5.70% | Previous: 7.70% | ||
| 02:00 | CNY | Retail Sales Y/Y Apr | |
| Forecast: 6.00% | Previous: 5.90% | ||
| 02:00 | CNY | Fixed Asset Investment YTD Y/Y Apr | |
| Forecast: 4.40% | Previous: 4.20% | ||
| 04:30 | JPY | Tertiary Industry Index M/M Mar | |
| Forecast: -0.20% | Previous: 0.00% | ||
| 09:00 | EUR | Eurozone CPI Y/Y Apr F | |
| Forecast: 2.20% | Previous: 2.20% | ||
| 09:00 | EUR | Eurozone CPI Core Y/Y Apr F | |
| Forecast: 2.70% | Previous: 2.70% | ||
Tuesday, May 20, 2025
| GMT | Ccy | Events | Consensus | Previous |
|---|---|---|---|---|
| 01:15 | CNY | 1-Y Loan Prime Rate | 3.10% | |
| 04:30 | CNY | 5-Y Loan Prime Rate | 3.60% | |
| 04:30 | AUD | RBA Interest Rate Decision | 3.85% | 4.10% |
| 06:00 | EUR | Germany PPI M/M Apr | -0.30% | -0.70% |
| 06:00 | EUR | Germany PPI Y/Y Apr | -0.20% | |
| 08:00 | EUR | Eurozone Current Account (EUR) Mar | 34.3B | |
| 12:30 | CAD | CPI M/M Apr | 0.30% | |
| 12:30 | CAD | CPI Y/Y Apr | 1.60% | 2.30% |
| 12:30 | CAD | CPI Median Y/Y Apr | 2.90% | 2.90% |
| 12:30 | CAD | CPI Trimmed Y/Y Apr | 2.90% | 2.80% |
| 12:30 | CAD | CPI Common Y/Y Apr | 2.40% | 2.30% |
| 22:45 | NZD | Trade Balance (NZD) Apr | 500M | 970M |
| 23:50 | JPY | Trade Balance (JPY) Apr | -0.19T | -0.23T |
| GMT | Ccy | Events | |
|---|---|---|---|
| 01:15 | CNY | 1-Y Loan Prime Rate | |
| Forecast: | Previous: 3.10% | ||
| 04:30 | CNY | 5-Y Loan Prime Rate | |
| Forecast: | Previous: 3.60% | ||
| 04:30 | AUD | RBA Interest Rate Decision | |
| Forecast: 3.85% | Previous: 4.10% | ||
| 06:00 | EUR | Germany PPI M/M Apr | |
| Forecast: -0.30% | Previous: -0.70% | ||
| 06:00 | EUR | Germany PPI Y/Y Apr | |
| Forecast: | Previous: -0.20% | ||
| 08:00 | EUR | Eurozone Current Account (EUR) Mar | |
| Forecast: | Previous: 34.3B | ||
| 12:30 | CAD | CPI M/M Apr | |
| Forecast: | Previous: 0.30% | ||
| 12:30 | CAD | CPI Y/Y Apr | |
| Forecast: 1.60% | Previous: 2.30% | ||
| 12:30 | CAD | CPI Median Y/Y Apr | |
| Forecast: 2.90% | Previous: 2.90% | ||
| 12:30 | CAD | CPI Trimmed Y/Y Apr | |
| Forecast: 2.90% | Previous: 2.80% | ||
| 12:30 | CAD | CPI Common Y/Y Apr | |
| Forecast: 2.40% | Previous: 2.30% | ||
| 22:45 | NZD | Trade Balance (NZD) Apr | |
| Forecast: 500M | Previous: 970M | ||
| 23:50 | JPY | Trade Balance (JPY) Apr | |
| Forecast: -0.19T | Previous: -0.23T | ||
Wednesday, May 21, 2025
| GMT | Ccy | Events | Consensus | Previous |
|---|---|---|---|---|
| 01:00 | AUD | Westpac Leading Index M/M Apr | -0.11% | |
| 06:00 | GBP | CPI M/M Apr | 0.30% | |
| 06:00 | GBP | CPI Y/Y Apr | 3.30% | 2.60% |
| 06:00 | GBP | Core CPI Y/Y Apr | 3.60% | 3.40% |
| 06:00 | GBP | RPI M/M Apr | 0.30% | |
| 06:00 | GBP | RPI Y/Y Apr | 4.20% | 3.20% |
| 12:30 | CAD | New Housing Price Index M/M Apr | 0.10% | 0.00% |
| 14:30 | USD | Crude Oil Inventories | 3.5M | |
| 23:00 | AUD | Manufacturing PMI May P | 51.7 | |
| 23:00 | AUD | Services PMI May P | 51 | |
| 23:50 | JPY | Machinery Orders M/M Mar | -1.60% | 4.30% |
| GMT | Ccy | Events | |
|---|---|---|---|
| 01:00 | AUD | Westpac Leading Index M/M Apr | |
| Forecast: | Previous: -0.11% | ||
| 06:00 | GBP | CPI M/M Apr | |
| Forecast: | Previous: 0.30% | ||
| 06:00 | GBP | CPI Y/Y Apr | |
| Forecast: 3.30% | Previous: 2.60% | ||
| 06:00 | GBP | Core CPI Y/Y Apr | |
| Forecast: 3.60% | Previous: 3.40% | ||
| 06:00 | GBP | RPI M/M Apr | |
| Forecast: | Previous: 0.30% | ||
| 06:00 | GBP | RPI Y/Y Apr | |
| Forecast: 4.20% | Previous: 3.20% | ||
| 12:30 | CAD | New Housing Price Index M/M Apr | |
| Forecast: 0.10% | Previous: 0.00% | ||
| 14:30 | USD | Crude Oil Inventories | |
| Forecast: | Previous: 3.5M | ||
| 23:00 | AUD | Manufacturing PMI May P | |
| Forecast: | Previous: 51.7 | ||
| 23:00 | AUD | Services PMI May P | |
| Forecast: | Previous: 51 | ||
| 23:50 | JPY | Machinery Orders M/M Mar | |
| Forecast: -1.60% | Previous: 4.30% | ||
Thursday, May 22, 2025
| GMT | Ccy | Events | Consensus | Previous |
|---|---|---|---|---|
| 00:30 | JPY | Manufacturing PMI May P | 48.7 | |
| 00:30 | JPY | Services PMI May P | 52.4 | |
| 06:00 | GBP | Public Sector Net Borrowing (GBP) Apr | 17.7B | 16.4B |
| 07:15 | EUR | France Manufacturing PMI May P | 48.9 | 48.7 |
| 07:15 | EUR | France Services PMI May P | 47.7 | 47.3 |
| 07:30 | EUR | Germany Manufacturing PMI May P | 49 | 48.4 |
| 07:30 | EUR | Germany Services PMI May P | 49.5 | 49 |
| 08:00 | EUR | Eurozone Manufacturing PMI May P | 49.4 | 49 |
| 08:00 | EUR | Eurozone Services PMI May P | 50.4 | 50.1 |
| 08:00 | EUR | Germany IFO Expectations May | 88.3 | 87.4 |
| 08:00 | EUR | Germany IFO Current Assessment May | 87 | 86.4 |
| 08:00 | EUR | Germany IFO Business Climate May | 87.7 | 86.9 |
| 08:30 | GBP | Manufacturing PMI May P | 46.2 | 45.4 |
| 08:30 | GBP | Services PMI May P | 50 | 49 |
| 11:30 | EUR | ECB Meeting Accounts | ||
| 12:30 | CAD | Industrial Product Price M/M Apr | 0.50% | |
| 12:30 | CAD | Raw Material Price Index Apr | -1% | |
| 12:30 | USD | Initial Jobless Claims (May 16) | 227K | 229K |
| 13:45 | USD | Manufacturing PMI May P | 50.2 | |
| 13:45 | USD | Services PMI May P | 50.8 | |
| 14:00 | USD | Existing Home Sales M/M Apr | 4.10M | 4.02M |
| 14:00 | USD | Existing Home Sales Change M/M Apr | -5.90% | |
| 14:30 | USD | Natural Gas Storage | 110B | |
| 22:45 | NZD | Retail Sales Q/Q Q1 | 0.00% | 0.90% |
| 22:45 | NZD | Retail Sales ex Autos Q/Q Q1 | 1.50% | 1.40% |
| 23:01 | GBP | GfK Consumer Confidence May | -22 | -23 |
| 23:30 | JPY | National CPI Y/Y Apr | 3.60% | |
| 23:30 | JPY | National CPI Core Y/Y Apr | 3.40% | 3.20% |
| 23:30 | JPY | National CPI Core-Core Y/Y Apr | 2.90% |
| GMT | Ccy | Events | |
|---|---|---|---|
| 00:30 | JPY | Manufacturing PMI May P | |
| Forecast: | Previous: 48.7 | ||
| 00:30 | JPY | Services PMI May P | |
| Forecast: | Previous: 52.4 | ||
| 06:00 | GBP | Public Sector Net Borrowing (GBP) Apr | |
| Forecast: 17.7B | Previous: 16.4B | ||
| 07:15 | EUR | France Manufacturing PMI May P | |
| Forecast: 48.9 | Previous: 48.7 | ||
| 07:15 | EUR | France Services PMI May P | |
| Forecast: 47.7 | Previous: 47.3 | ||
| 07:30 | EUR | Germany Manufacturing PMI May P | |
| Forecast: 49 | Previous: 48.4 | ||
| 07:30 | EUR | Germany Services PMI May P | |
| Forecast: 49.5 | Previous: 49 | ||
| 08:00 | EUR | Eurozone Manufacturing PMI May P | |
| Forecast: 49.4 | Previous: 49 | ||
| 08:00 | EUR | Eurozone Services PMI May P | |
| Forecast: 50.4 | Previous: 50.1 | ||
| 08:00 | EUR | Germany IFO Expectations May | |
| Forecast: 88.3 | Previous: 87.4 | ||
| 08:00 | EUR | Germany IFO Current Assessment May | |
| Forecast: 87 | Previous: 86.4 | ||
| 08:00 | EUR | Germany IFO Business Climate May | |
| Forecast: 87.7 | Previous: 86.9 | ||
| 08:30 | GBP | Manufacturing PMI May P | |
| Forecast: 46.2 | Previous: 45.4 | ||
| 08:30 | GBP | Services PMI May P | |
| Forecast: 50 | Previous: 49 | ||
| 11:30 | EUR | ECB Meeting Accounts | |
| Forecast: | Previous: | ||
| 12:30 | CAD | Industrial Product Price M/M Apr | |
| Forecast: | Previous: 0.50% | ||
| 12:30 | CAD | Raw Material Price Index Apr | |
| Forecast: | Previous: -1% | ||
| 12:30 | USD | Initial Jobless Claims (May 16) | |
| Forecast: 227K | Previous: 229K | ||
| 13:45 | USD | Manufacturing PMI May P | |
| Forecast: | Previous: 50.2 | ||
| 13:45 | USD | Services PMI May P | |
| Forecast: | Previous: 50.8 | ||
| 14:00 | USD | Existing Home Sales M/M Apr | |
| Forecast: 4.10M | Previous: 4.02M | ||
| 14:00 | USD | Existing Home Sales Change M/M Apr | |
| Forecast: | Previous: -5.90% | ||
| 14:30 | USD | Natural Gas Storage | |
| Forecast: | Previous: 110B | ||
| 22:45 | NZD | Retail Sales Q/Q Q1 | |
| Forecast: 0.00% | Previous: 0.90% | ||
| 22:45 | NZD | Retail Sales ex Autos Q/Q Q1 | |
| Forecast: 1.50% | Previous: 1.40% | ||
| 23:01 | GBP | GfK Consumer Confidence May | |
| Forecast: -22 | Previous: -23 | ||
| 23:30 | JPY | National CPI Y/Y Apr | |
| Forecast: | Previous: 3.60% | ||
| 23:30 | JPY | National CPI Core Y/Y Apr | |
| Forecast: 3.40% | Previous: 3.20% | ||
| 23:30 | JPY | National CPI Core-Core Y/Y Apr | |
| Forecast: | Previous: 2.90% | ||
Friday, May 23, 2025
| GMT | Ccy | Events | Consensus | Previous |
|---|---|---|---|---|
| 06:00 | EUR | Germany GDP Q/Q Q1 F | 0.20% | 0.20% |
| 06:00 | GBP | Retail Sales M/M Apr | 0.40% | 0.40% |
| 12:30 | CAD | Retail Sales M/M Mar | -0.30% | -0.40% |
| 12:30 | CAD | Retail Sales ex Autos M/M Mar | 0.20% | 0.50% |
| 14:00 | USD | New Home Sales M/M Apr | 696K | 724K |
| GMT | Ccy | Events | |
|---|---|---|---|
| 06:00 | EUR | Germany GDP Q/Q Q1 F | |
| Forecast: 0.20% | Previous: 0.20% | ||
| 06:00 | GBP | Retail Sales M/M Apr | |
| Forecast: 0.40% | Previous: 0.40% | ||
| 12:30 | CAD | Retail Sales M/M Mar | |
| Forecast: -0.30% | Previous: -0.40% | ||
| 12:30 | CAD | Retail Sales ex Autos M/M Mar | |
| Forecast: 0.20% | Previous: 0.50% | ||
| 14:00 | USD | New Home Sales M/M Apr | |
| Forecast: 696K | Previous: 724K | ||
Markets Weekly Outlook – RBA, PBoC Decisions and UK Inflation in Focus
Week in Review: Optimism Begins to Fade as Consumer Sentiment Deteriorates
Wall Street's main indexes were set to end the week on a high note, thanks to a temporary truce in the U.S.-China trade war. The S&P 500 was on track for its fifth straight daily gain, with all three major indexes showing weekly growth.
Stocks bounced back earlier in the week, with strong rallies on Monday and Tuesday after the U.S. and China agreed to pause their trade war for 90 days.
This pushed the S&P 500 back into positive territory for the year, the first time since late February. However, it’s still about 4% below its all-time high.
However, sentiment has suffered toward the backend of the week thanks in part to US data. Thursday's data was PPI, Retail Sales and the NFIB small business optimism index and these revealed some concerns which have weighed slightly on overall sentiment ahead of the weekend.
The biggest concern came from small businesses, who are getting more pessimistic about the economy.
The NFIB Small Business Optimism Index declined 1.6 points in April, to 95.8, its lowest since October 2024. 6 of the 10 index components decreased, with expected business conditions having the most negative contribution.Over the last 4 months, the index has fallen 9.3 points, the sharpest drop since the 2020 pandemic.
At the same time, the share of small firms expecting better business conditions 6 months from now has plummeted 37 percentage points, to 15%, the lowest since October 2024.
The mood remained sour after Friday's release of the University Of Michigan Consumer Sentiment Preliminary Data, which showed the index dropped sharply to 50.8 in May 2025, down from 52.2 in April and much lower than the expected 53.4, based on early estimates. This is the fifth monthly drop in a row, the lowest since June 2022, and the second-lowest ever recorded.
Rising inflation worries and concerns about tariffs are hurting confidence. Both the current conditions index (57.6 vs 59.8) and future expectations (46.5 vs 47.3) got worse. Personal finances took a big hit, falling nearly 10% due to weaker incomes. Nearly 75% of consumers mentioned tariffs as a concern, up from 60% in April, showing trade policy uncertainty is a major worry.
Inflation expectations for the next year jumped to 7.3%, the highest since 1981, up from 6.5%, while long-term inflation expectations also rose slightly to 4.6% from 4.4%.
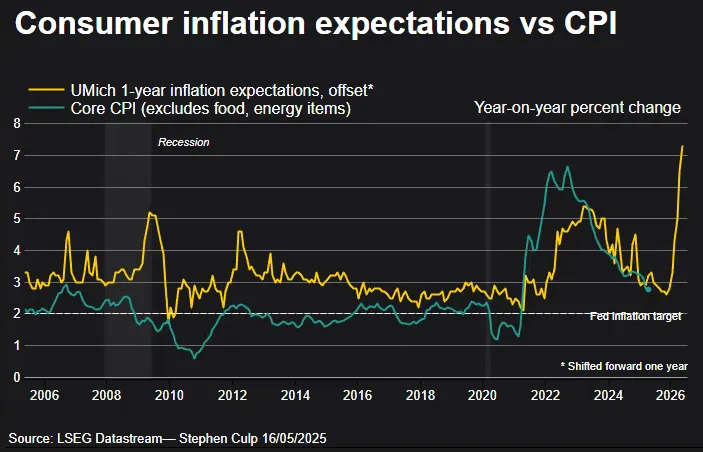
Source: LSEG
The consumer sentiment data has definitely dampened the mood heading into the weekend. However, the mood remains optimistic for now but if data in the week and weeks ahead continue to deteriorate even trade deals may not be enough to lift optimism around a potential global slowdown.
The Week Ahead: Central Banks in Asia Pacific and UK Inflation on Deck
The week ahead has several important data releases lined up. The US gets a bit of a data break in the week ahead with Europe and the UK taking center stage. We will also have a busy week in the Asia Pacific region where the data dump for China begins
Asia Pacific Markets Outlook
The Reserve Bank of Australia (RBA) is expected to lower its cash rate by 0.25% to 3.85%. While April's inflation numbers were higher than expected, core inflation, which the RBA focuses on dropped to 2.9% year-on-year. This is the first time since 2021 that core inflation is within the RBA's target range.
China's April economic data kicks off on Monday. Retail sales are expected to grow to 6.3% from 5.9% last year, showing stronger domestic demand. Fixed-asset investment should stay steady, rising slightly to 4.3%. Industrial production may slow to 6.0% from 7.7%, as earlier PMI and trade data hinted at a mild slowdown. Property prices in 70 cities, also out Monday, will reveal if the market has hit bottom, with some cities stabilizing or seeing slight increases, though overall prices remain negative. On Tuesday, banks are likely to cut 1-year and 5-year loan rates by 0.10%, following a recent rate cut by the central bank.
Japan's data is expected to weaken, as US tariffs impact exports and manufacturing. Flash manufacturing PMI is likely to drop. Exports should grow by 2.5% in April compared to last year, but slower than March. Strong exports to Asia will help offset the drop in US exports. A big fall in imports should keep the trade surplus intact. Meanwhile, core inflation is expected to rise sharply in April, driven mainly by higher service prices.
Europe, US and UK Market Outlook
With 30-year mortgage rates stuck just below 7% and the average home loan at $450,000, monthly payments are nearly $3,000. This highlights how unaffordable the US housing market has become, leading to very low mortgage applications. Recent financial market volatility has made buyers even more hesitant, which explains why home builders are feeling so down. This is reflected in the sharp drop in the NAHB sentiment index in May. All of this suggests that sales of new and existing homes will remain very slow in the next batch of data.
In the Euro Area, the economy hasn’t shown major problems from the trade war. April’s manufacturing data was surprisingly strong, likely boosted by businesses rushing to act before US tariffs hit. May’s data will reveal if the sector can handle global challenges. I am not too optimistic but I do admit, I am a fan of surprises.
Consumer confidence will be key following the revelations from US consumer confidence data this past week. Consumer confidence has dropped a lot recently, meaning people are less likely to spend the extra money they’re earning from higher wages. However, if people start worrying less about the global economy, we might see stronger spending at home.
We also have the EU-UK summit which kicks off on Monday is mainly about agreeing on a defence partnership, but the UK also wants to make progress on economic issues. The UK is pushing for an agreement on food standards to reduce border checks. However, disagreements over migration and fishing are making it harder to improve economic ties.
April’s inflation data is important because many service prices go up annually during this time. In the past, this data has often been higher than expected. However, we think services inflation will be lower than the Bank of England’s 5% forecast. If we’re right, it might not lead to a rate cut in June, but it could make one more likely in August.
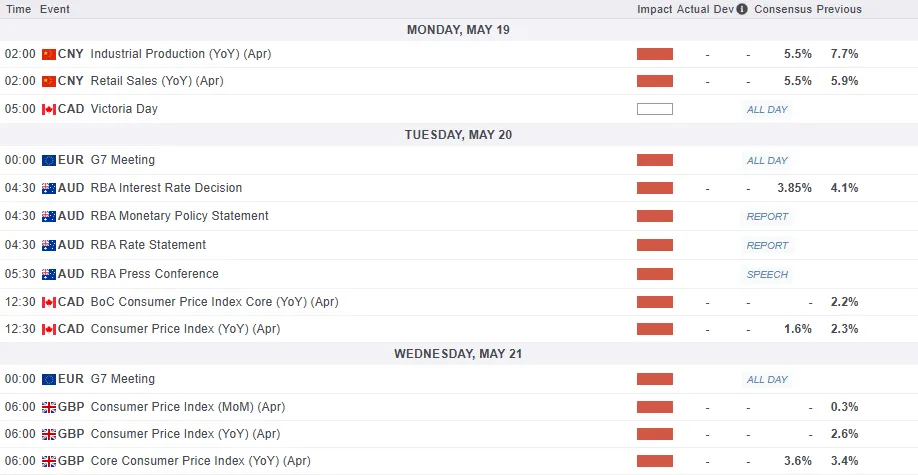
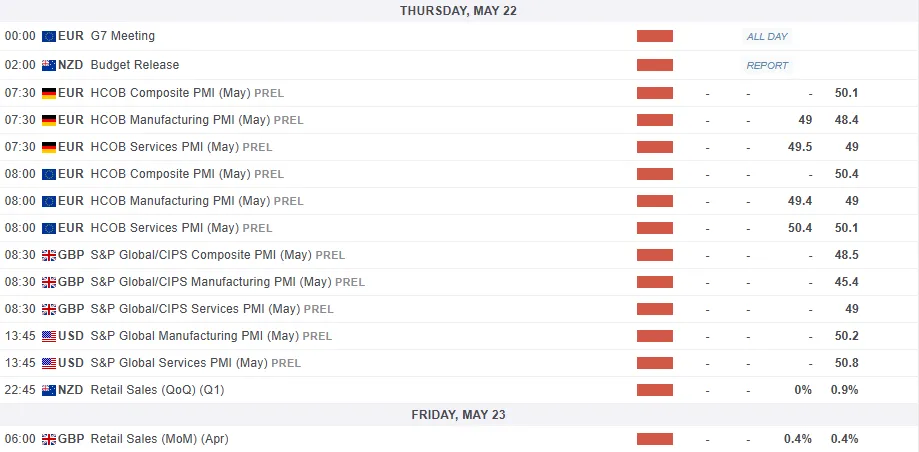
For all market-moving economic releases and events, see the MarketPulse Economic Calendar. (click to enlarge)
Chart of the Week - US Dollar Index (DXY)
This week's focus remains on the US Dollar Index.
The index has struggled to build on Mondays impressive gains following the US - China 90-day pause.
US data did little to assist the greenback this week as it toiled around resistance at 101.18 since Wednesday.
The index is on course to close the week with marginal gains and the trendline breakout still supports the idea of a move higher.
This is coupled with the period-14 RSI holding above the 50 neutral level which is a seen as a sign of bullish momentum still being in play.
The lack of data next week means the DXY may need another catalyst if the bulls are to take control. there has been rumors of potential trade deal announcements coming soon.
This could be the push the index needs right now for bulls to really make a serious push to the upside.
US Dollar Index (DXY) Daily Chart - May 16, 2025
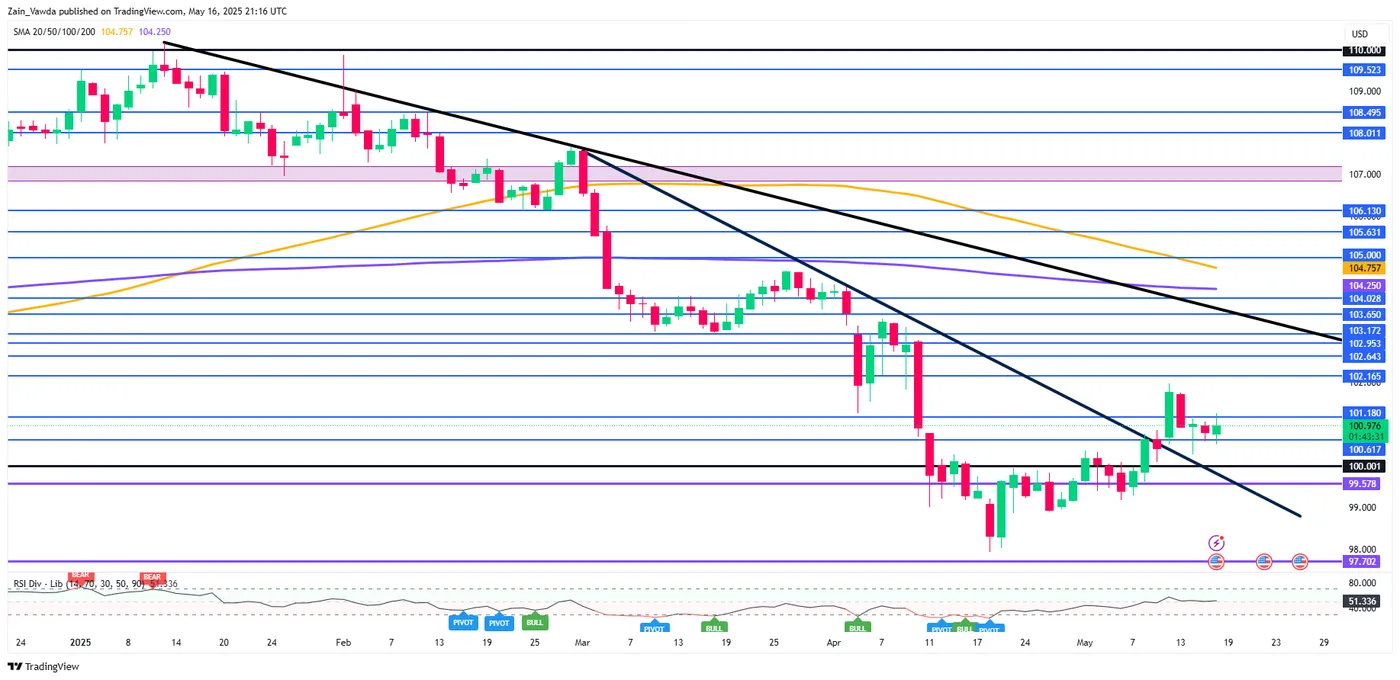
Source: TradingView.Com (click to enlarge)
Key Levels to Consider:
Support
- 100.61
- 100.00
- 100.00
Resistance
- 101.18
- 102.16
- 102.64
The Weekly Bottom Line: Trade Tensions with China Simmer Down
Canadian Highlights
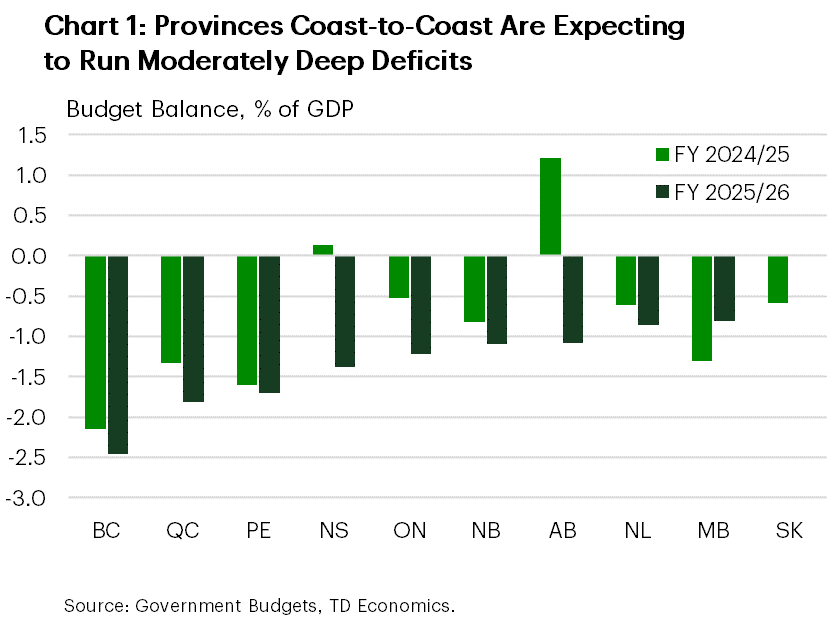
- The Federal government is foregoing its usual spring Budget, but is pushing forward with election promises. The Ontario government expects to run a deeper FY 2025/26 deficit as economic relief clashes with a softening revenue outlook.
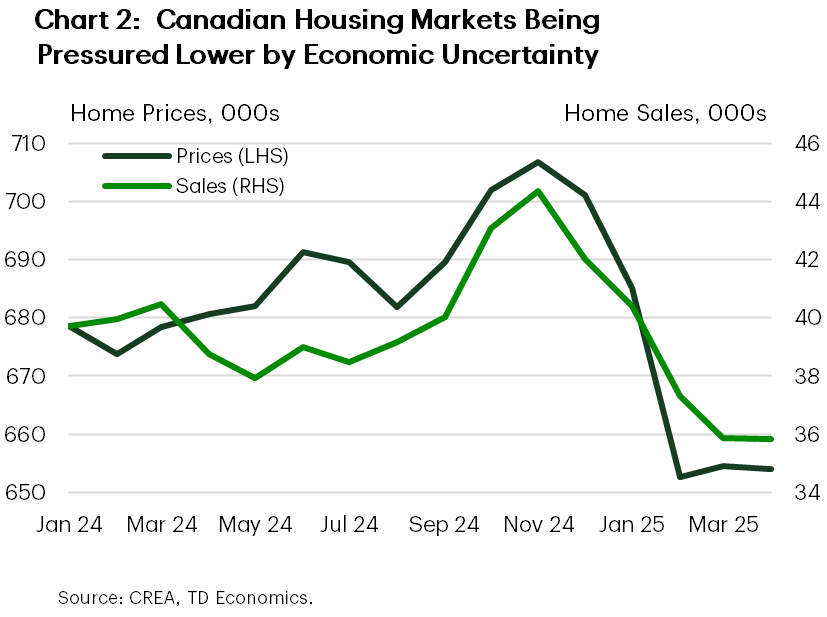
- Canada’s housing market remained subdued in April as weak consumer confidence weighs on sales activity.
- Inflation updates for April next week will be a key marker for the Bank of Canada’s policy decision on June 4th. We expect a print on the softer side before tariff impacts start to embed in prices.
U.S. Highlights
- U.S.-China trade tensions were toned down this week, with both countries agreeing to a temporary truce that would see some tariffs on each other’s goods come down substantially.
- Following a strong showing in March, retail sales barely grew in April. The details hinted at consumer efforts to get ahead of potential tariff-related price hikes.
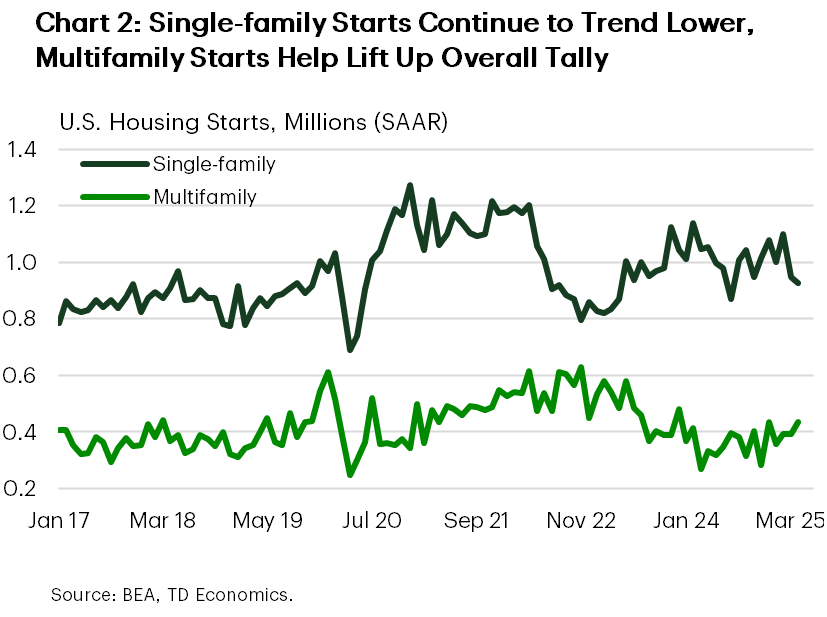
- Housing starts managed to eke out some modest growth in April, but the gain was entirely concentrated in the smaller and more volatile multifamily sector.
Canada – Budgets, And Lack Thereof
Canadian governments were in the spotlight this week amid a relatively light calendar for Canadian economic data. Volatility in Canadian financial markets also scaled back this week, mostly taking cues from developments south of the border. Canadian yields finished the week roughly flat, the TSX rallied by 1.5%, and the Loonie dipped three-tenths of a cent to 0.716 cents/USD.
On the federal government side, Prime Minister Mark Carney and his new cabinet hit the ground running, signing a symbolic order to prioritize their promised income tax cut by July 1st. This measure is part of a much larger Liberal election platform that includes $130 billion in new spending measures over the next four years. By the government’s own preliminary tally, the spending will drive the projected budget deficit and debt burden higher in the near-term. That said, the government announced that they will forgo publishing an official federal budget this year. This means we’ll need to wait until the Fall Economic Statement, usually tabled between October and December, to understand the exact impacts on the country’s bottom line.
Meanwhile, Ontario released its FY 2025/26 Budget, officially wrapping up the provincial budget season. New measures related to tariff relief and broader economic support, combined with a contraction in near-term revenues, are expected to put the province’s books into a $14.6 billion deficit for the fiscal year (see analysis). Relative to the size of the economy, Ontario’s projected deficit is in line with those reported by most provinces across the nation (Chart 1). Ontario and Manitoba also signed a Memorandum of Understanding (MOU) supporting the removal of barriers to trade between their two provinces.
Shifting to the hard economic data, Canada’s housing markets continue to show signs of weakness (Chart 2). Existing home sales in April failed to generate any traction as economic uncertainty likely kept buyers on the sidelines despite lower interest rates. With the data we have on hand, we’re tracking another decline in Canadian home sales in Q2 following a sizeable first quarter contraction. The weakness is expected to be temporary. Ample pent-up demand exists and we expect it to start funneling back into markets by the fourth quarter as there is more certainty on the trade front, and homebuyers regain confidence and clarity. Elsewhere, housing starts bounced back in a meaningful way in April after steep declines in the two months prior, though they continue to soften on a trend basis. Ontario, in particular, stands out as construction responds to the past declines in demand.
On tap next week is April’s update on inflation. The print could show stable and easing price growth as the elimination of the consumer carbon tax has pushed energy prices significantly lower. Past this, we expect tariff impacts may start nudging inflation back towards 3% starting in May/June. The Bank of Canada (BoC) is waiting in the wings to make their next policy decision on June 4th and the economic evidence is increasingly painting a picture of a slowing Canadian economy. From our lens, the current situation gives the BoC room to deliver another quarter-point cut to the policy rate at the June announcement.
U.S. – Trade Tensions with China Simmer Down
Following the U.K. trade deal signed last week, the U.S. de-escalated its tariff fight with another key trade partner this week – China. Stock markets rejoiced on the news with the S&P 500 up almost 5% this week.
The U.S. and China announced a temporary truce, which would see both nations significantly reduce their tariffs for 90 days, effective May 14th. U.S. tariffs on China would drop from 145% to 30%, while Chinese tariffs on U.S. goods would fall from 125% to 10%. China also agreed to ease its critical minerals export restrictions. This development marks a major step in the right direction. Still, it is early days in negotiations and there’s potential for trade tensions to flare up again should an agreement prove elusive. Additionally, some of the damage is already done, with elevated tariffs that were kept on for several weeks already disrupting trade patterns and setting the stage for potential price hikes ahead. Recognizing these risks, at a speech this week Fed Chair Powell noted that “we may be entering a period of more frequent, and potentially more persistent, supply shocks – a difficult challenge for the economy and for central banks”.
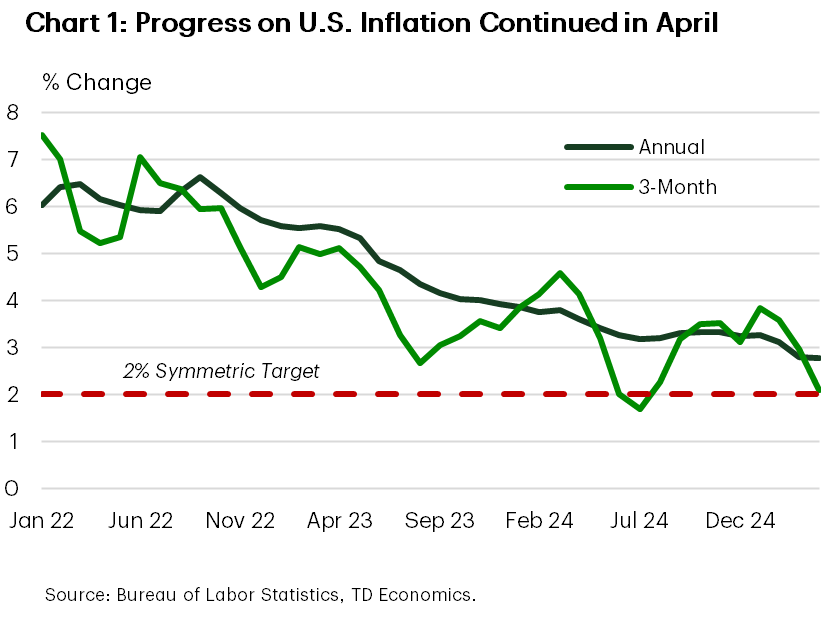
Up until April, inflation appeared to be moving in the right direction. Helped by a reduction in energy prices, total CPI inflation eased to 2.3% year-on-year (y/y) in April – the lowest level since 2021. Meanwhile, core CPI held steady at 2.8% y/y, but managed to trend lower on a 3-month annualized basis (Chart 1). Still, this trend is unlikely to last. Citing pressure from tariffs, Walmart announced plans to start passing on tariff costs as early as this month. Other retailers are likely to follow, and consumers will soon start to feel the heat.
With respect to the consumer, following a strong finish to the first quarter, retail sales grew only modestly in April. Sales at motor vehicle and parts dealers edged lower (albeit from an elevated level), while sales at gasoline stations fell more noticeably in part due to lower gas prices. Despite this, a decent showing in a few other categories, including bars and restaurants, and building material stores helped provide some counterbalance.
Pulling back the lens, last month’s retail spending data provided further evidence that consumers continued to front-run the tariffs by pulling forward purchases of some big ticket items. Meanwhile, ongoing gains in discretionary spending suggest that the consumer is managing to hold its own for now, despite downbeat sentiment. Housing starts also managed to eke out some modest growth in April (up 1.6% on the month), but under the hood, the details were mixed. Starts in the larger single-family sector continued to trend lower, with last month’s increase entirely stemming from gains in the smaller and more volatile multifamily segment (Chart 2).
All told, the de-escalation in the trade fight with China marks an important step in the right direction, and there could be more on the way, with President Trump today hinting at the potential for further de-escalation with other countries over the next 2-3 weeks. Still, this does not rule out additional flareups, and we are far from being out of the woods.