Sample Category Title
Weekly Economic & Financial Commentary: Sentiment Is Cratering but Hard Data Signal Only a Stalling
Summary
United States: Sentiment Is Cratering but Hard Data Signal Only a Stalling
- The 90-day pause with China cheered financial markets, but economic data showed early indications of the economic impact of tariffs. Retail sales held up OK and industrial production was flat, but small business confidence optimism faded. Consumer sentiment plunged to the second lowest on record amid inflation worries.
- Next week: Existing Home Sales (Thu.), New Home Sales (Fri.)
International: Foreign Economies Start 2025 on Surprisingly Solid Note
- This week brought a wave of economic data from both advanced and emerging economies, with several upside surprises on the growth front. The United Kingdom, Norway and Switzerland all posted stronger-than-expected first quarter growth figures, reflecting pockets of resilience despite broader global uncertainty. Japan was the notable outlier, with GDP contracting more than expected. On the emerging economy side, India’s softer-than-expected inflation print was reassuring. Meanwhile, Mexico's central bank lowered its policy rate by 50 bps to 8.50% and signaled further easing to come.
- Next week: China Industrial Production and Retail Sales (Mon.), Reserve Bank of Australia Policy Rate (Tue.), Eurozone PMIs (Thu.)
Credit Market Insights: Here to Collect: Student Loan Delinquencies Surge in Q1
- The Federal Reserve Bank of New York released an update to its Quarterly Report on Household Debt and Credit this week, which included data through Q1-2025. Rising delinquencies point to some modest strain among consumers, and the resumption of student loan payments after almost five years of forbearance comes as the consumer is on somewhat shakier footing.
Topic of the Week: Commercial Real Estate on Stable Ground Before Liberation Day
- The CRE market started 2025 on a positive note. During Q1-2025, transaction volumes, property prices and lending activity all improved against a backdrop of slightly lower capital costs. On balance, vacancy rates across the major property types were lower or ticked only modestly higher, suggesting that the CRE market is on the way to finding balance after several challenging years.
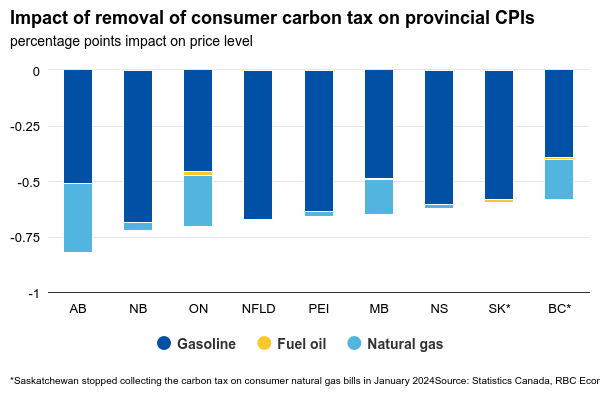
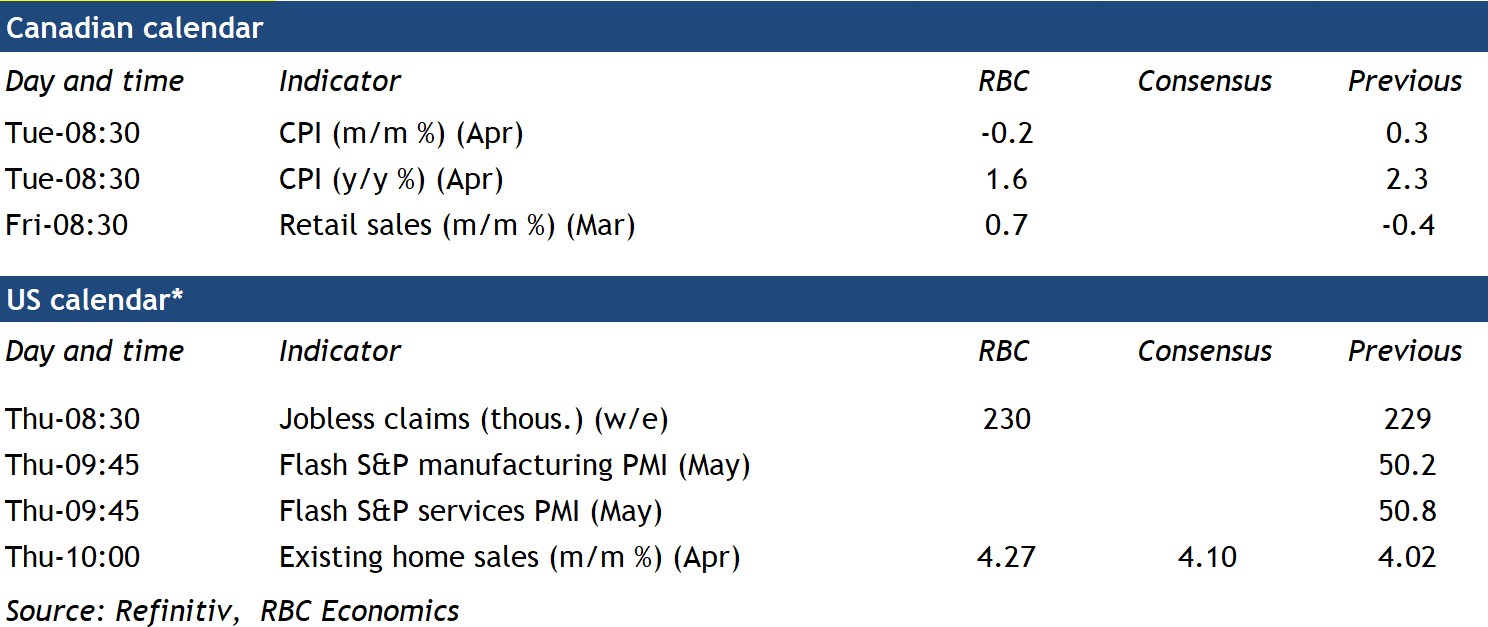
Canadian Inflation in April Likely Saw a Big Drop as the Carbon Tax Ended
April’s inflation reading for Canada on Tuesday will be distorted again by tax changes with the removal of the consumer carbon tax on energy products at the start of the month. This builds upon previous distortions caused by the federal GST tax break between December 2024 and February 2025.
We expect (after-tax) price growth in the Canadian consumer price index to drop to 1.6% in April from 2.3% in March, largely due to the removal of the carbon tax. Gasoline prices plummeted by 10% nationally in April from March, and we expect consumer natural gas prices plunged 27%.
The underlying inflation trend (controlling for the tax change) will be closely monitored after March data showed a moderate downside surprise, breaking a five-month streak of mostly upside surprises.
The April inflation data is unlikely to show significant pressure from import tariffs yet, and we expect import substitution to alternative sources and consumer substitution to non-tariffed products will ultimately limit the impact of Canadian retaliatory tariff measures on consumer prices (see issue in focus here).
Still, we expect food price growth to remain elevated at about 3.2% year-over-year in April like March. Core inflation (excluding food and energy) is projected to rise to 2.6% from 2.4%. Annual growth in the Bank of Canada’s preferred median and trim measures, which exclude the impact of tax changes, should hold steady, just under 3%.
March’s Canadian retail sales figures released next Friday will be closely watched for signs of shifting spending patterns driven by tariff anxieties. Statistics Canada’s advance indicator showed a 0.7% monthly increase, fully reversing February’s 0.4% decline. March’s upturn was largely powered by a surge in auto sales as consumers purchased vehicles ahead of anticipated tariffs. Auto sales pulled back in April, according to early industry reports, but our tracking of broader consumer spending trends remained resilient compared to consumer sentiment.
Week ahead data watch
Week Ahead – Fed Speakers, RBA Decision, UK CPI and Preliminary PMIs in Focus
- Strong dollar awaits Fed speakers and PMIs.
- RBA to cut by 25bps, focus to fall on forward guidance.
- Sticky UK inflation could mean only one more BoE rate cut.
- Eurozone PMIs, Canada’s and Japan’s CPI numbers also on tap.
US-China deal boosts investors’ appetite
Risk sentiment improved significantly this week, while the dollar strengthened, after trade negotiations between the US and China ended with unexpectedly substantial progress. The world’s two biggest economies agreed to lower tariffs by 115% for 90 days, which means that during that three-month truce period, China will charge US goods with a 10% rate, while the US will tax its Chinese imports at 30%.
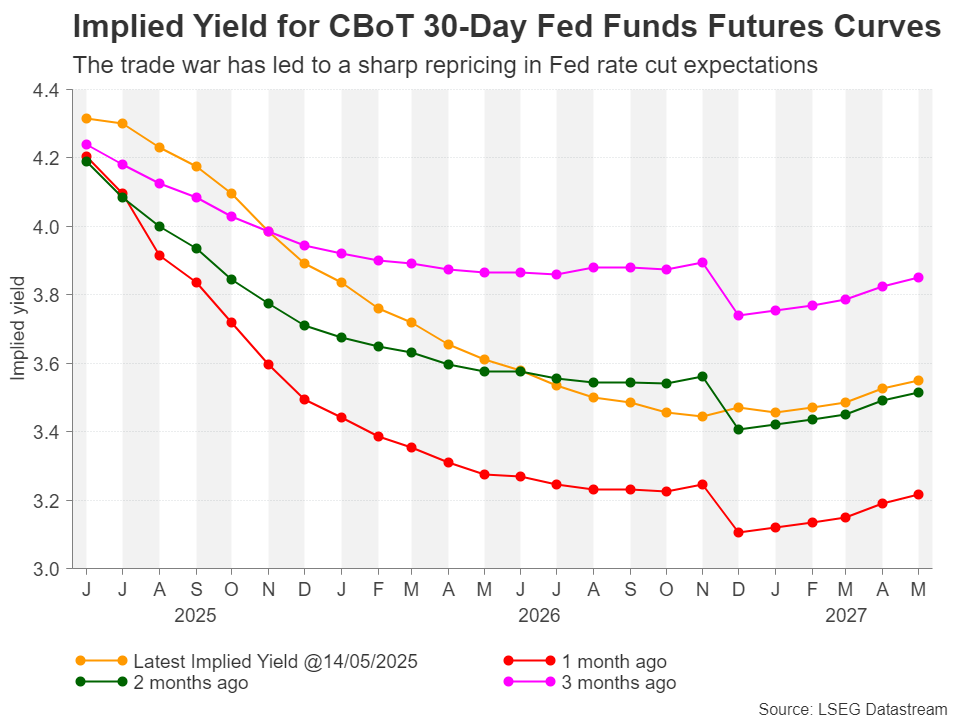
The better-than-expected accord significantly eased recession fears, with investors scaling back their Fed rate cut bets. From penciling in more than 100bps worth of reductions this year just after Trump’s ‘Liberation Day’, they are now expecting only 57, getting closer to the Fed’s latest ‘dot plot’, which pointed to 50bps worth of rate cuts by December.
Fed officials and US PMIs to shed light on Fed’s plans
Following this week’s CPI data, which revealed that underlying price pressures in the US remained sticky in April, next week, traders will monitor the preliminary PMIs for May on Thursday, but they may also pay attention to speeches by several Fed members as they may want to hear whether the Committee remains concerned about economic growth or whether they are more focused on the inflation outlook now the US has found some common ground with China.
Rising PMIs may suggest that sentiment among businesses has improved after the US-Sino deal, but investors may want to hear clear remarks about how the Fed is planning to move forward. Among the speakers will be New York Fed President John Williams, Atlanta Fed President Raphael Bostic, Dallas Fed President Lorie Logan, and San Francisco Fed President Mary Daly. If they remain concerned about the upside risks of inflation, the dollar could extend its gains as traders could price in even fewer rate cuts.
How the stock market may respond is not so crystal clear. We’ve seen equities gaining lately, even as market participants have been scaling back their rate cut expectations, mainly because the latest tariff-related developments have been easing anxiety regarding a recession. However, given that a recession is not so prominent now and a higher-for-longer rate narrative is based on concerns that inflation may prove to be hotter than expected, Wall Street may pull back should Fed officials highlight upside risks to inflation.
Will the RBA sound less dovish than expected
On Tuesday, the Reserve Bank of Australia (RBA) will hold its first monetary policy decision after Trump’s ‘Liberation Day’, as its prior meeting took place just the day before. Back then, the Bank kept interest rates unchanged, with Governor Bullock saying that no reduction was discussed as their top priority was inflation’s return to their target.
Since then, data showed that inflation was stickier than expected in Q1, but the overall uncertainty surrounding the global economic landscape due to Trump’s trade policies has led investors to pencil in around 80bps worth of reductions by the end of the year. For next week’s decision, a quarter-point reduction is nearly fully factored in.
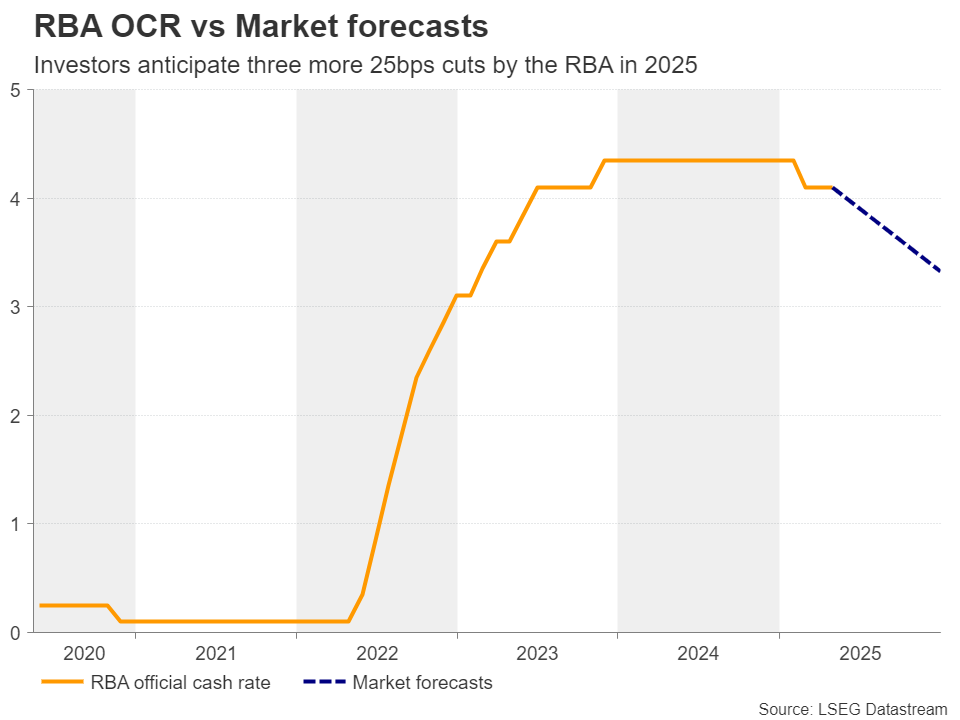
Therefore, a rate cut on its own is unlikely to be a strong driving force for the aussie. Traders may direct their attention to clues and hints about how policymakers are planning to move forward. With underlying inflation metrics near the upper bound of the Bank’s 2-3% target range and taking into account the US-Sino trade deal, policymakers are unlikely to corroborate the ultra-dovish market consensus.
Yes, the Bank will likely keep the door to further reductions open – after all inflation is within the target range – but there is no data justifying 80bps worth of rate cuts by the end of the year. Thus, a less-dovish-than-expected message may allow the aussie to gain some more ground.
Ahead of the RBA decision, aussie traders may cast a glance at China’s data, due out on Monday. Industrial production, fixed asset investment and retail sales, all for April, will be released. That said, given that the data will refer to a period before the latest US-China trade deal, when tariffs were above 100%, investors may not take the numbers at face value and thus, any market impact may be limited and short-lived.
Hot UK CPI could mean only one more BoE cut
In the UK, the CPI data for April, the preliminary PMIs for May, and retail sales for April will come out on Wednesday, Thursday and Friday, respectively. On May 8, BoE officials decided to cut interest rates by 25bps, but the decision was far from unanimous. Five members supported the quarter-point cut, while two voted for a bigger 50bps decrease and another two for keeping rates steady.
The BoE said that tariffs could weigh on economic growth, but the outlook was still unclear. “That’s why we need to stick to a gradual and careful approach to further rate cuts,” Governor Andrew Bailey noted. Coming hot on the heels of the US-UK accord, the less-dovish-than expected outcome prompted investors to reduce the amount of rate cuts expected by the BoE this year from 75 to currently 45 basis points.
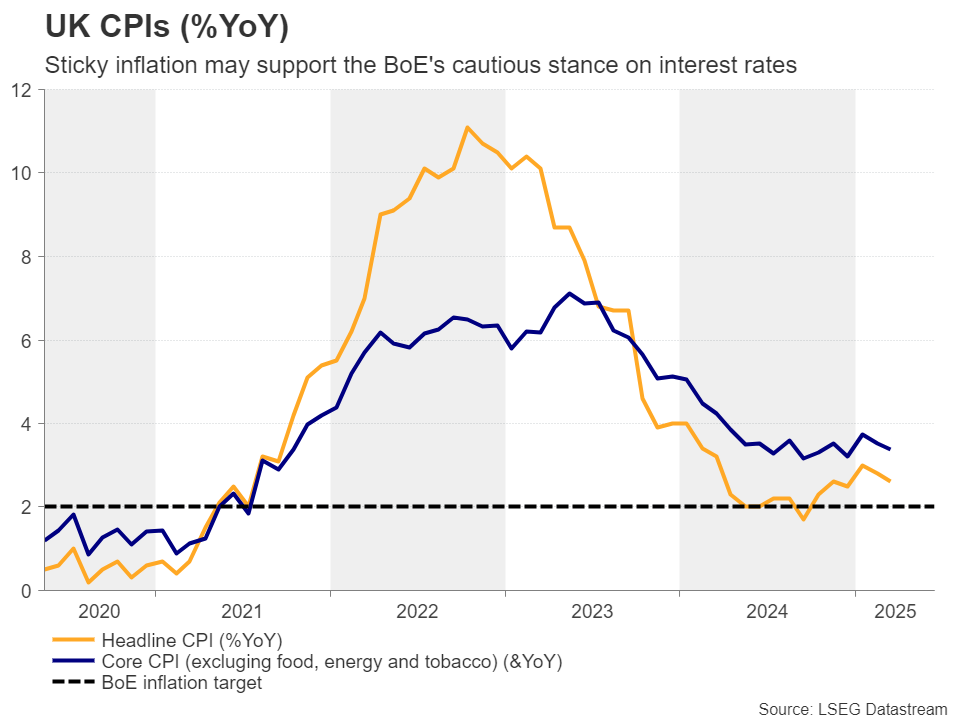
So, should the data point to sticky inflation, improving PMIs, and robust retail sales, investors may become more convinced that only a single quarter-point cut remains in the Bank’s chamber, which could propel the pound higher.
Eurozone PMIs, Canadian and Japanese CPI inflation
Besides the US and the UK preliminary PMI data, Thursday’s agenda includes the Eurozone numbers as well. After cutting interest rates by 25bps at its previous meeting and warning that economic growth will take a big hit from US tariffs, the ECB is widely anticipated to cut by another 25bps in June, but only one more reduction is priced in for the remainder of the year.
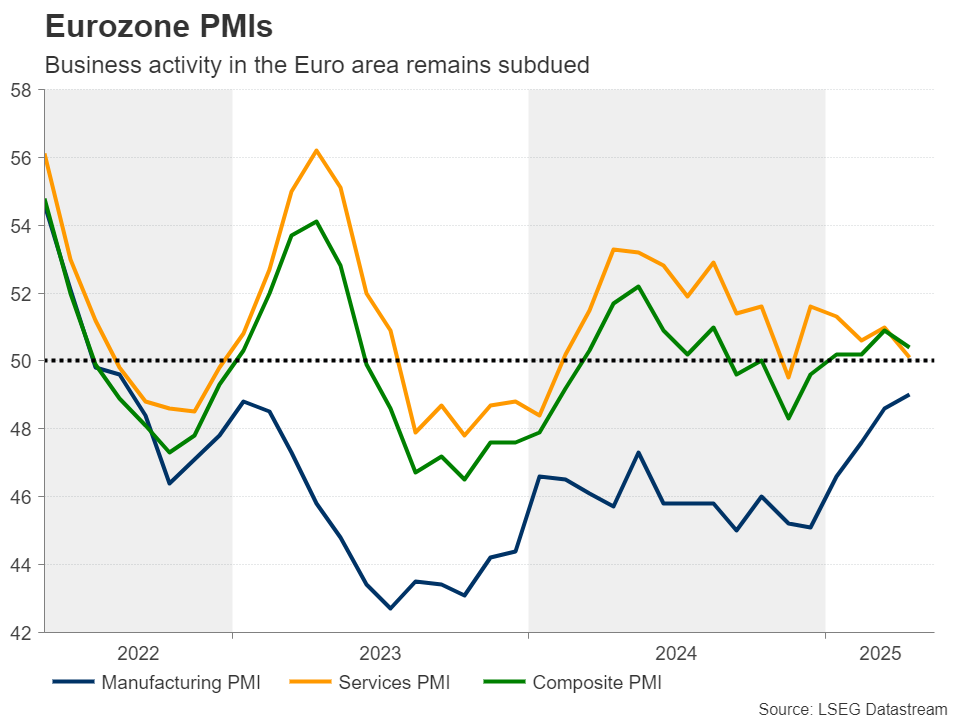
This may be due to the improving global trade environment, especially after the US-Sino deal, and due to recent remarks by ECB member Isabel Schnabel that interest rates should remain close to current levels. Therefore, a round of improving PMIs could corroborate Schnabel's view and add extra support to the euro.
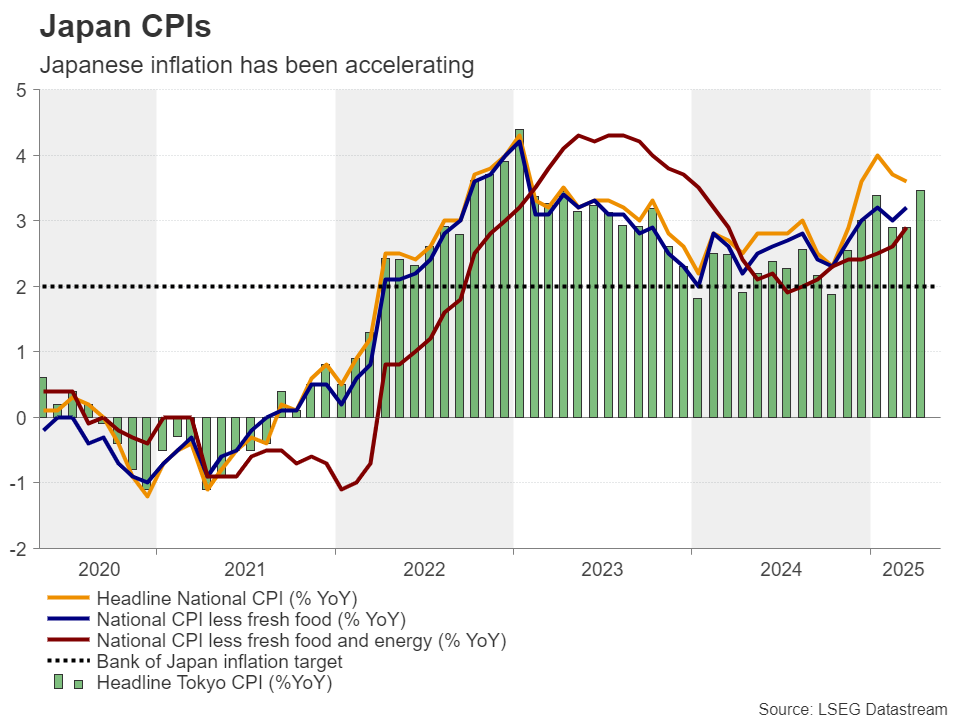
Canada and Japan also release their April CPI reports on Tuesday and Friday, respectively. The Bank of Canada remained on hold back in April, its first pause after seven consecutive cuts, adding that they remain ready to act if needed. With the jobs market losing around 33k jobs in March and failing to recover in April, the unemployment rate rose to 6.9% from 6.7%, prompting market participants to assign a 65% chance of another 25bps reduction at the June gathering. With the CPI already within the Bank’s 1-3% target range, further slowdown in consumer prices could solidify the case of a June rate cut and thereby weigh on the loonie.
As for the BoJ, its latest decision was less dovish than expected but still, investors are assigning a decent 70% chance of another quarter-point hike by the end of the year. Although the economy contracted in the first quarter, the Tokyo CPI figures for April accelerated strongly, suggesting that the National prints could move in a similar fashion and thereby add more credence to the case of another rate hike by the BoJ in 2025.
US-China Trade Truce: A Genuine Breakthrough or a False Hope?
- US and China agree to lower tariffs for 90 days as tensions take toll.
- But what are the prospects for a permanent deal?
- Markets are unsure if this is a true turning point.
Boiling point
The trade war between the United States and the rest of the world reached a boiling point in April after President Trump unveiled reciprocal tariffs that were far greater than what anyone was expecting and as he flagged a new round of sectoral tariffs. The response by other countries varied, with many, like Australia, Japan and the United Kingdom, deciding not to retaliate. But others, such as the European Union and China, have not held back in responding with some counter measures.
China’s response has been the most aggressive, likely taking the White House by surprise. As expected, though, the tit-for-tat retaliation only infuriated Trump, escalating into a full-blown trade conflict. Prior to the weekend talks between US and Chinese officials aimed at diffusing the situation, Chinese businesses were staring at a staggering 145% tax on their exports to the US, while American imports were being charged a somewhat lower 125% rate.
Stepping back from the brink
All this suggests that a truce was inevitable. Reports on who initiated the talks vary, depending on the source. But most likely, both sides were seeking an urgent de-escalation, as such punitive tariffs can only be harmful to the world’s two largest economies. Hopes were high heading into the weekend meetings in Switzerland as Trump had hinted that he was willing to lower tariffs on China to 80%.
In a huge relief for investors, the outcome was far better than expected, as both sides agreed to slash each other’s tariffs by 115%, bringing the rate on Chinese imports to 30% and the rate on US goods entering China to 10%. Not forgetting the sectoral tariffs on steel and cars, this leaves the average level of levies between the two countries still above what it was prior to the start of the trade war in February.
No end to the uncertainty
More concerning for investors and other decision makers, especially business leaders and central bank policymakers, is that the temporary reprieve does little in removing the uncertainty. Reaching an initial trade deal was probably the easy part. Agreeing on a comprehensive trade pact that resolves differences on key areas such as intellectual property rights, the illegal flow of fentanyl and US access to Chinese markets will be much more difficult.
This leaves markets exposed and vulnerable to any potential setbacks during the 90-day pause, while failure to reach a more permanent agreement risks reviving fears about a US and global recession.
Dollar perks up
The easing trade tensions have helped the US dollar recover significant lost ground. The dollar index surged towards its 50-day moving average (MA) the day after the Sino-US deal was announced, extending its rebound from April’s three-year low of 97.92 to more than 4%. However, the 50-day MA has proven to be a tough obstacle to overcome, and the greenback has since retreated somewhat, casting doubt about its outlook even if trade frictions continue to de-escalate.
Inflation risks persist
Apart from the ongoing risk that Trump could re-impose some of the suspended tariffs at any point, there is also huge uncertainty about what will happen to inflation. For now, US inflation appears to be gradually declining, putting the Fed in a strong position to resume its rate cuts at some point in the second half of the year.
However, the Trump administration has repeatedly indicated that the 10% baseline tariffs that were introduced on April 2 are here to stay. The 25% duties on specific sectors are also not likely to be abolished completely, even if there are some further exemptions in the future. Plus, tariffs on additional industries are possible.
This makes it difficult for the Fed to feel confident about inflation maintaining its current downward path as there’s bound to be some impact from the higher tariffs on US prices even in the best cast scenario. Investors currently foresee just two rate cuts this year, with a full 25-basis-point reduction not fully priced in until September.
Fed still faces a dilemma
A long pause seems more justifiable now that exorbitant tariff levels have been scaled back and no longer pose a threat to the economy. But then why is the dollar’s rebound looking shaky?
It’s likely that investors still see a significant risk of stagflation, as the uncertainty about Trump’s policies will probably hold back business and consumer spending to some extent, suppressing growth while costs go up. It’s also the case that the supply chain landscape will go through an inevitable transformation, as many businesses will be forced either way to shift some or all of their production to the US, pushing up costs.
A China deal may not be easy
Investors should not be fooled into thinking that America’s quest to decouple from China will stop when Washington and Beijing finalise their deal, which itself may not bring an end to the broader economic war.
One reason why Trump is coming down hard on China in his second term is because of the failure of the Phase I agreement signed in January 2020 during his first term. The Chinese did not live up to their commitment of buying more US goods, so the White House will be wary not to repeat the same mistake and will seek better safeguards for enforcement of the deal.
Hence, the stakes are a lot higher this time, meaning a resolution of the trade dispute may take a lot longer than anticipated. This explains why many investors are maintaining a substantial degree of caution until there is a more convincing breakthrough in the negotiations.
Reason for optimism
Nevertheless, some optimism in the short term is warranted, as all the signs suggest the Trump administration wants to avoid another stock market meltdown and is determined to get more preliminary deals across the finish line. It’s also highly likely that the existing 90-day delays on reciprocal tariffs will be extended, while the evidence from the latest announcements on the chip and pharmaceutical sectors is that the White House is toning down its stance amid outcry from industry leaders.
For the dollar, a break above the 50-day MA is vital if the recovery is to gain any traction, with the next critical barrier likely to be found around 103.35, followed by the 200-day MA. Though, the 200-day may be too bullish a target at the moment as downside risks persist.
Doubts about Dollar’s reserve currency status
Trump’s constant flip-flopping on trade and undermining of America's democratic institutions is harming the dollar’s position as the world’s reserve currency. This may limit the dollar’s advances even if there is a further cooling in trade tensions.
But in the event that there is a re-escalation in the trade war and Fed rate cut expectations are ratcheted up, there is scope for the dollar index to slide all the way down to the 94.60 region towards 2021 lows.
Weekly Focus – Positive Trade Developments Spur Risk-On Sentiment
This week has been dominated by risk-on sentiment in markets following the positive outcome of the US and China trade negotiations during the weekend in Geneva. The cuts to tariff rates were larger than we and consensus had anticipated as the US announced a 115-percentage point reduction of the previous tariff rate from 145% to 30%. Adding the 10% universal tariff rate Chinese goods are now faced with a 40% tariff when entering the US compared to around 10% before Trump took office. We estimate there is a good chance of the US cutting tariffs by an additional 20 percentage points by striking a deal on the Fentanyl issue. Following the announcement, the risk of a recession in the US has been significantly reduced and we estimate that growth will likely experience a hit of around 0.5 percentage points which is manageable. For more details, see US-China Flash - Trade talks succeed in de-escalation, 12 May, and join our webinar on 21 May.
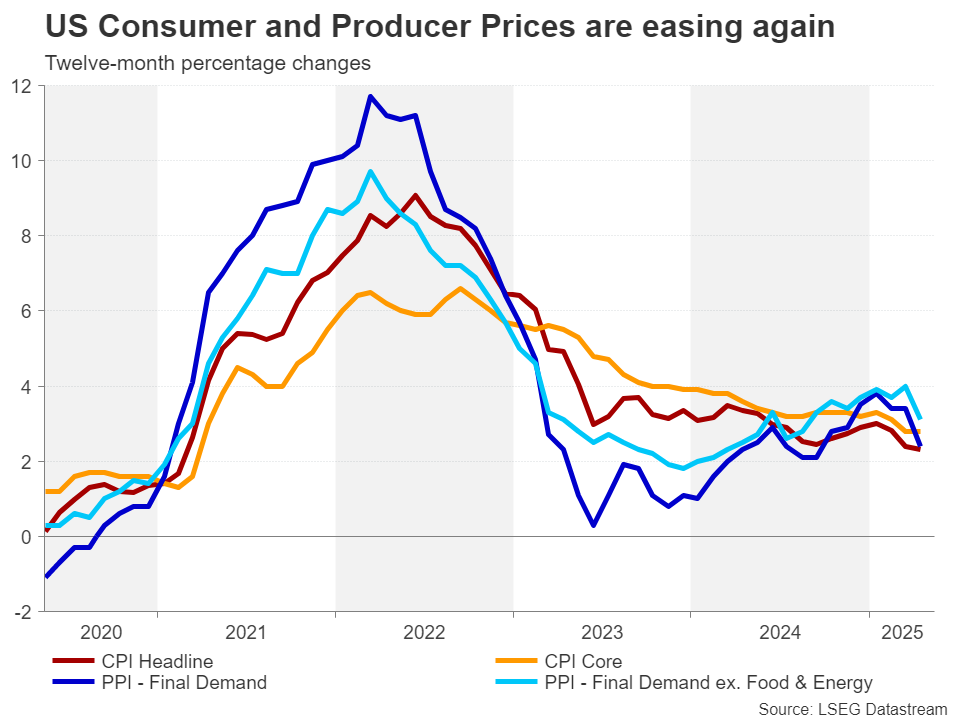
On the data front, we received a host of data this week from the US. Inflation data for April surprised slightly to the downside as headline inflation declined to 2.3% y/y (cons: 2.4% y/y) from 2.4% y/y and core inflation remained at 2.8% y/y, as expected. There was little evidence of tariff-driven price pressures, as core goods inflation remained slow (+0.06% m/m) and food prices even declined slightly (-0.08% m/m). Interestingly, core services inflation excluding shelter and healthcare remained negative for the second consecutive month (-0.02% m/m), which suggests that underlying price pressures have remained in check despite the trade war - a conclusion that was also supported by the April PPI data. The trade war does not seem to have caused US consumers to be significantly more cautious when evaluating the latest retail sales data for April. Retail sales recorded a small monthly decline in the control group due to weaker spending on clothing and electronics, while spending on restaurants and bars continue growing at a solid pace. We think the weak retail sales figure might reflect reversal of front-loading effects more than true underlying weakness.
In the euro area, data showed that employment continued to grow in the first quarter of the year, rising 0.3% q/q after growing 0.1% q/q in Q4 2024. Hence, the labour market continues the strong footing it has been on in the past years despite weak economic activity. Employment growth was once again driven by Spain that recorded 0.8% q/q higher employment while both France and Germany reported unchanged employment in Q1. The strong labour market is a hawkish argument for the ECB. In Germany, the final inflation data for April showed that much of the increase in core inflation was due to the timing of Easter pushing up costs for package holidays and airfares, which suggests the increase in April should be seen more as a one-off than a resurgence of price pressures in core services.
Next week, focus turns to the May PMI data for the US and euro area, which will be interesting to follow as they previously have remained stronger than feared amid the trade war uncertainty. On Monday, China releases a large batch of data for April, which will show the impact of the peak escalation of trade tensions, and the central bank announces its interest rate decision, and so does the Australian central bank. In Japan, we will receive inflation data on Thursday, and in the euro area we focus on the negotiated wage growth data for Q1 released on Friday and the EU Commission's economic forecasts on Monday.
Cliff Notes: The Promise of Detail
Key insights from the week that was.
In Australia, Westpac-MI Consumer Sentiment rose 2.2% to 92.1% in May, representing a partial rebound from a subdued result in April that partly captured President Trump’s ‘Liberation Day’. There have been many developments on the global trade front since – especially the latest de-escalation between the US and China which came just after our latest survey – which, combined with the calm attitude of financial markets, have supported sentiment. This was clearly captured in views on ‘family finances vs a year ago’ which rebounded +7.0% and, to a lesser extent, the year-ahead outlook for economic conditions, up +2.8%.
Consumers are accordingly less downbeat on whether it is ‘time to buy a major household item’, up +3.5%; however, that the sub-index remains 25% below its long-run average emphasises the weak starting point for the nascent recovery in consumer spending after a prolonged period of real income declines over 2023/24. On that front, the latest wages data struck a more positive tone for households, with the wage price index rising 0.9% (3.4%yr) in Q1. This was slightly firmer than expected and came as a result of wage increases delivered to aged care and childcare workers.
Households also remain positive on the labour market outlook, a view that was certainly given justification by the latest labour force survey. Following a couple of months of softer outcomes, employment surprised materially to the upside with an +89k surge. This also came alongside a significant rebound in the labour force, seeing the employment-to-population ratio and participation rate bounce back toward their historic highs. Meanwhile, the unemployment rate was little changed at its current year-average of 4.1%. Broadly, labour demand and supply still look to be moving broadly in tandem, allowing measures of labour market slack to hold steady.
Overall, this week’s data does not change our view that the RBA will deliver a 25bp rate cut at its policy meeting next week, but it will be interesting to see refreshed staff forecasts and the Board’s framing of risks around the domestic and global outlook. We note that the latest NAB business survey highlighted businesses were broadly unphased by the US’ tariff uproar, supporting the view that Australia remains well placed to weather this period of global uncertainty. And, as far as the latest US-China trade deal is concerned, this week’s essay from Chief Economist Luci Ellis discusses the implications in more depth.
Offshore, investors were focussed on the short-term trade deal agreed between the US and China. Tariffs imposed on Chinese exports were reduced to 30% (combining a 10% reciprocal rate and 20% tariff for fentanyl supply), while China will tariff US goods by 10%. These rates will be in place for 90 days from 12 May during which time the leaders of both countries will seek to negotiate a more permanent trade agreement. Industry tariffs also remain in effect for Chinese imports to the US, as is the case for other nations.
On the data front, the US CPI printed below expectations at 2.3%yr in April, the lowest rate since February 2021. Annual core inflation held steady at 2.8%. The detail of the April report was mixed, food prices edging higher as energy posted a partial rebound (a 0.7% gain after March’s 2.4% decline). Within the core basket, goods prices edged higher again (up 0.1% in the month and over the year). Services inflation meanwhile remained robust at 0.3%, 3.6%yr (ex energy). Shelter inflation (primarily rents) continues to track materially above average, a consequence of limited supply; but medical care services also saw an outsized gain 0.5% compared to its current annual pace of 3.1%yr. Overall, ahead of the impact of tariffs, the baseline for inflation in the US looks to have been inflation modestly above target, primarily as a result of constrained supply. This is not a trend that the FOMC can easily influence; but, as tariffs also impact, it will give the FOMC cause to be cautious over inflation expectations and risks.
FOMC members who spoke this week certainly supported a ‘wait and see’ approach to monetary policy. Although, it has to be noted, they are assessing the labour market as closely as inflation. We maintain our call for two rate cuts towards the end of 2025 and an on-hold stance through 2026 while awaiting a clearer read on the net effect of US domestic and trade policy.
In the UK meanwhile, the latest labour market data gave justification for the Bank of England to continue to ease through 2025. The three-month average pace of employment growth slowed to 112k in March, down from 206k in February; and the unemployment rate edged up from 4.4% to 4.5%. Annual growth in average weekly earnings decelerated from a revised 5.9%yr ex-bonus to 5.6%yr (3-month average basis). This deceleration in wages aligns with other survey indicators which indicate wage growth is unlikely to be a source of inflationary pressure over the coming year.
While there may be greater concern over US growth these days, for both the UK and Euro Area, the outlook is becoming brighter. UK GDP growth was strong as expected in Q1, gaining 0.7%, 1.3%yr. This is despite soft private consumption (0.2%) and a contraction in government spending (-0.5%), more than offset by a surge in business investment (2.9%) as export growth outpaced imports (3.5% versus 2.1%). The second release for Q1 Euro Area growth confirmed robust moment, quarterly growth edged down from 0.4% to 0.3% but the annual rate unchanged at 1.2%yr – around trend.
The balance of growth prospects between the US, UK, Europe and, further afield, Asia will have a material bearing on the outlook for financial markets. Current trends point to persistent downward pressure on the US dollar, as discussed recently in our May Market Outlook.
Sunset Market Commentary
Markets
“Time to go back home”. US President Trump wrapped up his road trip through the Middle-East, sealing substantial business and defense contracts with Saudi Arabia, Qatar and the United Arab Emirates. Those agreements cover slightly over €1tn with (Qatari) plans to significantly increase them further. The investment deals helped lift spirits on (US) equity markets this week (perhaps also as his busy schedule kept him away from social media) with main indices on track to record a fourth consecutive weekly gain and pushing them above levels on the eve of “Liberation Day”. During his trip, Trump lauded his Secretary Treasury Bessent and his prominent role in trade talks. “When Bessent talks, markets listen”. They do not only listen, but also tend to rally unlike when trade czar Navarro or Commerce Secretary Lutnick enter the scene. Bessent’s Geneva talks with Chinese vice-premier He Lifeng led to a 90-day truce in the Sino-US trade war and kickstarted this week’s rally. The US trade team remains focused on Asian countries, but the likes of Japan indicated they aim for a good rather than a fast deal. People close to talks indicate that Japan targets a complete removal of tariffs on the key car sector, rather than falling back to Trump’s floor rate of 10%. Lacking the manpower and capacity to hold talks with all countries involved in the reciprocal tariff plan during the current 90-day pause, Trump said that other trading partners over the next two to three weeks will get letters to inform them of the tariffs they will pay to do business in the US. Ongoing discussions with the likes of South Korea and Japan also cover FX policy. The US believes that appreciating currencies from trading partners are part of the solution to shrink the trade deficit on the US goods balance. By stressing this part of the equation, the dollar’s recovery already showed signs of fatigue this week. Recent trade developments significantly reduced the tail risk of a severe global growth slowdown and a US recession. It put the fiscal story back on investors’ radar as the US House is wrapping up its Reconciliation Bill. Trump hopes to see that on his desk by Independence Day, in time to raise the US debt ceiling and in time to extend tax cuts from his first term. The US Committee for a Responsible Budget already warned for the devastating impact on public finances based on available information. They fear that the debt ratio could hit 125% or worst-case even 129% of GDP by 2034 (from 100% currently and vs baseline path of 117%). Annual budget deficits of 6.9%-7.8% would be the new standard with interest rate costs rising to up to 4.2%-4.4% of GDP by end 2034. The CFRB warning kicked in for US Treasuries with the 30-yr yield testing the psychologic 5% mark for already the third time this year. The test failed as the Big Beautiful Bill is still in its early stages of being marked up in various House Committees. The House hopes to pass it somewhere early June. That’s an eternity in Trump’s high-speed world. US eco data helped creating a more stable market setting towards the end of the week as well. Activity data point to a slowdown in the chaotic month of April, but disinflationary CPI/PPI data and improving sentiment indicators for May keep the goldilocks dream (avoiding recession and keeping disinflation on track) alive for now. Next week’s eco calendar is light on data with May global PMI’s (Thursday) and EMU Q1 wage growth numbers (Friday) exception to the rule.
News & Views
The Central Bank of Romania (CBR) kept its policy rate unchanged at 6.5%. The decision came in a context of elevated political uncertainty that caused the CB to allow the leu to depreciate within its managed floating regime before stabilizing it via interventions at a weaker level (EUR/RON 5.1055 currently). This leu weakening might complicate the disinflation process. In its policy statement, the CBR assessed that inflation in Q1 declined less than anticipated to 4.86% in March from (5.14% in December) as decreases of fuel and tobacco prices, alongside non-food sub-components of core inflation, were partly countered by the swifter increase in energy prices, administered prices and processed food prices. Details of a new inflation report will be published on Tuesday. The CBR indicates that Y/Y inflation will fluctuate until 2025 Q3. It is expected to decrease later but on a significantly higher path than in the previous forecast, falling no sooner than in 2026 Q1 and only to marginally below the upper bound of the target band (1.5%-3.5%). On Sunday a second round of the presidential election takes place between far right candidate George Simion who won the first round and the Mayor of Bucharest, Nicusor Bank, who has a more centrist profile.
US UoM consumer sentiment falls to 50.8, inflation expectations surges to 7.3%
US consumer sentiment deteriorated again in early May, with University of Michigan’s index falling from 52.2 to 50.8, its lowest level since mid-2022 and well below expectations of 53.0.
The decline was broad-based, with Current Economic Conditions Index slipping from 59.8 to 57.6 and Expectations Index easing from 47.3 to 46.5. Since the start of 2025, overall sentiment has plunged nearly 30%.
The report also highlighted a surge in inflation fears, with year-ahead inflation expectations jumping from 6.5% to 7.3%.
According to the survey, nearly three-quarters of respondents spontaneously mentioned tariffs, a notable increase from April’s 60%.
Interviews for the survey were conducted between April 22 and May 13, capturing only limited responses after the May 12 announcement of a partial tariff pause on Chinese goods. The final May release may reveal whether that move tempers consumer concerns.
EUR/USD Mid-Day Outlook
Daily Pivots: (S1) 1.1157; (P) 1.1192; (R1) 1.1220; More...
Intraday bias in EUR/USD remains neutral. On the upside, break of 1.1292 resistance will argue that correction from 1.1572 has completed after defending 38.2% retracement of 1.0176 to 1.1572 at 1.1039. Intraday bias will be back on the upside for retesting 1.1572. However, sustained break of 1.1039 will dampen this view and target 61.8% retracement at 1.0709 next.
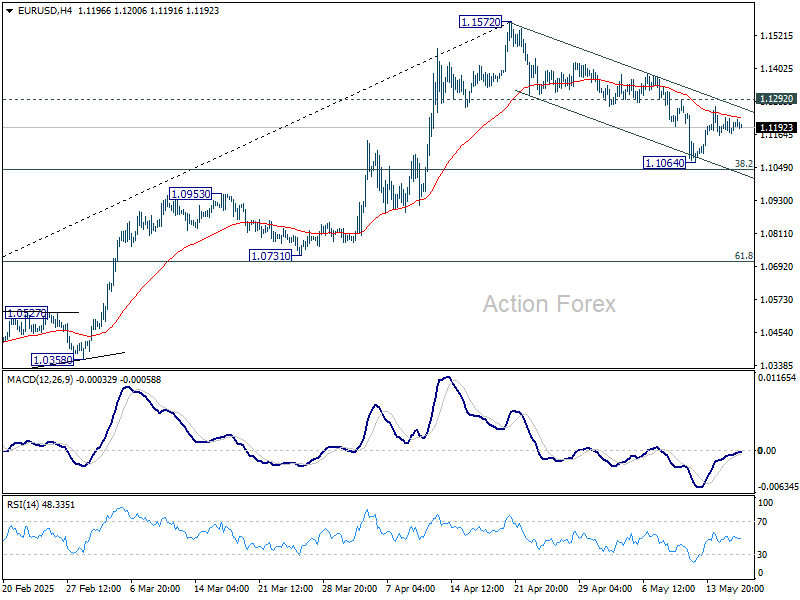
In the bigger picture, rise from 0.9534 long term bottom could be correcting the multi-decade downtrend or the start of a long term up trend. In either case, further rise should be seen to 100% projection of 0.9534 to 1.1274 from 1.0176 at 1.1916. This will now remain the favored case as long as 55 W EMA (now at 1.0789) holds.
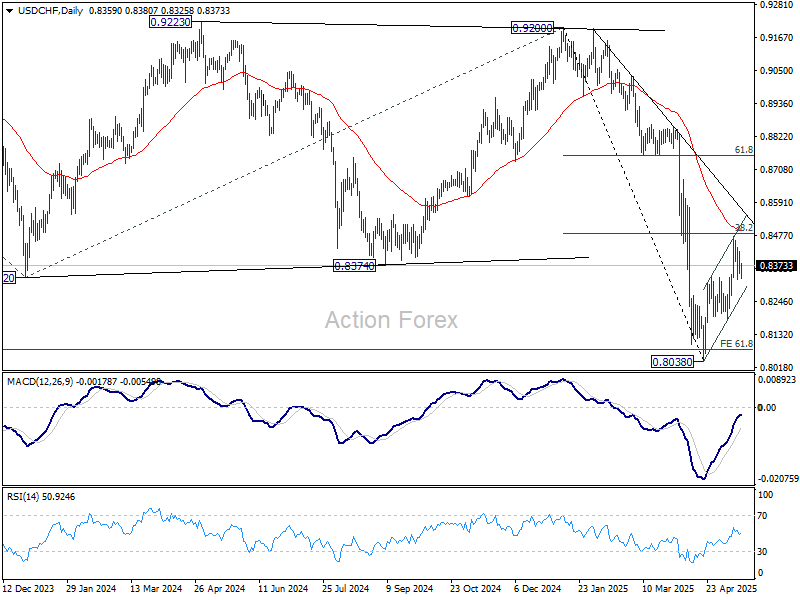
USD/CHF Mid-Day Outlook
Daily Pivots: (S1) 0.8328; (P) 0.8377; (R1) 0.8409; More….
Intraday bias in USD/CHF stays neutral. On the downside, firm break of 0.8333 resistance turned support will argue that corrective rebound from 0.8038 has completed at 0.8475, after rejection by 38.2% retracement of 0.9200 to 0.8038 at 0.8482. Intraday bias will be back on the downside for 0.8184, and then retest of 0.8038 low. However, sustained trading above 0.8482 will dampen this bearish view and target 61.8% retracement at 0.8756 next.
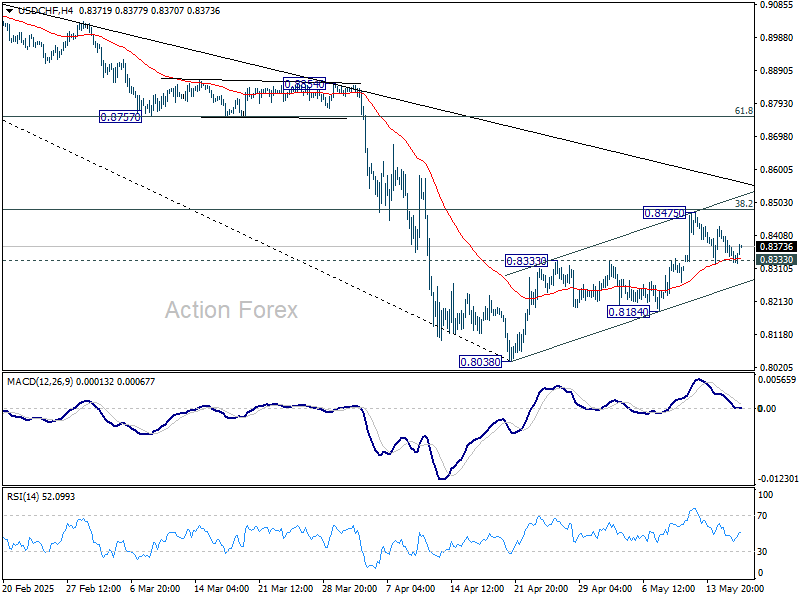
In the bigger picture, long term down trend from 1.0342 (2017 high) is still in progress and met 61.8% projection of 1.0146 (2022 high) to 0.8332 from 0.9200 at 0.8079 already. In any case, outlook will stay bearish as long as 55 W EMA (now at 0.8750) holds. Sustained break of 0.8079 will target 100% projection at 0.7382.