Sample Category Title
USDJPY Pulls Back, But Buyers Step In at Key Levels
Key Highlights
- USD/JPY started a downside correction and traded below 147.20.
- A connecting bullish trend line is forming with support at 144.50 on the 4-hour chart.
- EUR/USD could aim for a recovery if it clears the 1.1280 resistance.
- Gold prices dipped further and traded below $3,200.
EUR/USD Technical Analysis
The US Dollar failed to continue higher above 148.65 and corrected gains against the Japanese Yen. USD/JPY traded below the 148.00 and 147.50 levels.
Looking at the 4-hour chart, the pair traded below 147.20 support and tested the 50% Fib retracement level of the upward move from the 142.34 swing low to the 148.65 high. However, the pair remains well above the 100 simple moving average (red, 4-hour) and the 200 simple moving average (green, 4-hour).
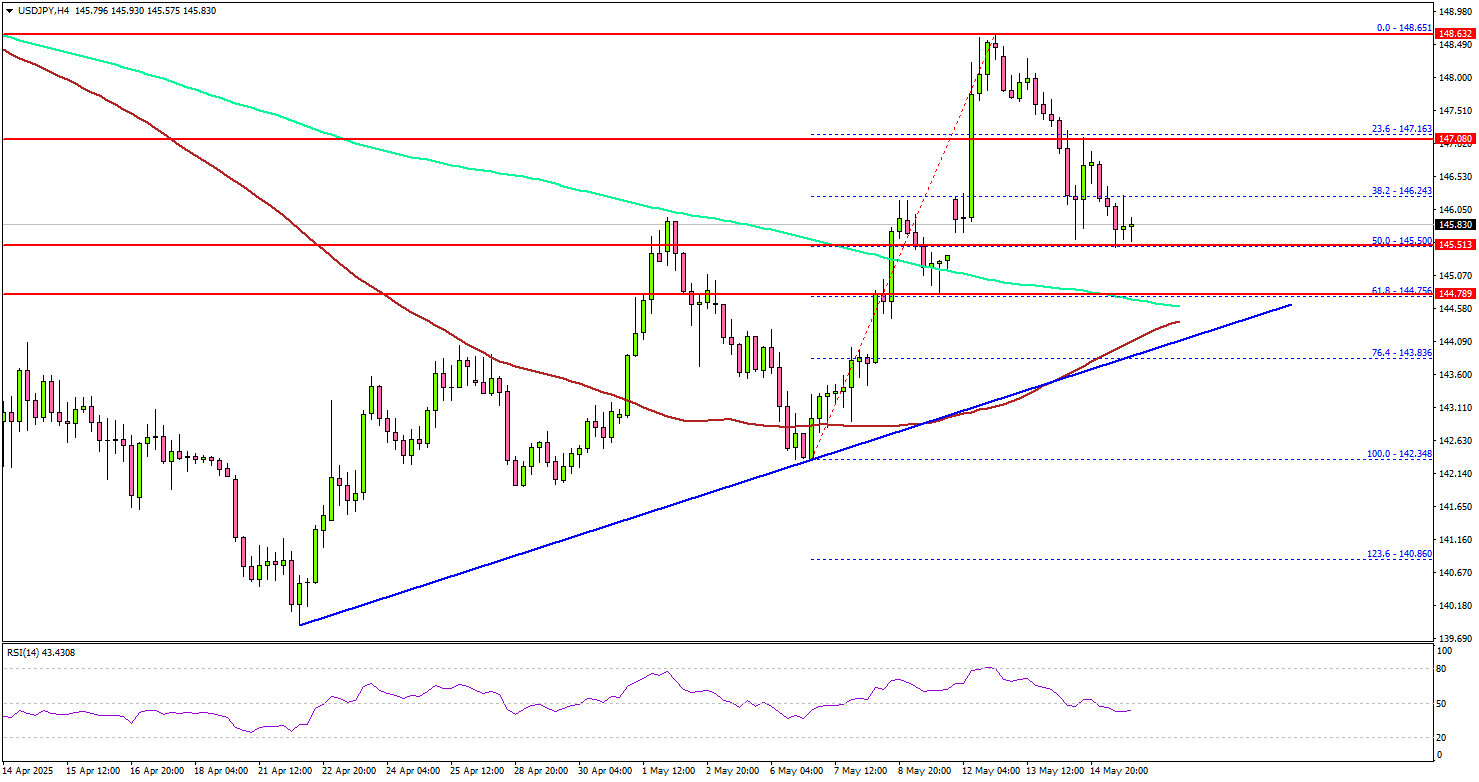
On the downside, immediate support sits near the 144.75 level and the 200 simple moving average (green, 4-hour). The next key support sits near 144.50. There is also a connecting bullish trend line forming with support at 144.50 on the same chart.
Any more losses could send the pair toward the 143.20 level. On the upside, the pair could face resistance near the 147.00 level. The next key resistance sits near the 147.50 level.
The first major resistance sits at 148.00. A close above the 148.00 level could set the tone for another increase. In the stated case, the pair could even clear the 148.65 resistance. The next major stop for the bulls could be near the 150.00 resistance.
Looking at EUR/USD, the pair started a consolidation phase and faces hurdles near the 1.1280 and 1.1320 levels.
Upcoming Economic Events:
- US Housing Starts for April 2025 (MoM) – Forecast 1.370M, versus 1.324M previous.
- US Building Permits for April 2025 (MoM) – Forecast 1.450M, versus 1.467M previous.
- Michigan Consumer Sentiment Index for May 2025 (Prelim) – Forecast 53.4, versus 52.2 previous.
Japan’s GDP contracts -0.2% qoq in Q1, export drag offsets capex gains
Japan’s economy shrank by -0.2% qoq in Q1, marking its first contraction in a year and falling short of the -0.1% qoq consensus. On an annualized basis, GDP contracted by -0.7%, a sharp disappointment compared to expectations for -0.2%.
The weakness was largely driven by external demand, which subtracted -0.8 percentage points from growth as exports declined -0.6% qoq while imports jumped 2.9% qoq.
Domestically, the picture was mixed. Private consumption, comprising more than half of Japan’s output, was flat on the quarter. However, capital expenditure provided some support, rising by a solid 1.4% qoq.
Meanwhile, inflation pressures showed no sign of easing, with the GDP deflator accelerating from 2.9% yoy to 3.3% yoy, above expectations of 3.2% yoy.
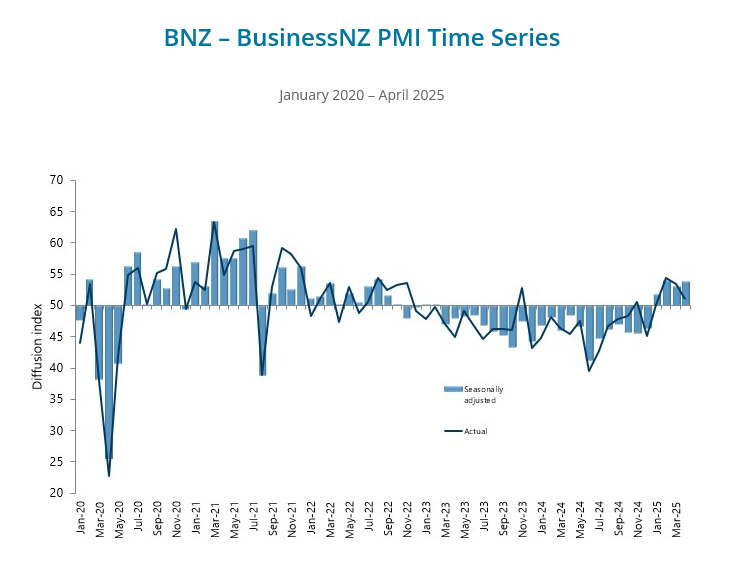
NZ BNZ manufacturing rises to 53.9, recovery gains ground
New Zealand’s BusinessNZ Performance of Manufacturing Index edged up from 53.2 to 53.9 in April. The gain was driven by improvements in employment and new orders, up to 55.0 and 51.4 respectively, with employment reaching its highest level since July 2021. However, production eased slightly to 53.8.
BNZ Senior Economist Doug Steel noted that while the sector isn’t booming, the recovery is clear, with the PMI rebounding sharply from a low of 41.4 last June.
Still, he cautioned, "there remain questions around how sustainable it is given uncertainty stemming from offshore”.
Fed’s Barr: Solid economy faces threats from tariff-driven supply disruptions
Fed Governor Michael Barr highlighted solid growth, low unemployment, and continued progress on disinflation in the US economy. However, he flagged growing concern over rising trade-related uncertainty, which has begun to weigh on consumer and business sentiment.
In a speech overnight, Barr specifically pointed to the vulnerability of small businesses, which are more exposed to "disruptions to supply chains and distribution networks".
These firms are integral to broader production networks, and failures in this segment could trigger cascading effects across the economy.
Drawing a parallel to the pandemic, Barr noted that "disruptions can have large and lasting effects on prices, as well as output," leading to lower growth and higher inflation ahead.
Gold (XAU/USD) Surges Beyond $3200/oz on Weak US Data, DXY Slips
The analysis in this article is a follow up from Gold (XAU/USD) Slides 2.2% to One-Month Lows. $3150 incoming?
Gold prices have surged around 3% from the Asian session lows around the $3125/oz handle. Gold had surged toward the $3180/oz handle ahead of the US open thanks in large part to a weaker US Dollar.
The US Dollar faced renewed selling pressure in the US session after a wave of economic reports, including data showing retail spending slowed in April as worries about the economy affected confidence.
US Data Weighs on the US Dollar
The Commerce Department reported that retail sales rose slightly by 0.1% in April, following a revised 1.7% increase in March. Economists had expected no change after the previously reported 1.5% rise in March. Meanwhile, the Labor Department said weekly jobless claims stayed steady at 229,000, matching economists' predictions, though job openings have become scarcer.
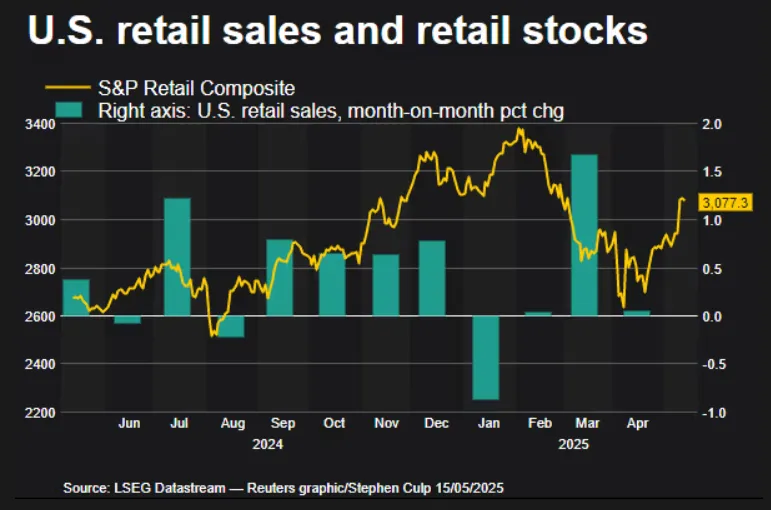
Source: LSEG
The retail sales data does show that tariff impacts have for now been largely avoided thanks to pre-emptive buying in March. The PPI figure points to companies absorbing cost-related shocks for now, whether this will continue remains to be seen.
The concern is the drop in the retail sales figure which suggests that the pre-emptive buying has disappeared quickly which could be a sign of things to come.
US small businesses are getting more pessimistic about the economy:
The NFIB Small Business Optimism Index declined 1.6 points in April, to 95.8, its lowest since October 2024. 6 of the 10 index components decreased, with expected business conditions having the most negative contribution.Over the last 4 months, the index has fallen 9.3 points, the sharpest drop since the 2020 pandemic.
At the same time, the share of small firms expecting better business conditions 6 months from now has plummeted 37 percentage points, to 15%, the lowest since October 2024.
This in part aided the push by Gold beyond the $3200/oz mark and could be the catalyst for a deeper recovery.
Market Sentiment
Looking at overall client sentiment at OANDA and 71% of traders are net-long on Gold.
With the OANDA Sentiment Tool you can see the OANDA traders’ positions sentiment for 20 most traded instruments for the last seven days and sort them by bullish or bearish bias expressed through their positions. If total short positions outweigh long positions, the clients appear to have a “bearish sentiment” against that instrument. Similarly, if long positions exceed short positions, customers are supporting a rising “bullish” trend.
https://proptrader.oanda.com/en/lab-education/tools/sentiment/
I, however, hold a contrarian view of client sentiment. Given that 71% of traders are long on Gold there is a possibility the precious metal may continue to face selling pressure.
Technical Analysis - Gold (XAU/USD)
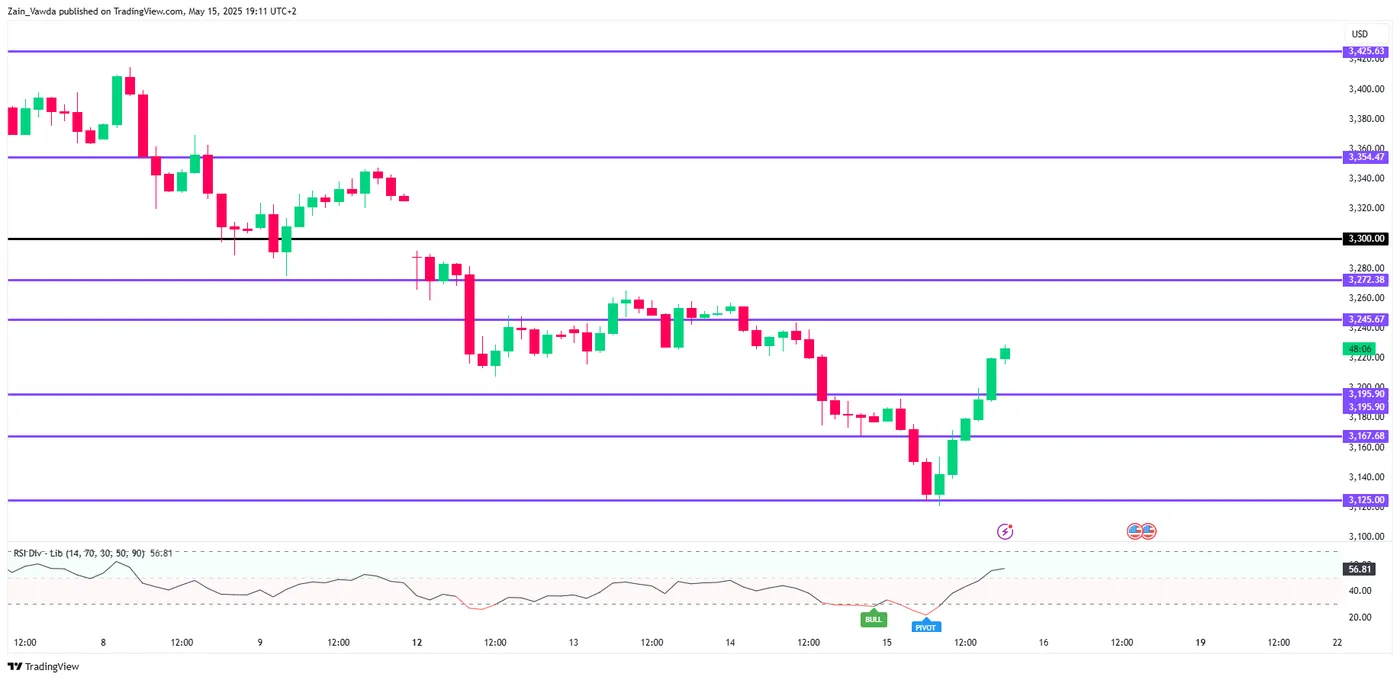
From a technical analysis standpoint, gold is now up nearly 3% from its Asian session lows.
The break above the previous two-hour swing high at 3186 means a change in structure has taken place.
There is another swing high at 3240 which is the next area of interest which could come into play.
There is a probability of a pullback with support at 3195 and 3186 needed to hold if another leg to the upside is to materialize.
If Gold breaks above the 3240 then a run toward the 3272 and 3300 may be in offing.
Gold (XAU/USD) Two-Hour (H2) Chart, May 15, 2025
Source: TradingView (click to enlarge)
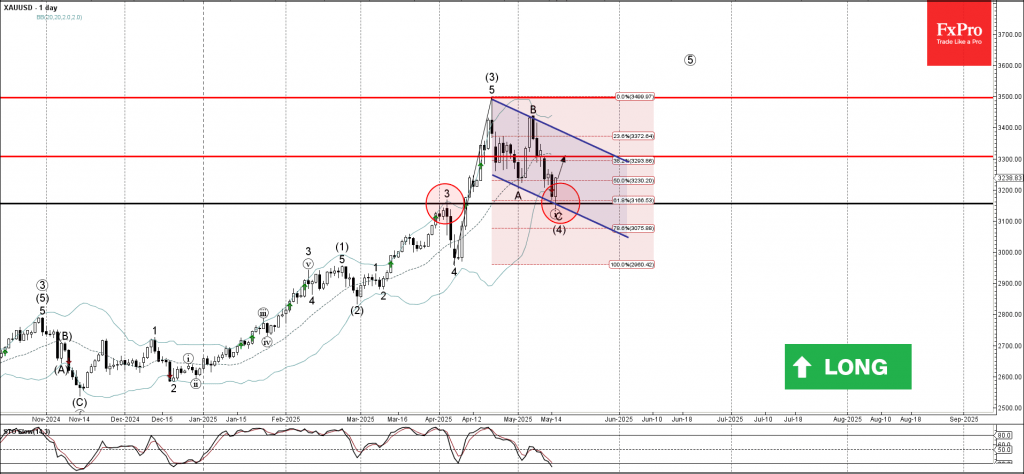
Gold Wave Analysis
Gold: ⬆️ Buy
- Gold reversed from support zone
- Likely to rise to resistance level 3300.00
Gold recently reversed up from the support zone located between the pivotal support level 3155.00 (former top of the impulse wave 3 from the start of April), lower daily Bollinger Band and the 61.8% Fibonacci correction of the upward impulse from January.
The upward reversal from the support zone stopped the C-wave of the previous medium-term ABC correction (4) from the middle of April.
Given the clear daily uptrend and the oversold daily Stochastic, Gold can be expected to rise to the next resistance level 3300.00.
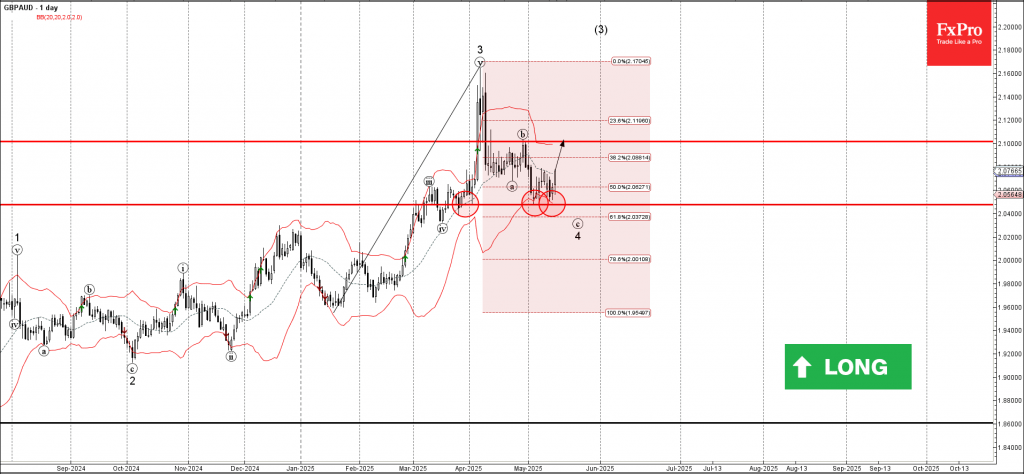
GBPAUD Wave Analysis
GBPAUD: ⬆️ Buy
- GBPAUD reversed from the support zone
- Likely to rise to resistance level 2.1000
GBPAUD currency pair recently reversed up from the support zone between the pivotal support level 2.050 (which has been reversing the price from the end of March), the lower daily Bollinger Band and the 61.8% Fibonacci correction of the upward impulse from January.
The upward reversal from the support zone stopped the C-wave of the previous short-term ABC correction 4 from the start of April.
Given the predominant daily uptrend, GBPAUD currency pair can be expected to rise to the next resistance level 2.1000.
New Zealand Dollar Extends Losses, Inflation Expectations Expected to Rise
The New Zealand dollar is down for a second straight day. In the North American session, NZD/USD is trading at 0.5872, down 0.45% on the day.
New Zealand inflation expectations projected to rise
New Zealand releases inflation expectations for the first quarter on Friday. Inflation expectations can manifest into actual inflation and are considered a market-mover. Over the past three quarters, inflation expectations have hovered around the 2% level, which is the mid-point of the Reserve Bank of New Zealand's target band of 1%-3%. However, inflation expectations are expected to climb to 2.4% in the second quarter, which could complicate the Reserve Bank's plans to further trim interest rates.
New Zealand consumer inflation rose 2.5% y/y in the first quarter, up from 2.5% in Q4 2024 and above the market estimate of 2.2%. This is comfortably within the RBNZ target band and enabled the Bank to cut rates to 3.5% from 3.75% last month.
The central bank left the door open to further rate cuts at the April meeting, stressing the risk to the New Zealand economy due to rising global trade tensions. New Zealand's largest trading partner is China and the temporary agreement between the US and China to slash tariffs is good news for New Zealand's export sector. The Reserve Bank meets next on May 28.
US posts soft retail sales, PPI
US retail sales in April posted a weak gain of 0.1% m/m. This was well below the upwardly revised 1.7% gain in March but edged above the market estimate of 0%. There was also soft data from the inflation front. Producer Price inflation declined 0.5% in April, down from the upwardly revised 0% in March and below the market estimate of 0.2%.
The Federal Reserve is virtually certain to hold rates at the June 30 meeting, but there is a 36% chance of a rate cut in July and a 50% likelihood in September, according to CME's FedWatch. Fed Chair Powell has adopted a wait-and-see stance due to the uncertainty over US trade policy. With inflation largely under control and the labor market in solid shape, Powell is in no rush to lower rates.
NZD/USD Technical
- NZD/USD is testing support at 0.5871. Below, there is support at 0.5844
- There is resistance at 0.5920 and 0.5947
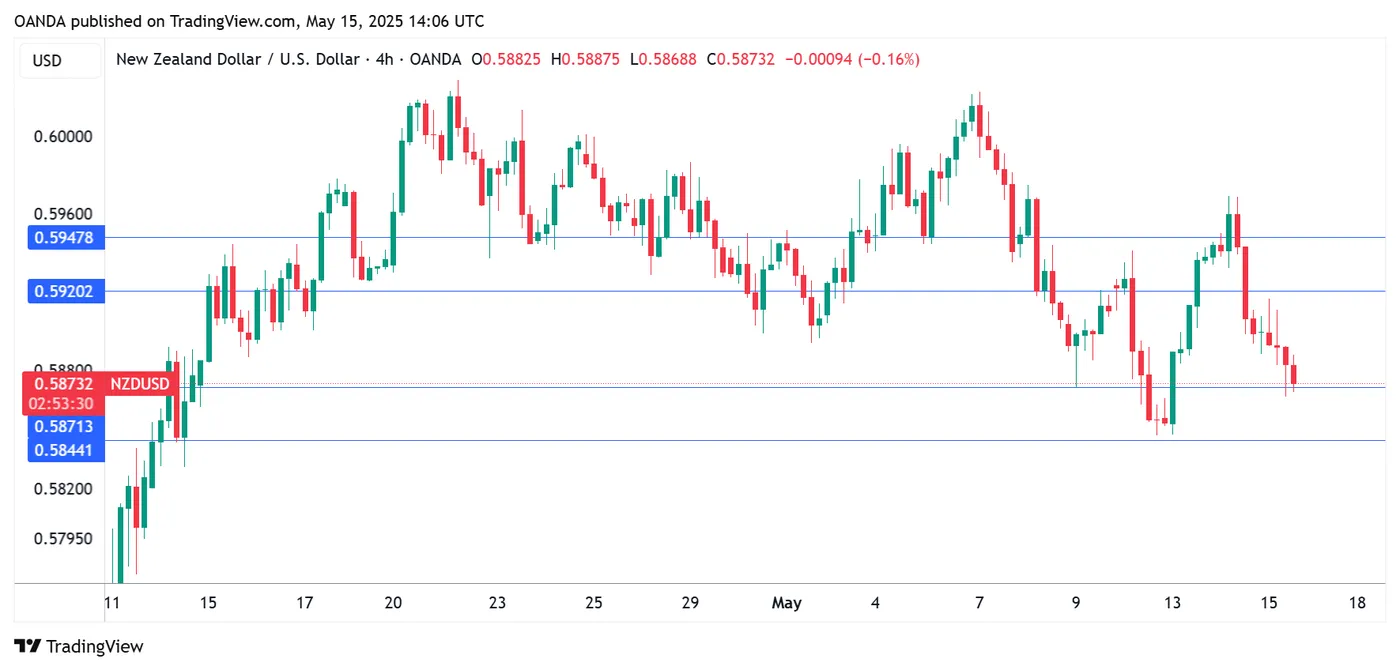
NZDUSD 1-Day Chart, May 15, 2025
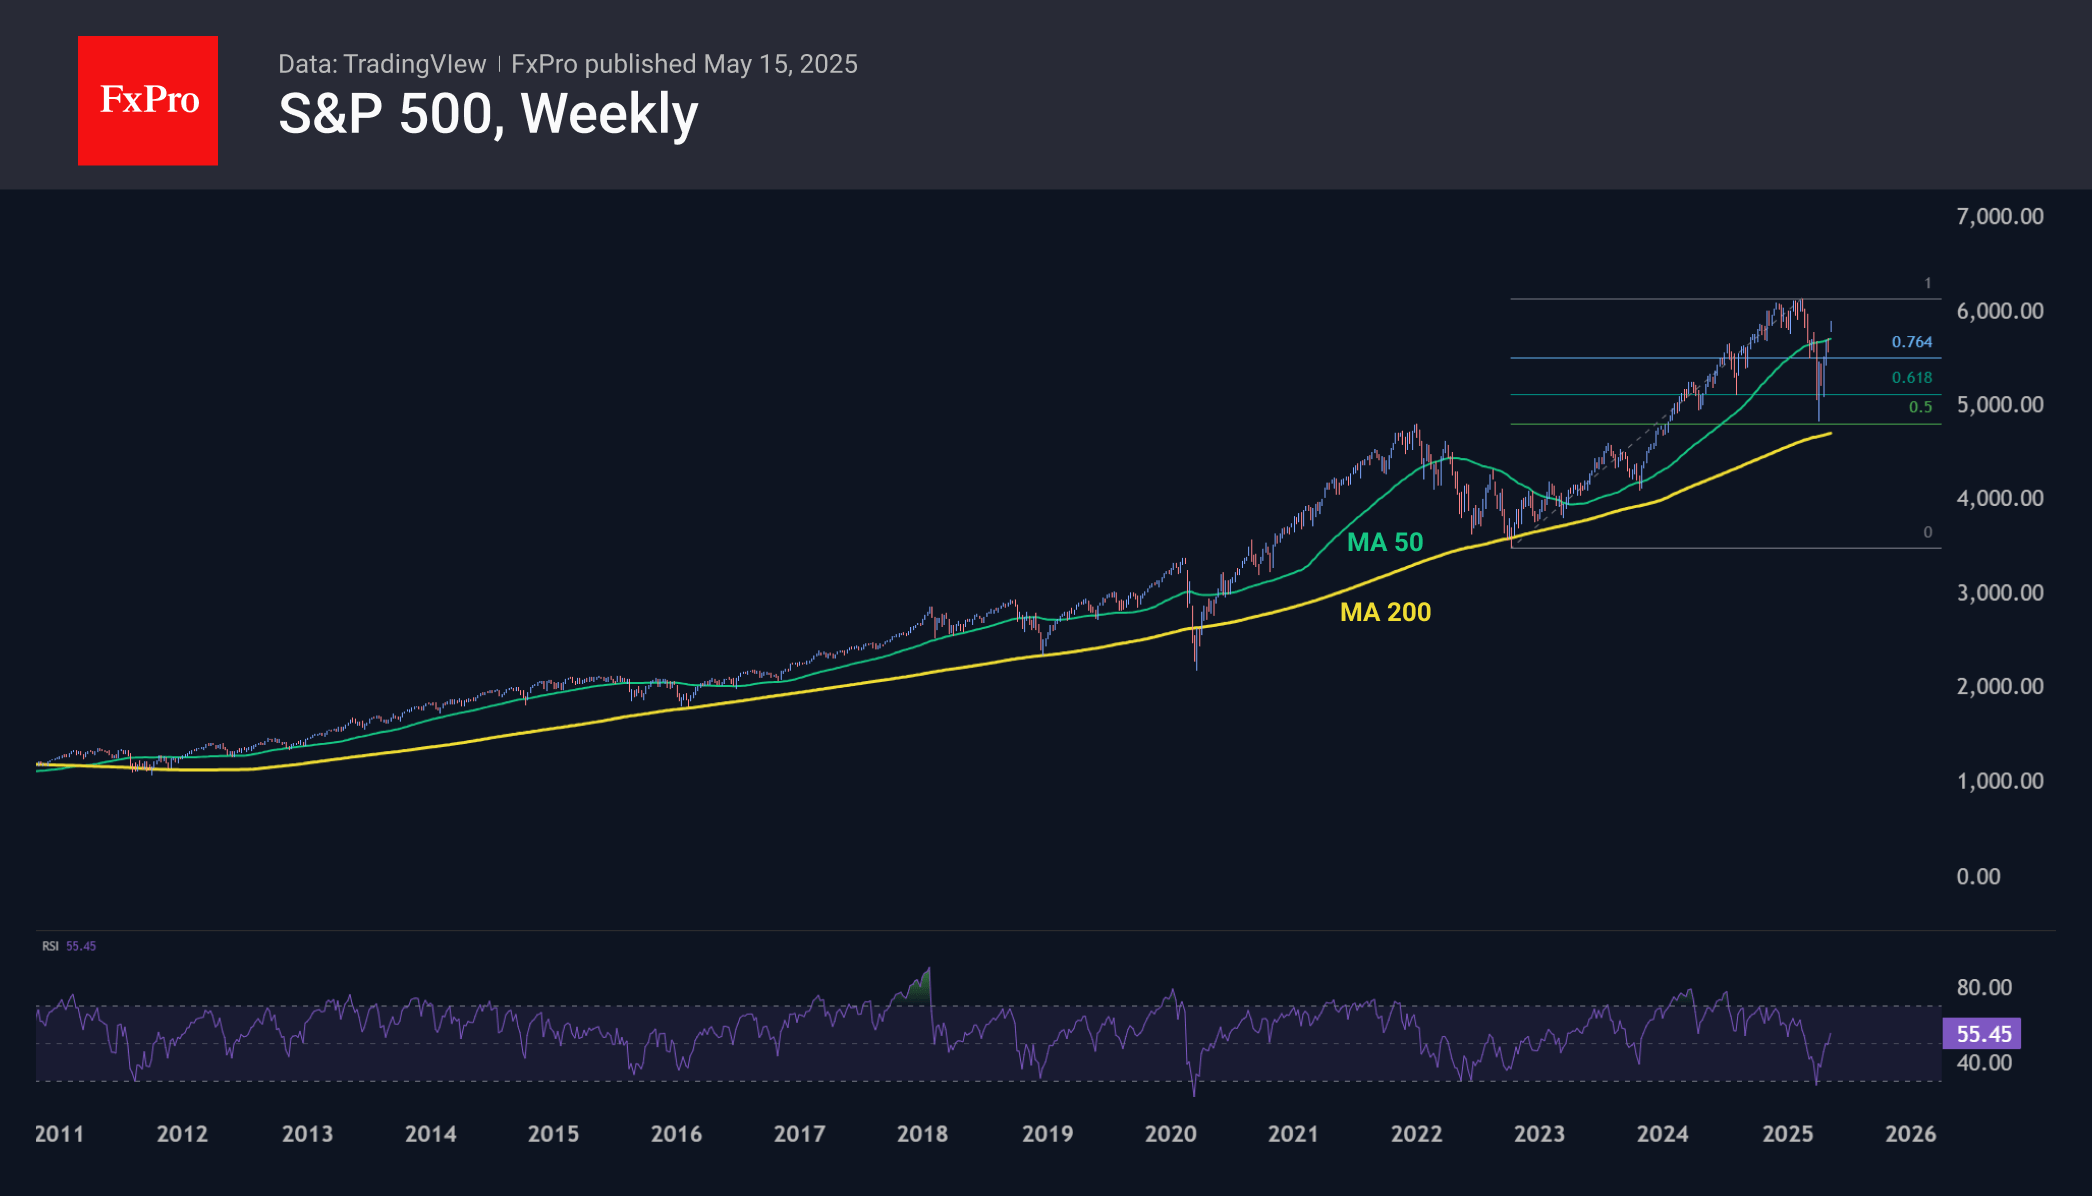
S&P 500 on Its Way to 7500 With a Next Stop at 6000
The S&P 500 Index has surpassed levels from the beginning of the year, up about 23% from the lows reached in early April. The market is currently just 4% below the area of highs that functioned as active resistance from December to February. This raises the question of whether resistance at the 6,000 point level on the S&P 500 is still relevant.
The market decline from February, which turned into a significant drop in April, may have contributed to the market’s recovery and set the stage for a rally. On weekly timeframes over the past 14 years, the market’s approach to the 200-week moving average has served as an indicator of profitable buying. This year was no exception, although the S&P 500 fell slightly short of that line, like the situation in October 2023. Most bounces from this level in recent years have coincided with changes in monetary policy.
However, tariff policy, not monetary policy, was the main market driver this year. Negotiations aimed at lowering rates caused an increase in market activity, replacing Fed action. In recent days, there have been signs of progress in tariff negotiations, supporting market growth.+
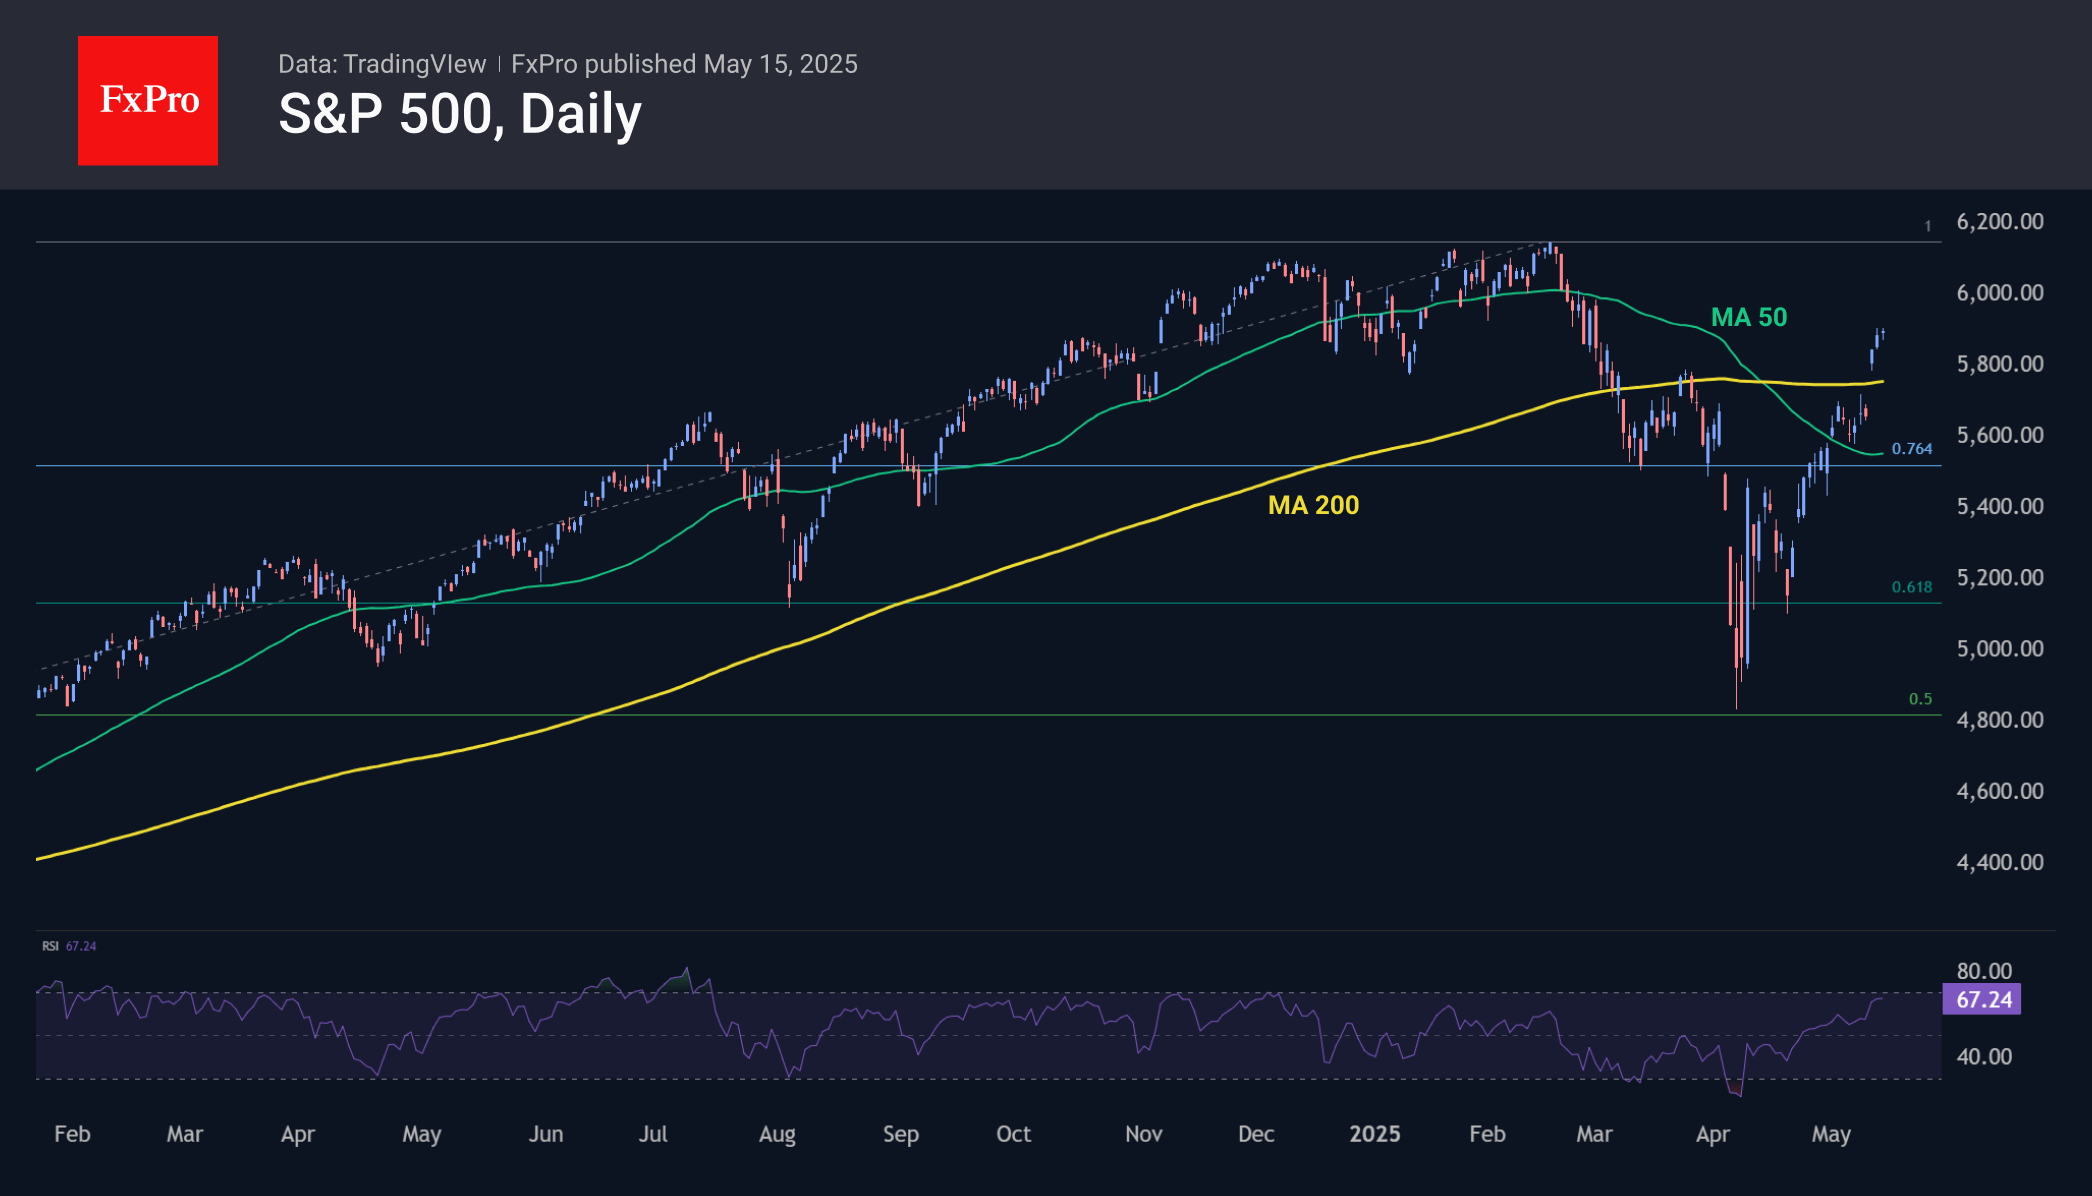
Technical indicators also support a positive trend. With the last major correction, the S&P 500 gave back half of the gains from the lows of October 2022. This decline is consistent with technical market correction patterns, which are often followed by an update of historical highs. The lows of the current correction are almost identical to the peaks prior to the 2022 decline.
Historical data shows different market development scenarios near the previous highs, and we should expect possible volatility in the 6000-6100 range. The market’s upside potential is also evident from past data: the February highs corresponded to 150% of the 2020-2022 rally, indicating a possible target around 7500.