
Sample Category Title
AUD/USD Daily Report
Daily Pivots: (S1) 0.6332; (P) 0.6397; (R1) 0.6436; More...
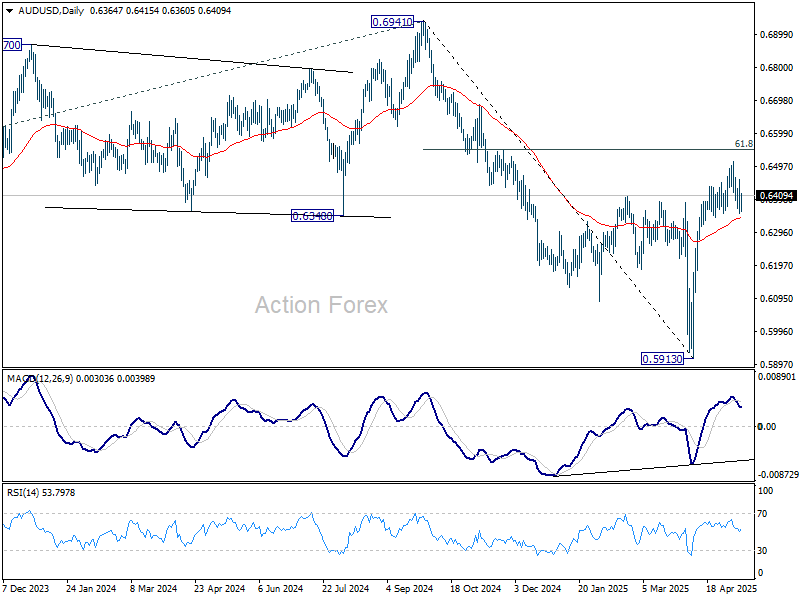
AUD/USD recovered after breaching 0.6364 support briefly and intraday bias stays neutral. On the upside, break of 0.6511 will resume the rally from 0.5913 to 61.8% retracement of 0.6941 to 0.5913 at 0.6548. However, considering bearish divergence condition in 4H MACD, break of 0.6364 support should confirm short term topping. Intraday bias will be turned back to the downside for 38.2% retracement of 0.5913 to 0.6511 at 0.6283.
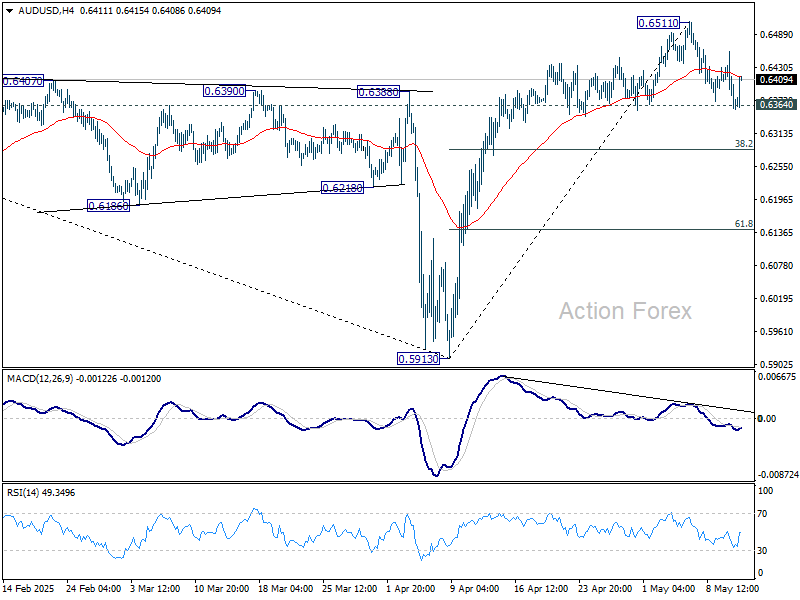
In the bigger picture, as long as 55 W EMA (now at 0.6441) holds, down trend from 0.8006 (2021 high) should resume later to 61.8% projection of 0.8006 to 0.6169 from 0.6941 at 0.5806. However, sustained trading above 55 W EMA will argue that a medium term bottom was already formed, and set up further rebound to 0.6941 resistance instead.
EUR/USD Daily Outlook
Daily Pivots: (S1) 1.1022; (P) 1.1132; (R1) 1.1199; More...
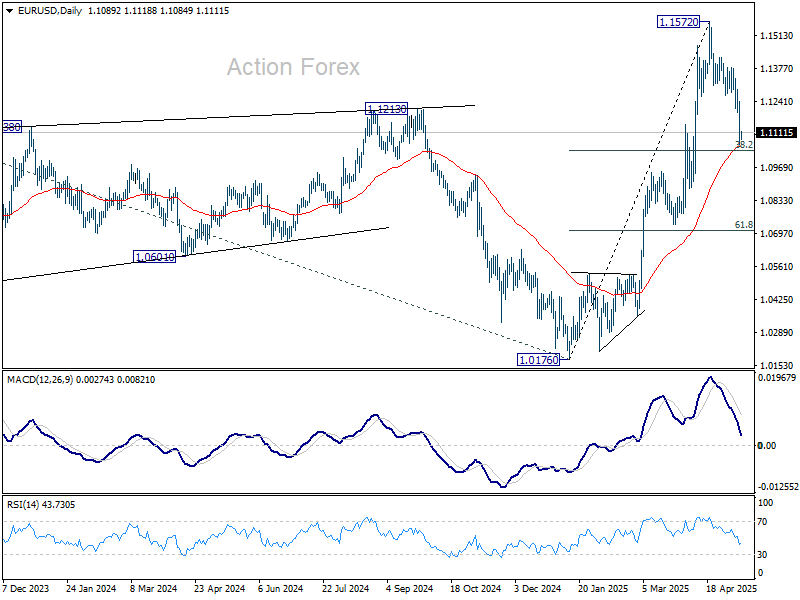
For now, EUR/USD's fall from 1.1572 is still seen as a corrective move. Strong support should be seen from 38.2% retracement of 1.0176 to 1.1572 at 1.1039 to bring rebound. On the upside, break of 1.1380 will suggest that the correction has completed, and bring retest of 1.1572. However, sustained break of 1.1039 will dampen this view and target 61.8% retracement at 1.0709 next.
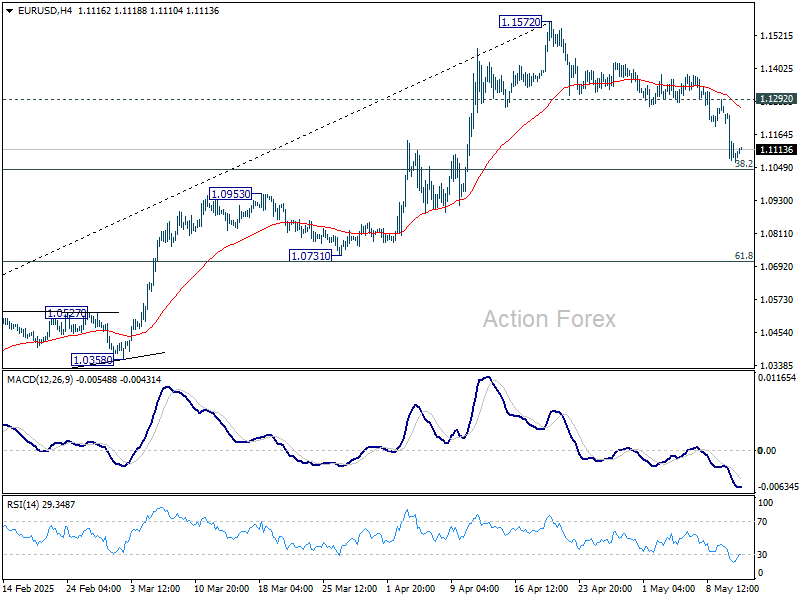
In the bigger picture, rise from 0.9534 long term bottom could be correcting the multi-decade downtrend or the start of a long term up trend. In either case, further rise should be seen to 100% projection of 0.9534 to 1.1274 from 1.0176 at 1.1916. This will now remain the favored case as long as 55 W EMA (now at 1.0789) holds.
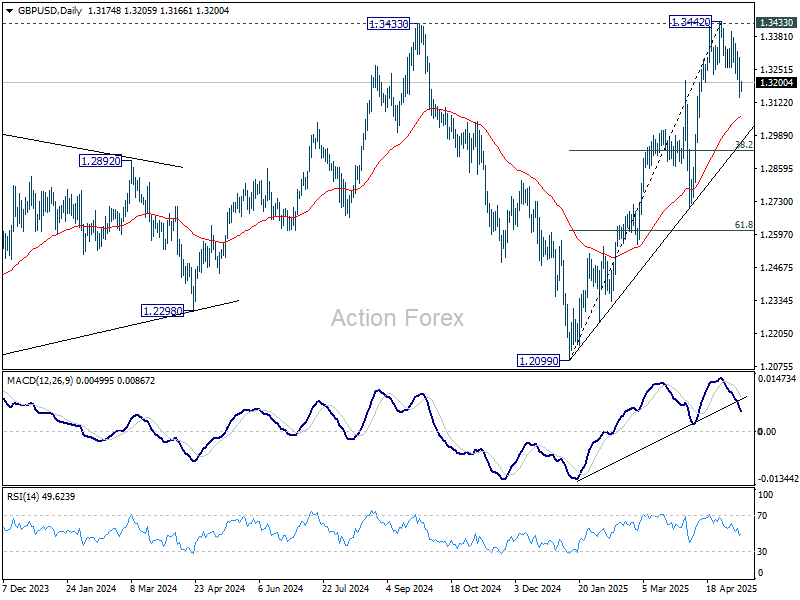
GBP/USD Daily Outlook
Daily Pivots: (S1) 1.3112; (P) 1.3205; (R1) 1.3271; More...
Intraday bias in GBP/USD stays on the downside for the moment. Fall from 1.3442 short term top is in progress to 55 D EMA (now at 1.3067) and below. But downside should be contained by 38.2% retracement of 1.2099 to 1.3442 at 1.2929 to bring rebound. On the upside, above 1.3321 minor resistance will turn intraday bias neutral first.
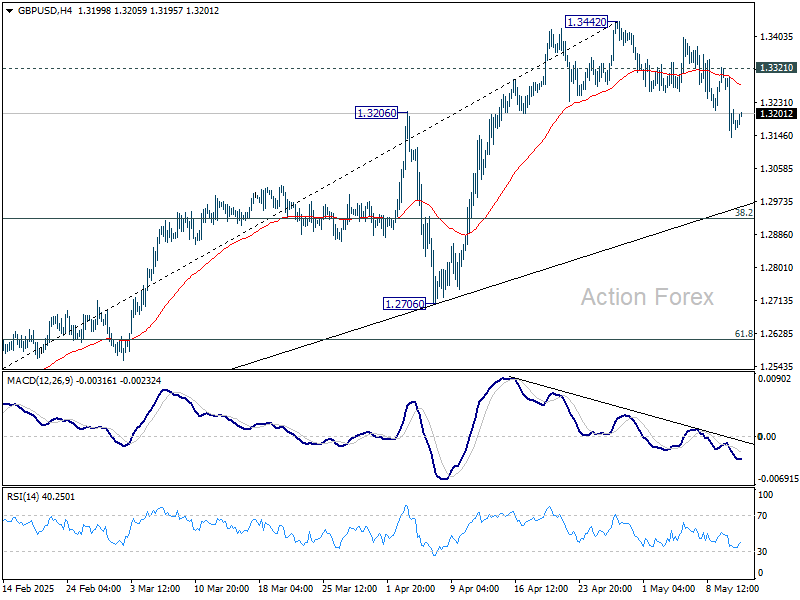
In the bigger picture, price actions from 1.3433 are seen as a corrective pattern to the up trend from 1.3051 (2022 low). Rise from 1.2099 could either be resuming the up trend, or the second leg of a consolidation pattern. Overall, GBP/USD should target 1.4248 key resistance (2021 high) on decisive break of 1.3433 at a later stage.
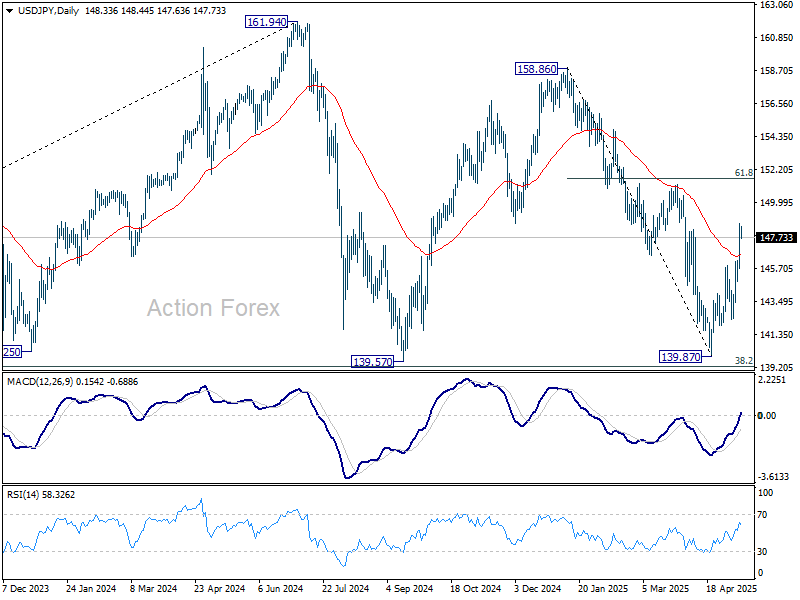
USD/JPY Daily Outlook
Daily Pivots: (S1) 146.56; (P) 147.61; (R1) 149.50; More...
Intraday bias in USD/JPY remains on the upside for the moment. As noted before, fall from 158.86 could have completed 139.87 already. Further rise should be seen to 61.8% retracement of 158.86 to 139.87 at 151.60 next. On the downside, below 145.70 minor support will turn intraday bias neutral again first.
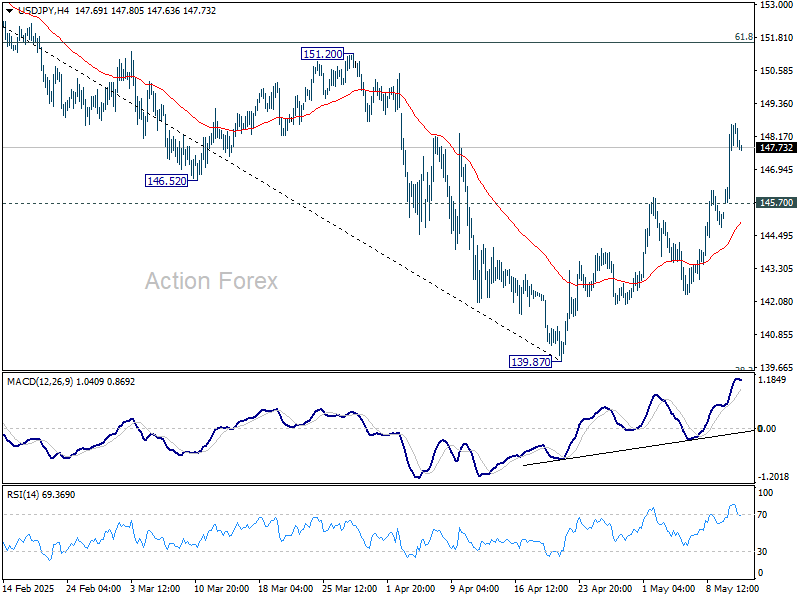
In the bigger picture, price actions from 161.94 are seen as a corrective pattern to rise from 102.58 (2021 low), with fall from 158.86 as the third leg. Strong support should be seen from 38.2% retracement of 102.58 to 161.94 at 139.26 to bring rebound. However, sustained break of 139.26 would open up deeper medium term decline to 61.8% retracement at 125.25.
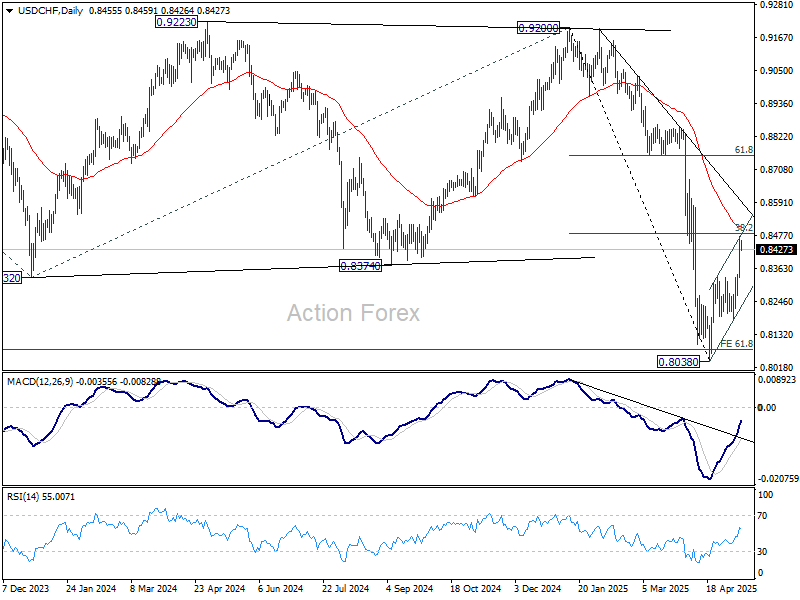
USD/CHF Daily Outlook
Daily Pivots: (S1) 0.8367; (P) 0.8421; (R1) 0.8512; More….
USD/CHF's rebound from 0.8038 is still seen as a corrective move. Strong resistance is expected from 38.2% retracement of 0.9200 to 0.8038 at 0.8482 to limit upside. Break of 0.8330 resistance turned support will turn intraday bias will turn bias back to the downside. Further break of 0.8184 will bring retest of 0.8038 low. However, sustained trading above 0.8482 will dampen this bearish view and target 61.8% retracement at 0.8756 next.
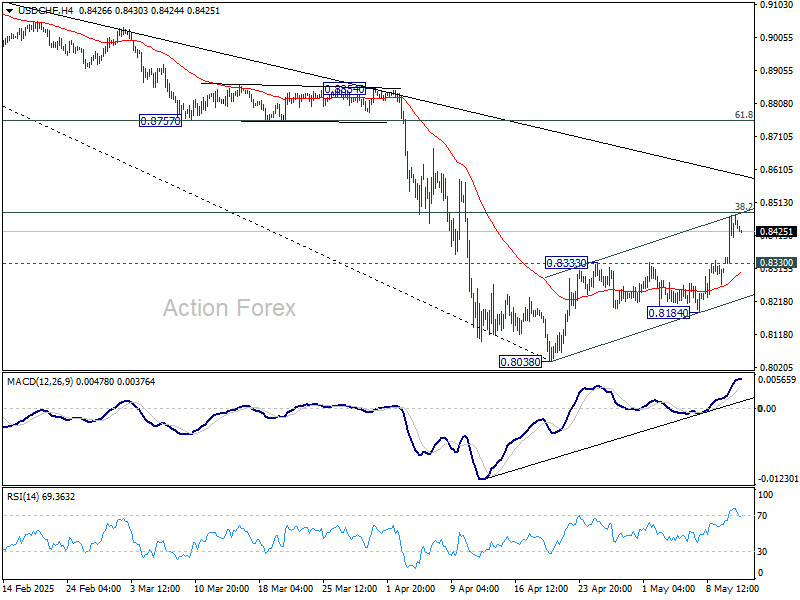
In the bigger picture, long term down trend from 1.0342 (2017 high) is still in progress and met 61.8% projection of 1.0146 (2022 high) to 0.8332 from 0.9200 at 0.8079 already. In any case, outlook will stay bearish as long as 55 W EMA (now at 0.8750) holds. Sustained break of 0.8079 will target 100% projection at 0.7382.
Fed Cut Bets Recede Ahead of US CPI, Dollar Approaches Key Resistance
Global equity markets surged overnight in response to the breakthrough US-China tariff truce, with risk appetite roaring back across the board. DOW jumped more than 1100 points, while S&P 500 and NASDAQ surged 3.26% and 4.35%, respectively. The relief rally extended into Europe, where Germany’s DAX surged to a new record high, reflecting broad optimism that trade tensions have eased significantly—at least for now. In Asia, Japan’s Nikkei jumped nearly 1.8% in early trading as it played catch-up, though the boost faded in Hong Kong where HSI turned lower, signaling some regional caution.
In the currency markets, however, the initial momentum has slowed. Dollar remains the strongest currency for the week so far, supported by rising Treasury yields and expectations that Fed will maintain its high interest rate longer. Commodity currencies like the Australian, Canadian, and New Zealand Dollars are also holding firm, buoyed by improved risk sentiment. Meanwhile, Yen and European majors continue to lag.
The attention now shifts to today’s US April CPI release, which will be the first major inflation print since the April tariff escalation and the subsequent truce. Although the immediate impact of tariffs may not be fully visible yet, any upside surprise could reinforce Fed’s message of caution. While that may further support Dollar, it’s unlikely to significantly dampen the broader risk-on mood, given that markets have already recalibrated expectations following the trade deal.
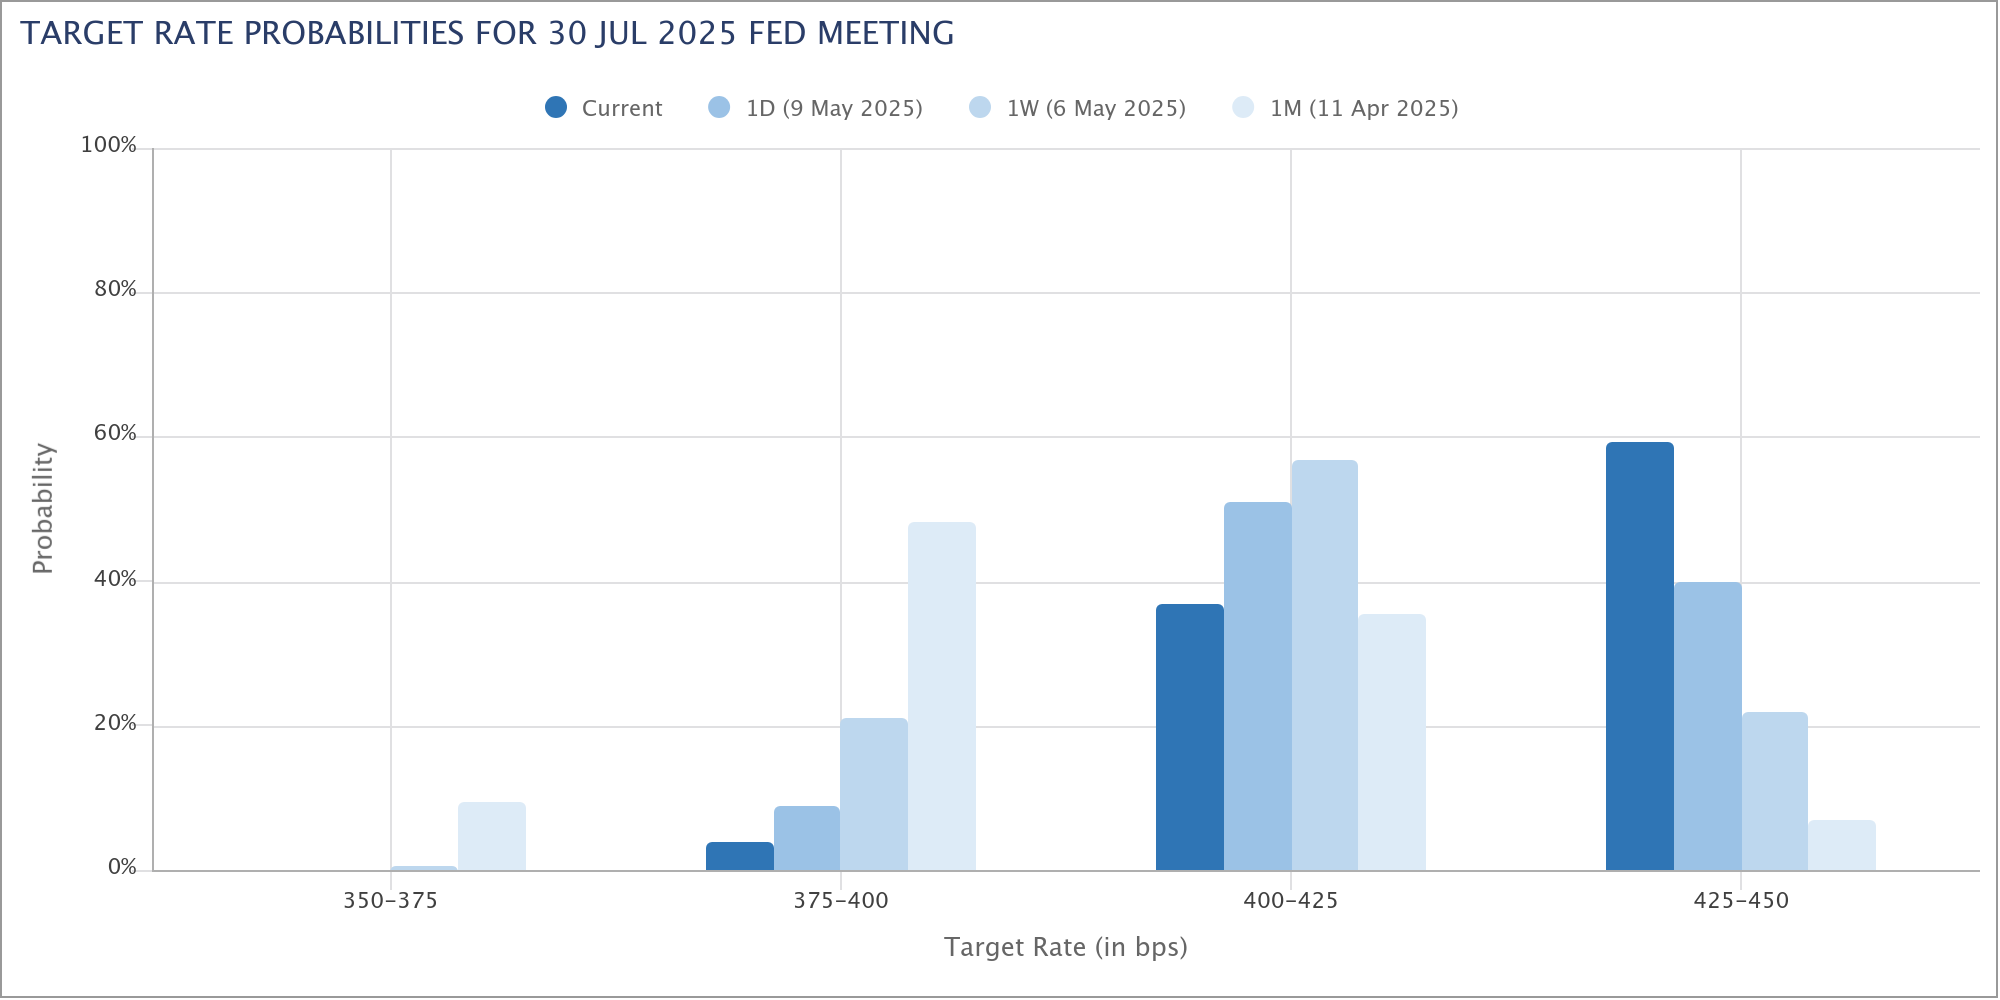
Indeed, Fed fund futures have responded decisively to the latest developments. A week ago, markets were pricing in a 74% chance of a July rate cut. That probability has now dropped sharply to 41% in the wake of the tariff truce. This suggests that traders have already priced in a “higher for longer” Fed policy stance, reducing the likelihood of any sudden repricing unless inflation data comes in meaningfully above expectations.
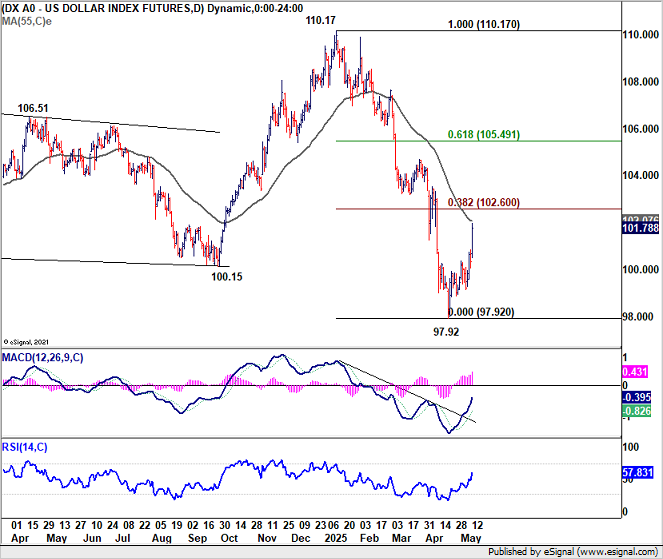
Technically, with yesterday's strong rally, DXY will enter into a key resistance zone ahead, between 55 D EMA (now at 102.07) and 38.2% retracement of 110.17 to 97.92 at 102.60. For now, rebound from 97.92 is still seen as part of a correction to the fall from 110.17. Hence, strong resistance should be seen from 102.07/60 to limit upside, at least on first attempt. However, sustained break of this zone will raise the chance of reversal, and target 61.8% retracement at 105.49 next.
In Asia, at the time of writing, Nikkei is up 1.79%. Hong Kong HSI is down -1.67%. China Shanghai SSE is up 0.08%. Singapore Strait Times is up 0.43%. Japan 10-year JGB yield is up 0.07 at 1.459. Overnight, DOW rose 2.81%. S&P 500 rose 3.26%. NASDAQ rose 4.35%. 10-year yield rose 0.082 to 4.457.
Looking ahead, UK employment data and German ZEW economic sentiment will be the main feature in European session. Later in the day, US CPI is the center of focus.
Fed’s Goolsbee warns tariff truce still carries stagflation risk
Chicago Fed President Austan Goolsbee welcomed the weekend’s US-China tariff agreement as a step in the right direction but cautioned that its limited scope offers only modest relief.
In an interview with the New York Times, he said the temporary 90-day reduction in tariffs would be “less impactful stagflationarily than the path they were on.”
But that still represents a significant burden on the economy. With tariffs remaining three to five times higher than pre-trade war levels, Goolsbee warned the deal would still "make growth slower and make prices rise", hallmarks of a stagflationary environment.
Given the persistent uncertainty surrounding US trade policy, Goolsbee reiterated his support for a wait-and-see approach on interest rates. He noted that the Trump administration’s statements acknowledge the temporary nature of the current truce. "It’s going to be revisited in the near future,” he said.
BoE’s Taylor defends 50bps cut, cites perilous trade climate and weak demand
BoE MPC member Alan Taylor explained his decision to vote for a 50bps rate cut last week, warning that both global and domestic conditions have deteriorated significantly.
He pointed to a “quite perilous” international trade environment, driven in large part by broader-than-expected US tariffs. Also, "the erosion of confidence that we saw has continued", he added, with low readings in business surveys like the PMI and REC, along with signs of increased precautionary saving and delayed investment.
Taylor also called the recent UK-US trade deal “quite slender,” noting that most British exports will still face a 10% tariff, offering little near-term relief for exporters.
Taylor warned that waiting for complete confirmation that all inflation pressures had eased before easing policy further could leave BoE behind the curve.
ECB officials signal cautious path to June cut
Latvian ECB Governing Council member Martins Kazaks indicated overnight that a rate cut in June remains a “pretty possible step,” aligning with market expectations, provided upcoming data confirms progress toward anchoring inflation around the 2% target.
Kazaks added that "gradual cautious cuts could come upon the anchoring of inflation to around the 2% target."
Meanwhile, German and Spanish ECB members Joachim Nagel and Jose Luis Escriva added a note of caution in a joint interview, warning that US President Donald Trump’s aggressive tariff policies have clouded the economic outlook.
“Regarding monetary-policy decisions, it is important to be cautious and not to overreact by overemphasizing specific announcements that could change shortly afterwards,” Nagel emphasized.
BoJ’s Uchida sees temporary inflation pause, but wage growth to persist
BoJ Deputy Governor Shinichi Uchida said today that while Japan’s underlying inflation and medium- to long-term inflation expectations may "temporarily stagnate", wage growth is expected to remain firm as "Japan's job market is very tight."
He added that companies are likely to continue "passing on rising labour and transportation costs by increasing prices".
Uchida also stressed that BoJ will assess the economic impact of US trade policy “without pre-conception,” acknowledging the high degree of uncertainty surrounding the global outlook.
BoJ opinions: Sees tariff risks but maintains flexible rate-hike stance
BoJ’s Summary of Opinions from its April 30–May 1 meeting revealed a generally cautious view on the impact of US tariffs, with board members acknowledging the potential economic damage but not seeing it as enough to derail the pursuit of the 2% inflation target.
One member noted that BoJ may enter a "temporary pause" in rate hikes due to weaker US growth. But it's emphasized that "it shouldn't be too pessimistic".
The member emphasized that rate hikes could resume if conditions improve or US policy shifts.
Other opinions highlighted the high level of uncertainty facing Japan’s economic and price outlook, driven largely by global trade tensions. One board member noted the policy path “may change at any time.”
Another reaffirmed that there has been "no change to the BoJ's rate-hike stance", as projections continue to show inflation reaching the 2% target and real interest rates remain deeply negative.
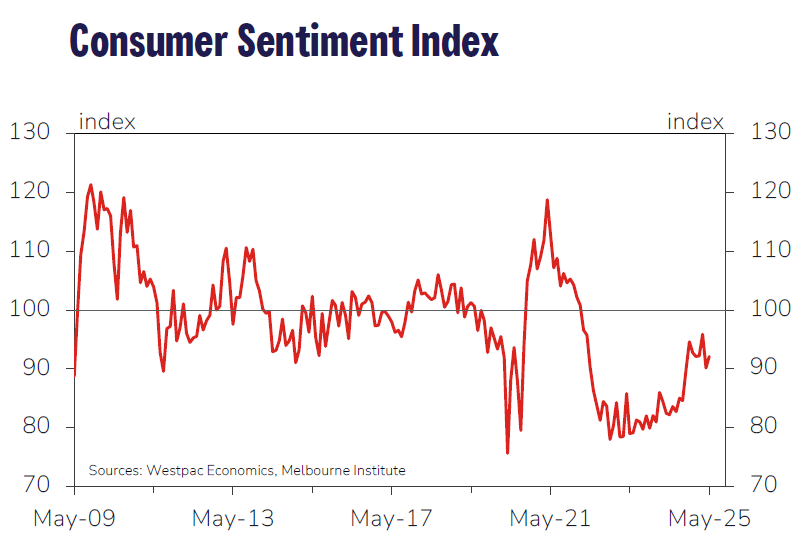
Australian Westpac consumer sentiment rises to 92.1, weak confidence supports RBA cut
Australia’s Westpac Consumer Sentiment Index rose 2.2% to 92.1 in May, partially recovering from April’s sharp decline triggered by trade-related uncertainty.
Westpac attributed the modest rebound to stronger financial markets and a decisive outcome in the Federal election. However, sentiment remains subdued, with the index still 3.9% below its March level and firmly in pessimistic territory.
With all key inflation measures now back within the 2–3% target range, Westpac expects RBA to cut the cash rate by another 25bps to 3.85%. The combination of soft domestic sentiment and a more "unsettled and threatening global backdrop" strengthens the case for further easing.
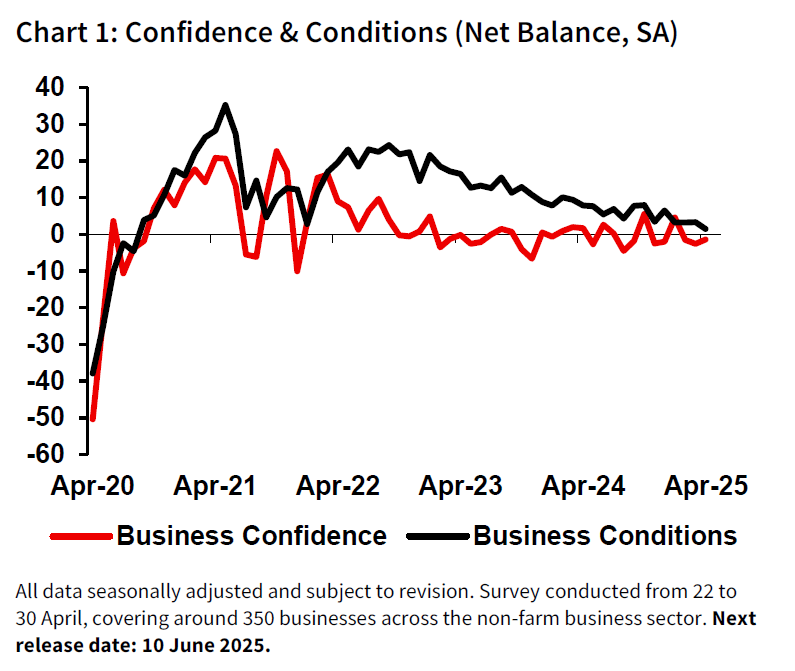
Australia’s NAB business conditions weaken to 2, profit pressures mount
Australia’s NAB Business Confidence Index edged up from -3 to -1 in April. However, the underlying Business Conditions Index slipped from 3 to 2. Trading conditions eased from 6 to 5, while profitability dropped sharply from 0 to -4, highlighting the ongoing strain on margins.
Purchase cost growth accelerated to 1.7% in quarterly equivalent terms, up from 1.4%. Labor cost growth remained elevated at 1.6%. Rising input costs appear to be eroding profitability, with businesses struggling to pass through the full extent of these increases. This was reflected in modest increases in final product and retail price growth, which rose to 0.8% and 1.4% respectively—still below the pace of input cost growth.
NAB Chief Economist Sally Auld noted that weaker profitability was at the core of the drop in business conditions, aligning with the uptick in purchase costs and softer trading performance.
USD/CHF Daily Outlook
Daily Pivots: (S1) 0.8367; (P) 0.8421; (R1) 0.8512; More….
USD/CHF's rebound from 0.8038 is still seen as a corrective move. Strong resistance is expected from 38.2% retracement of 0.9200 to 0.8038 at 0.8482 to limit upside. Break of 0.8330 resistance turned support will turn intraday bias will turn bias back to the downside. Further break of 0.8184 will bring retest of 0.8038 low. However, sustained trading above 0.8482 will dampen this bearish view and target 61.8% retracement at 0.8756 next.
In the bigger picture, long term down trend from 1.0342 (2017 high) is still in progress and met 61.8% projection of 1.0146 (2022 high) to 0.8332 from 0.9200 at 0.8079 already. In any case, outlook will stay bearish as long as 55 W EMA (now at 0.8750) holds. Sustained break of 0.8079 will target 100% projection at 0.7382.
BoJ’s Uchida sees temporary inflation pause, but wage growth to persist
BoJ Deputy Governor Shinichi Uchida said today that while Japan’s underlying inflation and medium- to long-term inflation expectations may "temporarily stagnate", wage growth is expected to remain firm as "Japan's job market is very tight."
He added that companies are likely to continue "passing on rising labour and transportation costs by increasing prices".
Uchida also stressed that BoJ will assess the economic impact of US trade policy “without pre-conception,” acknowledging the high degree of uncertainty surrounding the global outlook.
Australia’s NAB business conditions weaken to 2, profit pressures mount
Australia’s NAB Business Confidence Index edged up from -3 to -1 in April. However, the underlying Business Conditions Index slipped from 3 to 2. Trading conditions eased from 6 to 5, while profitability dropped sharply from 0 to -4, highlighting the ongoing strain on margins.
Purchase cost growth accelerated to 1.7% in quarterly equivalent terms, up from 1.4%. Labor cost growth remained elevated at 1.6%. Rising input costs appear to be eroding profitability, with businesses struggling to pass through the full extent of these increases. This was reflected in modest increases in final product and retail price growth, which rose to 0.8% and 1.4% respectively—still below the pace of input cost growth.
NAB Chief Economist Sally Auld noted that weaker profitability was at the core of the drop in business conditions, aligning with the uptick in purchase costs and softer trading performance.
Australian Westpac consumer sentiment rises to 92.1, weak confidence supports RBA cut
Australia’s Westpac Consumer Sentiment Index rose 2.2% to 92.1 in May, partially recovering from April’s sharp decline triggered by trade-related uncertainty.
Westpac attributed the modest rebound to stronger financial markets and a decisive outcome in the Federal election. However, sentiment remains subdued, with the index still 3.9% below its March level and firmly in pessimistic territory.
With all key inflation measures now back within the 2–3% target range, Westpac expects RBA to cut the cash rate by another 25bps to 3.85%. The combination of soft domestic sentiment and a more "unsettled and threatening global backdrop" strengthens the case for further easing.
Bitcoin Pullback Ahead? Why Short-Term Dip Could Fuel The Next Rally
Key Highlights
- Bitcoin started a major increase above the $100,000 resistance before it faced hurdles.
- BTC/USD traded below a connecting bullish trend line with support at $104,000 on the 4-hour chart.
- Ethereum outperformed with a strong move above the $2,500 level.
- The US CPI could increase by 2.4% in April 2025 (YoY).
Bitcoin Price Technical Analysis
Bitcoin price started a fresh increase above the $95,000 zone against the US Dollar. BTC was able to surpass the $98,000 and $100,000 resistance levels.
Looking at the 4-hour chart, the price settled above the $100,000 level, the 100 simple moving average (red, 4-hour), and the 200 simple moving average (green, 4-hour). However, the bears seem to be active near the $105,500 and $106,000 levels.
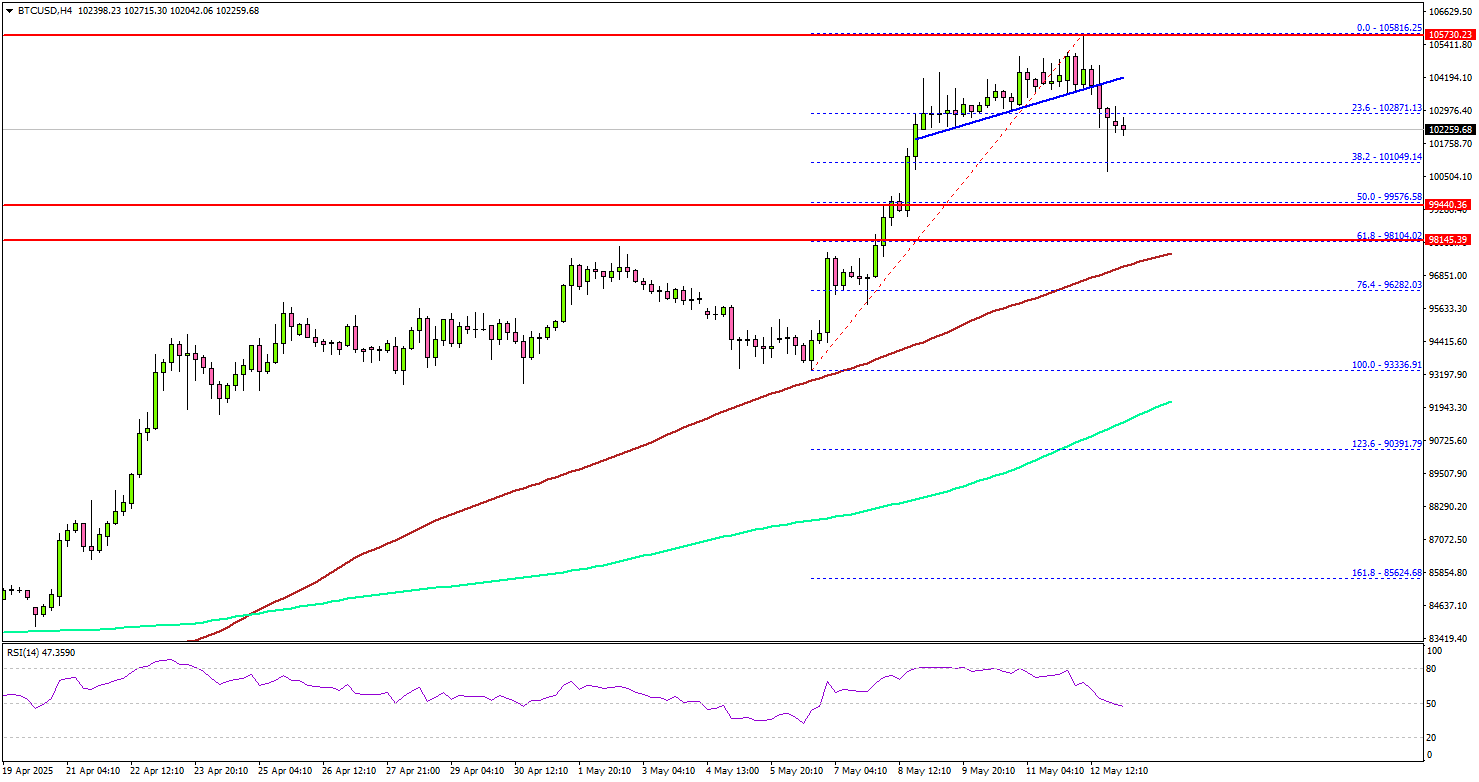
Recently, there was a minor decline below the $104,000 level. BTC/USD traded below a connecting bullish trend line with support at $104,000 on the same chart.
Immediate support is near the $102,200 level. The next key support sits at $99,500 or the 50% Fib retracement level of the upward move from the $93,336 swing low to the $105,816 high.
A downside break below $99,500 might send Bitcoin toward the $98,000 support and the 61.8% Fib retracement level of the upward move from the $93,336 swing low to the $105,816 high. Any more losses might send the price toward the $95,500 support zone.
On the upside, the price could face resistance near the $105,000 level. The next key resistance is $106,000. The main resistance could be $107,500. A successful close above $107,500 might start another steady increase.
In the stated case, the price may perhaps rise toward the $112,000 level. Any more gains might call for a test of $115,000.
Looking at Ethereum, the bulls seem to be in control, and they were able to push the price above the $2,500 resistance zone.
Today’s Economic Releases
- US Consumer Price Index for April 2025 (MoM) – Forecast +0.3%, versus -0.1% previous.
- US Consumer Price Index for April 2025 (YoY) – Forecast +2.4%, versus +2.4% previous.
- US Consumer Price Index Ex Food & Energy for April 2025 (YoY) – Forecast +2.8%, versus +2.8% previous.