
Sample Category Title
Dow Jones Dip, S&P 500 & Nasdaq Rise After Inflation Data
The S&P 500 and Nasdaq rose on Tuesday as investors analyzed new inflation data and considered what it might mean for monetary policy. The Dow Jones was however down as much as 318 points before a slight recovery left the index trading 180 points down from its daily high at the time of writing.
Source: TradingView
Softer US Inflation Keeps Equities on the Front Foot
Inflation in the US dropped to 2.3% in April 2025, the lowest level since February 2021, down from 2.4% in March and below predictions of 2.4%. Energy prices fell by 3.7%, a bigger drop than the 3.3% decline in March.
The CPI (MoM) went up by 0.2% in April, bouncing back from a 0.1% drop in March but below the expected 0.3% increase. Housing costs rose 0.3% and made up more than half of the total monthly rise.
Markets will be breathing a sigh of relief as price hike threats appear to be receding thanks in part to recent trade agreements. There is optimism that more trade agreements are on the way but for now we will have to wait and see.
The question on everyone's lips is what this means for the Federal Reserve and US monetary policy moving forward?
CPI Implications for the Federal Reserve
Prior to today's CPI release, markets had already adjusted their outlook following the latest Federal Reserve meeting. Markets had begun pricing in only two Fed rate cuts this year with today's data likely to reinforce this stance.
Taking a deeper look into the inflation data and there are some interesting takeaways. Firstly, services make up most of the US inflation basket. Goods, excluding food and energy, which are most affected by tariffs, account for only 19.4% of the items used to measure inflation. This means housing and services can help offset any inflation caused by tariffs, which is less worrying now due to the recent easing of tensions with China.
With that in mind, market participants pricing in a first rate cut in September is beginning to look increasingly likely. Inflation should be less of an issue for the Fed moving forward if the current status quo remains as is.
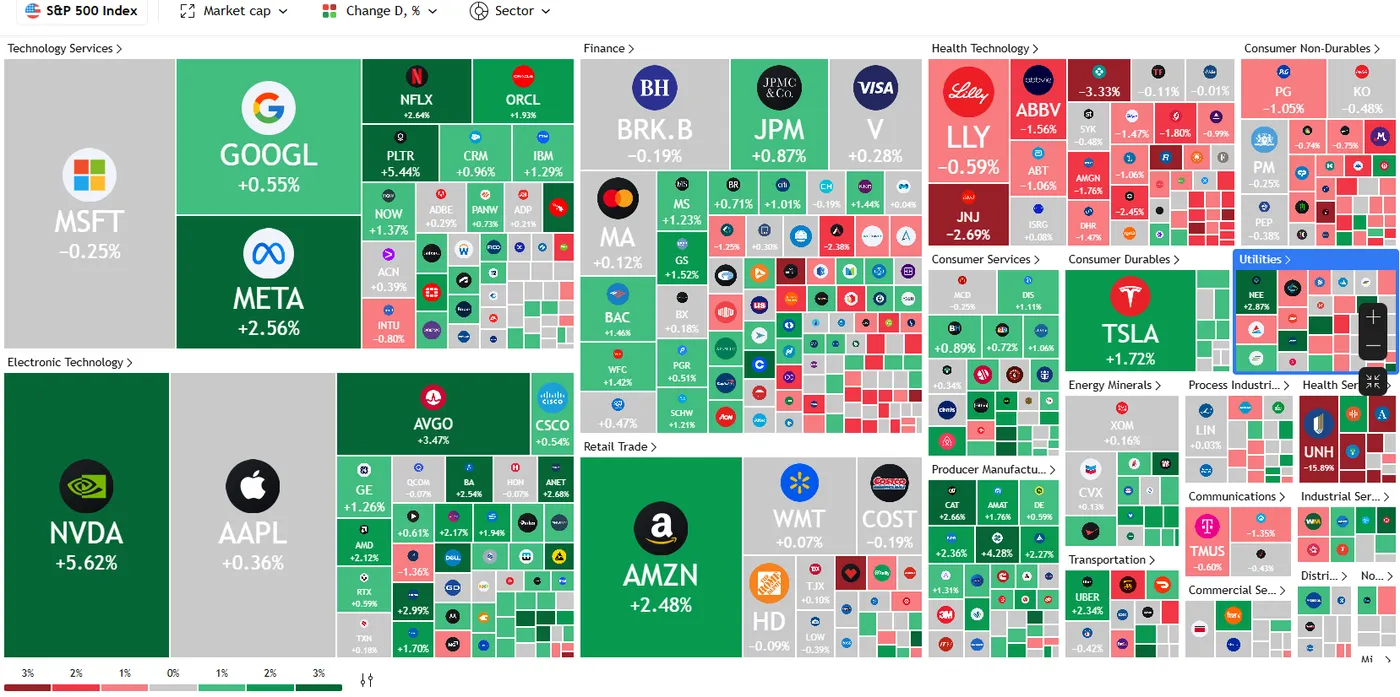
Individual Stocks - Biggest Movers for the Day
Most large-cap and growth stocks rose, with Nvidia up 5.5%, Meta up 2.5% and Amazon 2.4% respectively. Coinbase Global, set to join the S&P 500 on May 19, was a standout performer, surging 15%.
With over 90% of S&P 500 companies having reported earnings, investors now await Walmart's results, expected later this week.
Looking at the Dow Jones and its struggles today, the finger may in part be pointed toward UnitedHealth which dropped around 12%. This came about after the insurer paused its yearly forecast and its CEO resigned.
Technical Analysis - S&P 500
From a technical standpoint, the S&P 500 has gained significant ground over the past two weeks as trade fears subside.
The index now trades above both the 100 and 200-MAs for the first time since February 27,2025 in what could be seen as an ominous sign.
The only thing that bears could keep an eye on is the RSI period 14 which is approaching oversold territory and a host of key levels resting above current price.
There is also the price gap from the weekend which may need to be filled, however price gaps may be filled at any time and there is no guarantee that this will take place anytime soon.
Immediate resistance rests at 5910 before the 6025 handle comes into focus.
If a move to the downside materializes, immediate support rests at 5828 and 5770 respectively.
S&P 500 Daily Chart, May 13, 2025
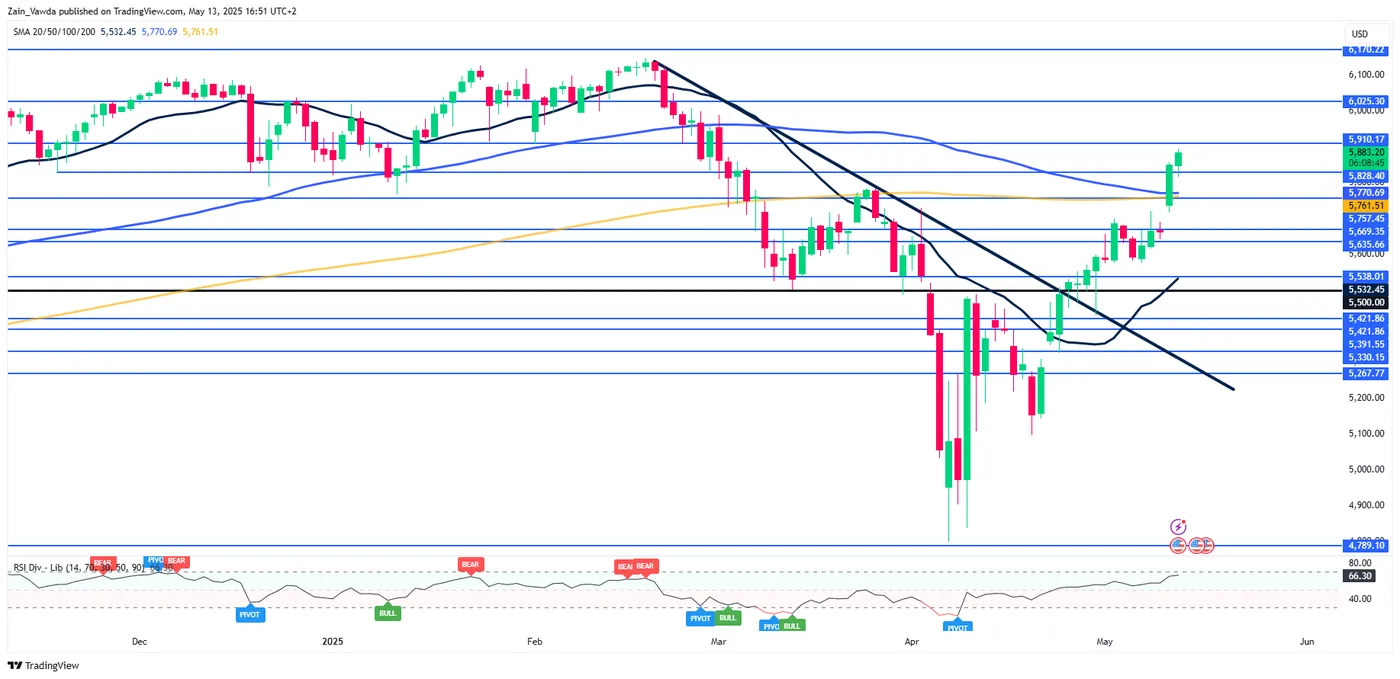
Source: TradingView (click to enlarge)
Elliott Wave Insights: Bitcoin (BTCUSD) Nearing Wave 3 Completion
Since reaching a low of $74,434 on April 7, 2025, Bitcoin (BTCUSD) has surged impressively, climbing in a five-wave impulse structure with an extended (nested) formation. This rally has unfolded in clear stages, as shown on the one-hour chart. From the April 7 low, wave (1) peaked at $86,450, followed by a pullback in wave (2) to $83,102. The cryptocurrency then soared higher in wave (3), which is breaking down into smaller impulsive waves.
Within wave (3), the first sub-wave, wave 1, hit $97,938, followed by a wave 2 dip to $93,376. The cryptocurrency then climbed to $105,706 in wave 3, with the wave 4 pullback likely wrapping up at $100,764. Looking ahead, Bitcoin is expected to continue rising in wave (5). In the near term, wave ((i)) of (5) should complete with one more upward push, followed by a pullback in wave ((ii)) before it resumes higher again. As long as the pivot at $94,496 low holds, any near-term dips should attract buyers in 3, 7, or 11 swings, setting the stage for further upside.
Bitcoin (BTCUSD) 60-Minute Elliott Wave Technical Chart
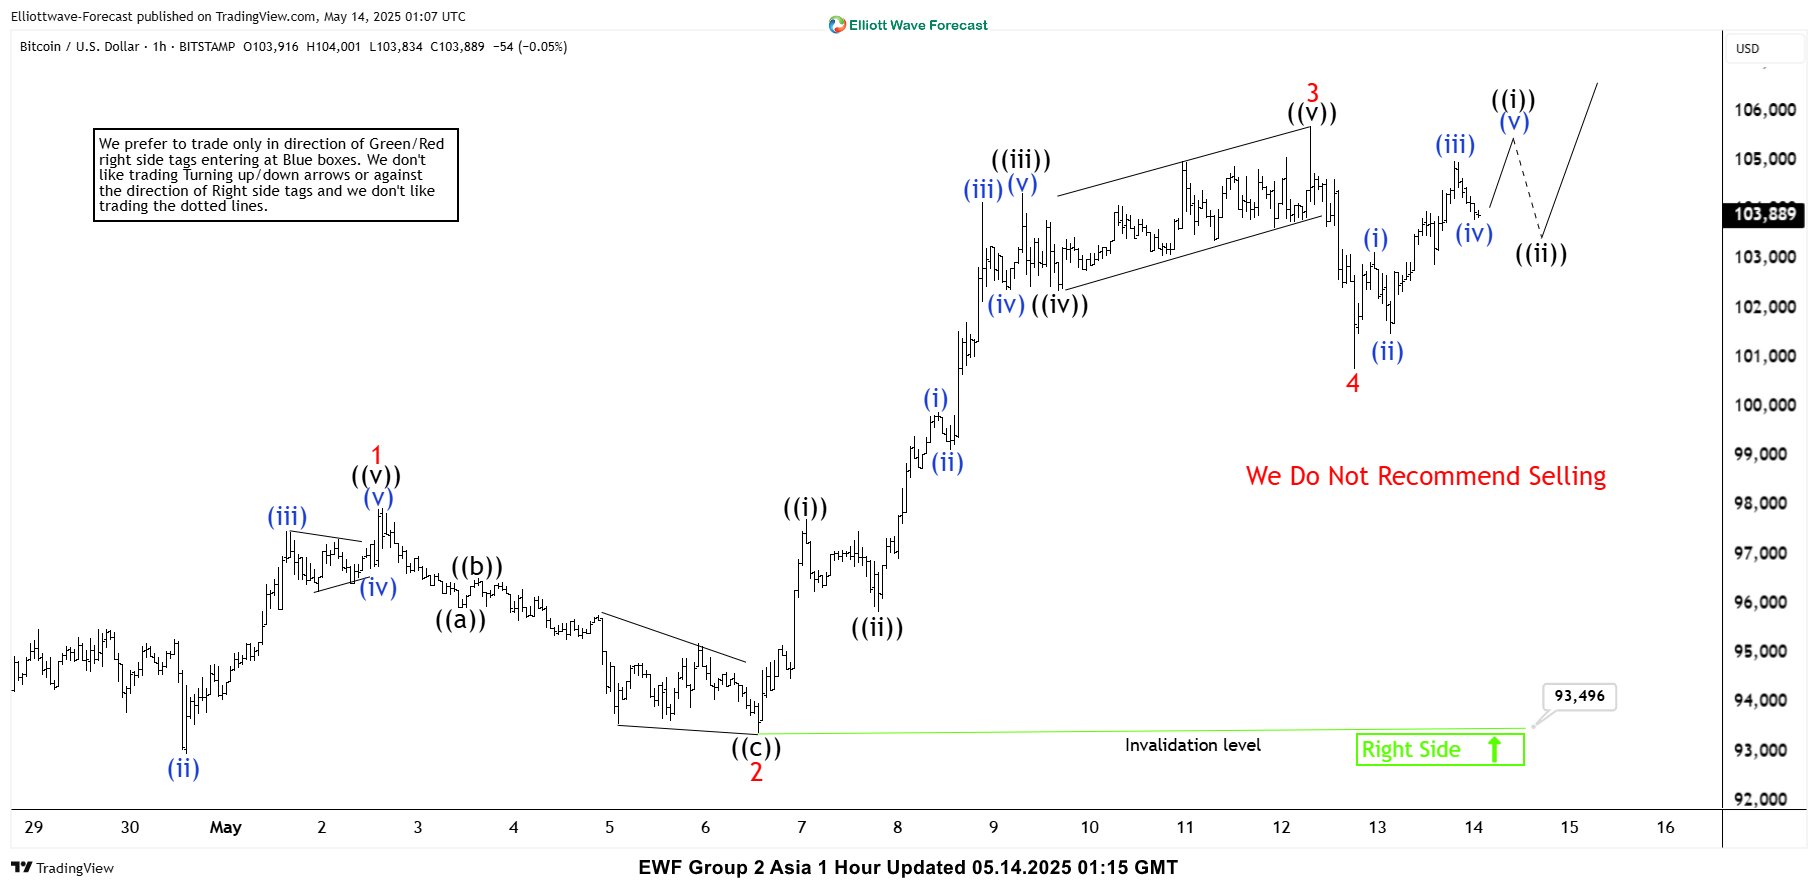
Bitcoin hourly chart showing current wave structure with projected targets and critical support
Video Breakdown: Bitcoin Technical Outlook
https://www.youtube.com/watch?v=X9tbD0Rk6zk
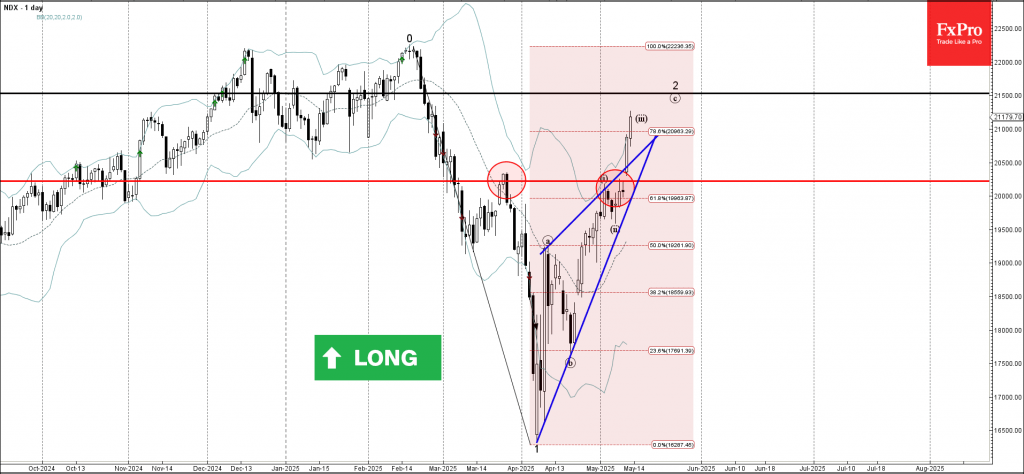
Nasdaq-100 Wave Analysis
Nasdaq-100: ⬆️ Buy
- Nasdaq-100 broke resistance area
- Likely to rise to resistance level 21500.00
Nasdaq-100 index recently broke the resistance area between the resistance level 20220.00 (which has been reversing the index from March) and the resistance trendline of the Ascending Triangle from April.
The breakout of this resistance area accelerated the active short-term ABC correction 2 from last month.
Nasdaq-100 index can be expected to rise to the next resistance level 21500.00 (target price for the completion of the active wave 2).
German Economic Sentiment Rebound Supports the Euro
Business sentiment in Germany improved significantly in May after a sharp drop in April. The ZEW business sentiment index rose from -14.0 to 25.2, well above the average forecast of 10, but remains below the March reading of 51.6.
The improvement in sentiment is due to expectations of positive effects from the promised 800 billion stimulus package, progress in trade disputes, and stabilising inflation. However, the assessment of the current situation remains extremely low, with the index standing at -82, close to its cyclical lows in the current century.
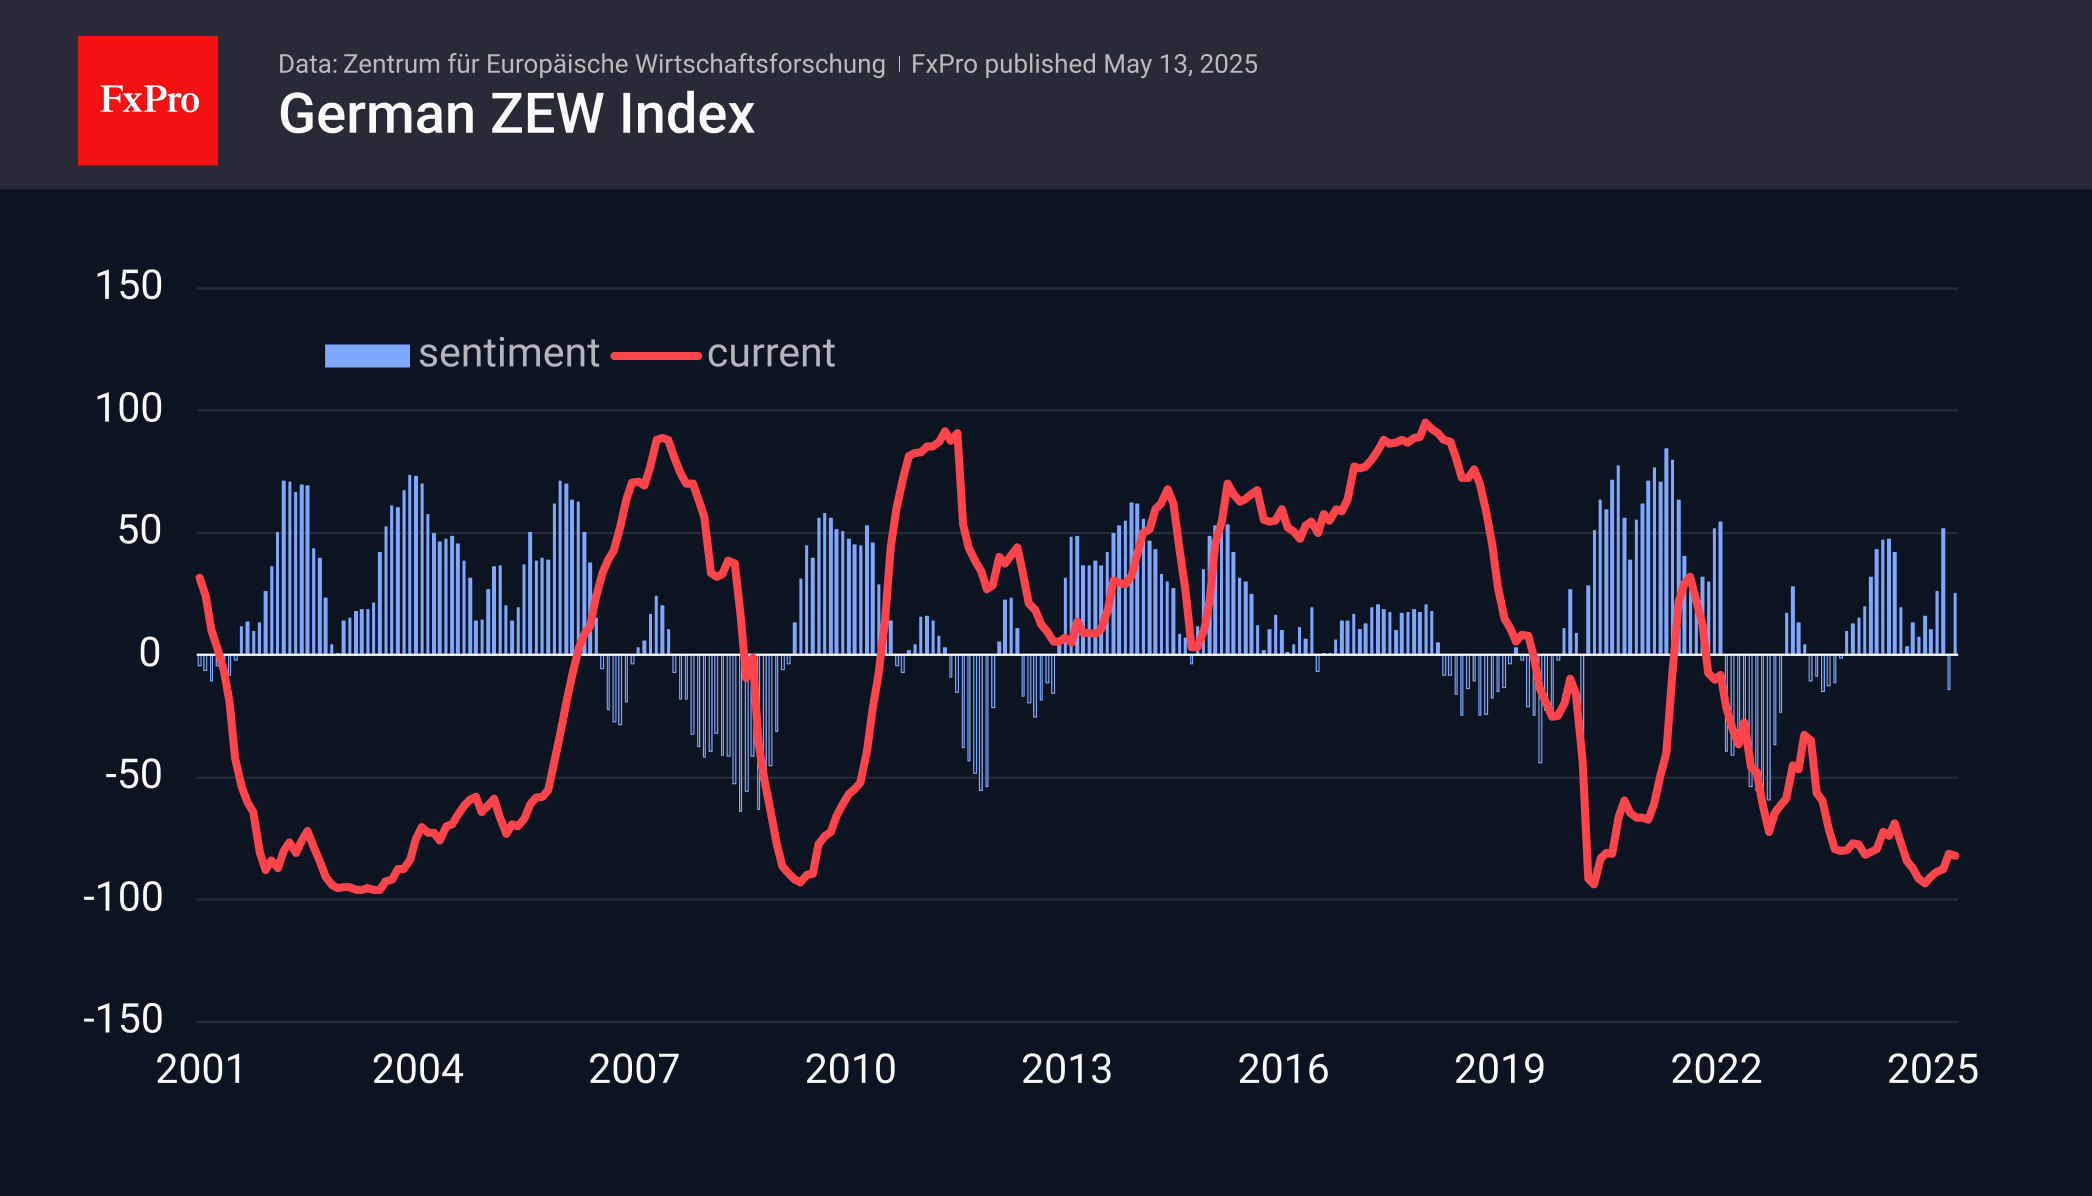
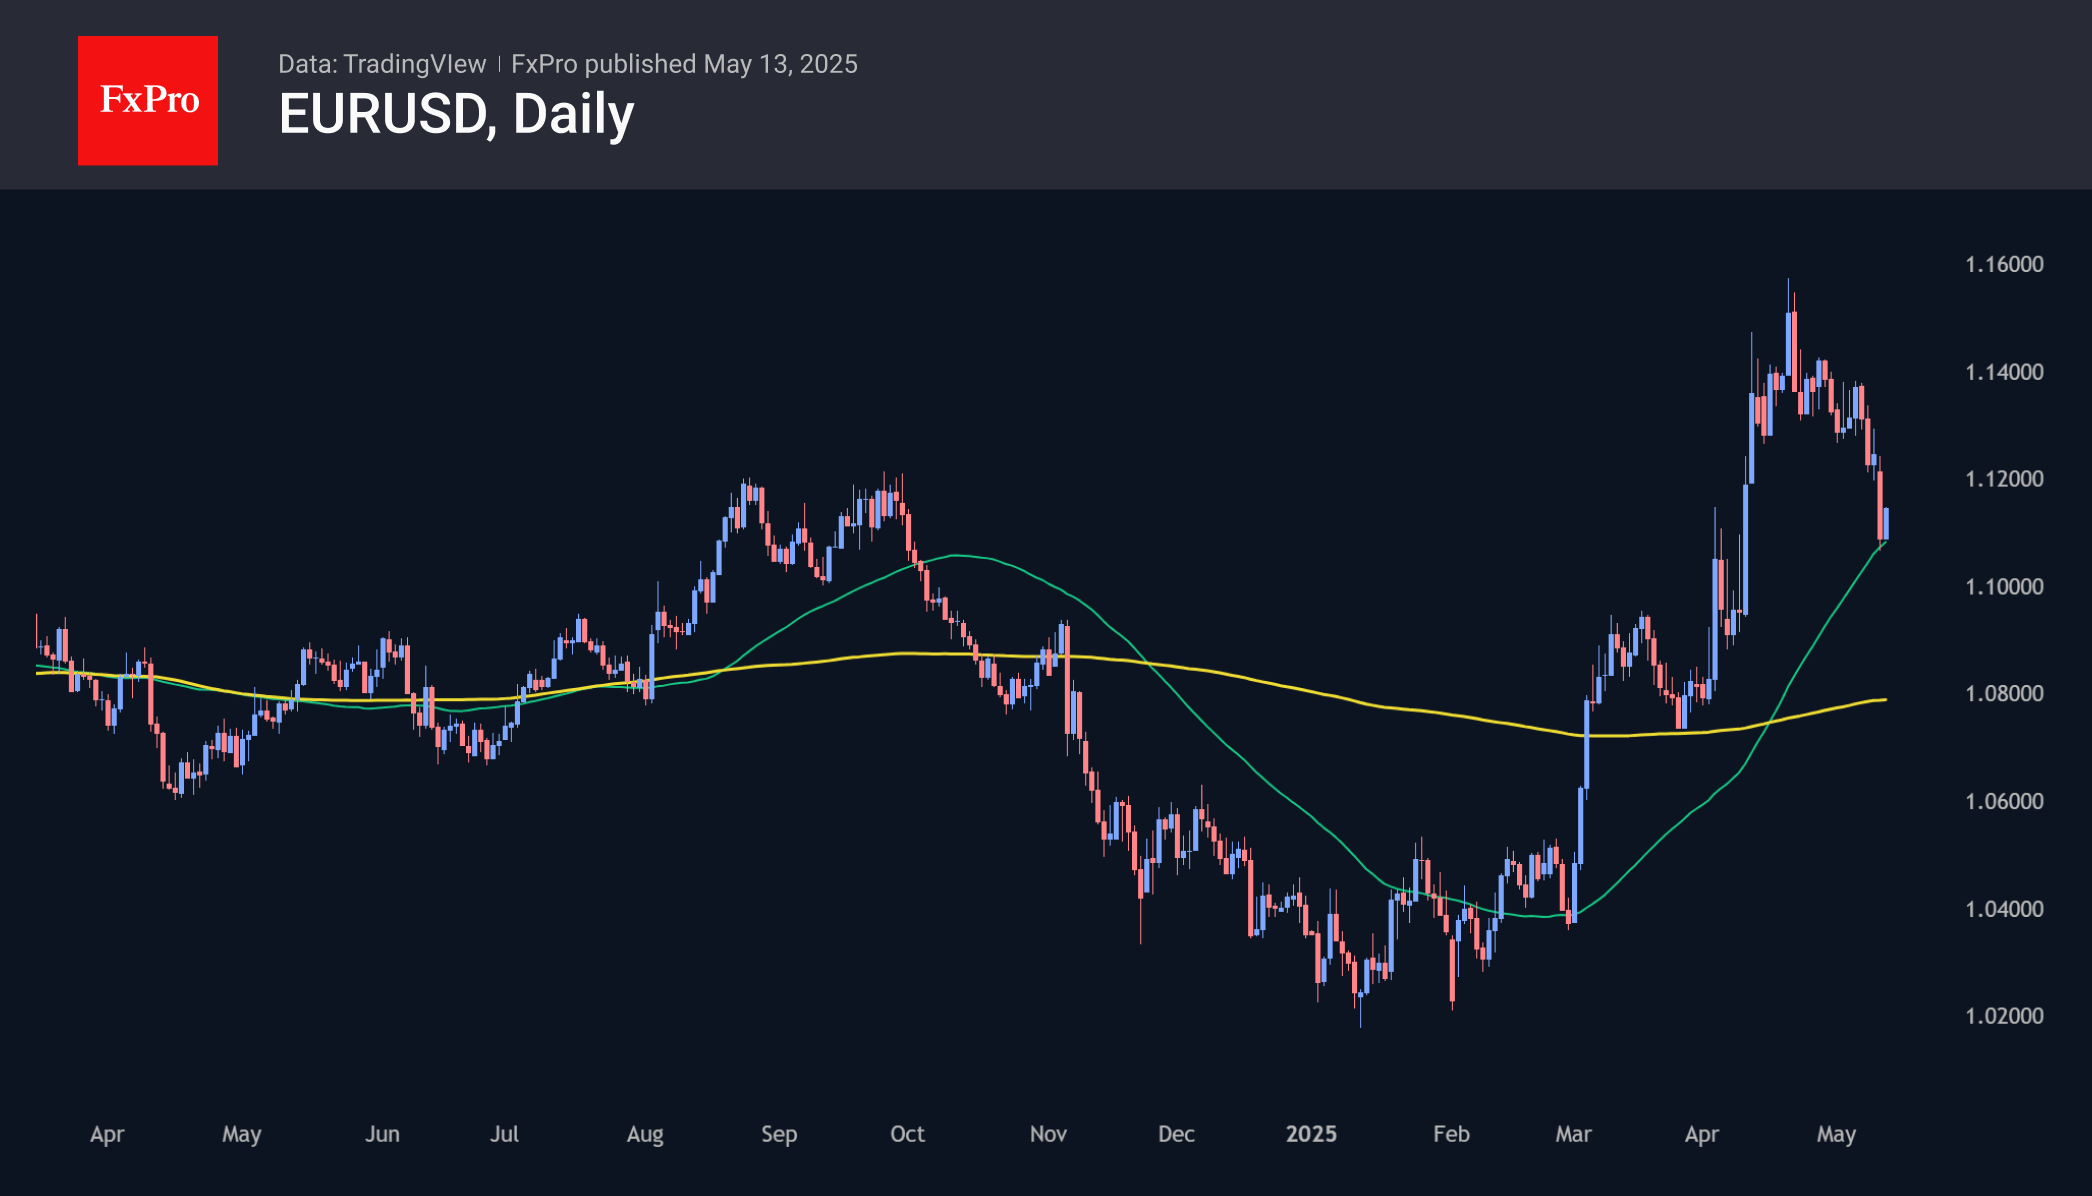
The positive surprise in the business sentiment index creates a favourable news background for the EUR/USD pair, supporting it near the 50-day moving average. This line serves as a benchmark for medium-term dynamics, and a break below it will confirm the breakdown of the last three months’ uptrend. Holding the level of 1.11 indicates the willingness of buyers to continue buying.
Sunset Market Commentary
Markets
The sharp market moves (higher yields, stronger dollar, bullish stocks) on the 90-day US-Sino Chinese trade truce made way for a waiting game today in the run-up to April US CPI numbers. The recent chain of events changed markets’ sensitivity to the inflation data. Ahead of last week’s FOMC meeting and this weekend’s Geneva talks, markets were heavily skewed toward anticipative Fed rate cuts. Such context is/was fertile for downside CPI surprises as they take even more weight off the argument in the other side of the balance. Going into the release, especially upward surprises had market moving potential as they could extend the ongoing (hawkish) repositioning in US money markets. A Fed rate cut is only fully discounted by September. This setting helps explain the modest reaction to slightly softer inflation numbers. From a market stability perspective, it was probably the best possible outcome. Both headline and core CPI rose by 0.2% M/M in April, ducking the 0.3% consensus estimate. On an annual level, headline CPI slowed from 2.4% to 2.3% while core CPI stabilized at 2.8%. Both are the lowest since the spring 2021 inflation breakout, but still above the Fed’s 2% inflation target. Core services less housing rose by 0.2% M/M and 2.7% Y/Y. Other details showed food prices dipping by 0.1% M/M (+2.8% Y/Y; special mention to falling egg prices -12.7% M/M & +49.3% Y/Y), energy prices rising by 0.7% M/M (higher electricity outstripping lower oil; -3.7% Y/Y). Shelter prices were responsible for a big share of the increase, rising by 0.3% M/M (+3.6% Y/Y). Lower used cars and trucks prices (-0.5% M/M; +1.5% Y/Y) and airline fares (-2.8% M/M & -7.9% Y/Y) had an offsetting impact.
US Treasury yields take back up to 3.5 bps (5-yr) from yesterday’s sharp gains. EUR/USD ticked higher from the 1.11-area to 1.1130 at the time writing. US stock markets turned corrective losses in futures trading into small gains thanks to the goldilocks inflation number. German Bunds underperform US Treasuries with German yields up to 2 bps higher at the very long end of the curve. German May ZEW investor sentiment showed a sharp improvement in the forward looking expectations component (25.1 from -14), compensating part of the losses observed in April. ZEW President Wambach said that “With a new government in place, some progress in the tariff disputes and a stabilising inflation rate, optimism has increased”. This morning’s in line with consensus UK labour market data and hawkish comments by BoE Pill left no traces on UK markets with EUR/GBP holding steady just above the 0.84-mark.
News & Views
Reuters citing several ECB policymakers reported that the central bank will likely keep quantitative easing and other stimulus measures as part of its toolkit when inflation and interest rates are at rock bottom. The likes of Belgian central bank governor Wunsch had previously said the ECB should discuss dropping this particular QE reference in the updated official strategy, due to be presented by the summer. Others (Knot, Schnabel) argued that QE should be used in short bursts rather than costly lengthy ones. Large-scale bond buying created huge losses for national central banks once inflation and rates shot up in the wake of the post-pandemic recovery. At least part of it could have been avoided if the ECB wasn’t trapped in its forward guidance to keep rates ultra-low and even negative. Reuters’ sources said that during the May 6-7 retreat there was general agreement that this tool should be used in a more constrained manner. The strategy review will most likely reaffirm the ECB’s commitment to a “symmetric” 2% inflation target.
With today’s release of final April Czech CPI came the central bank’s personal assessment. The final headline number matched the preliminary -0.1% m/m and 1.8% y/y. This slowest pace since March 2018 was possibly related to Easter discounts, which this year took place in April compared to March in 2024. Core inflation rose only slightly to 2.6%. The increase in prices of core goods stopped and offset growth in market services prices (4.5%), leading to an overall more or less stable core CPI y/y print compared to March. The CNB said, however, that with other items on the rise as well, such as holidays and air travel, there’s evidence that services inflation has not fully stabilized and therefore continues to call for a cautious approach to monetary policy. The latter comment should be seen against the backdrop of last week’s (final?) rate cut to 3.5%, which is around the neutral rate. The CNB expects inflation to stay between 2% and 3% in the months ahead.
GBP/USD Mid-Day Outlook
Daily Pivots: (S1) 1.3112; (P) 1.3205; (R1) 1.3271; More...
Intraday bias in GBP/USD is turned neutral with current retreat. On the downside, below 1.3138 will extend the correction from 1.3442 to 55 D EMA (now at 1.3067) and below. But downside should be contained by 38.2% retracement of 1.2099 to 1.3442 at 1.2929 to bring rebound. On the upside, above 1.3321 minor resistance will turn bias back to the upside for retesting 1.3442.
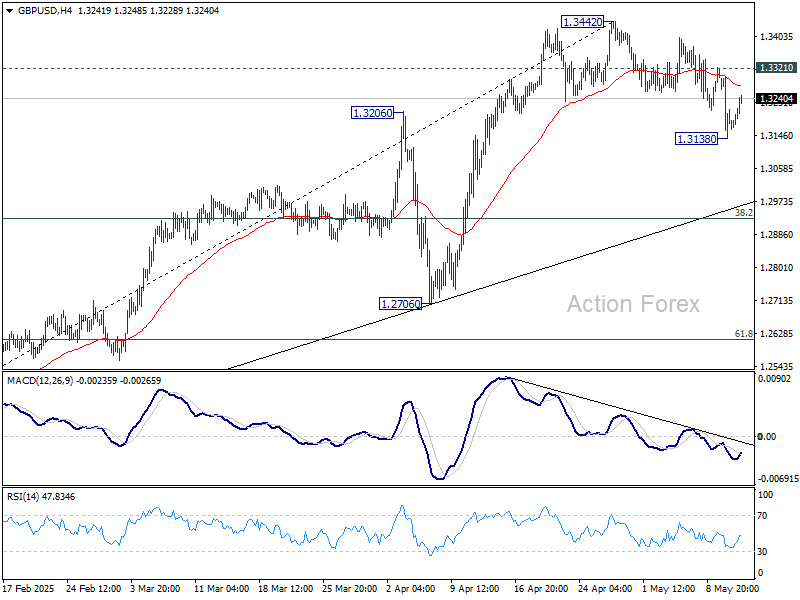
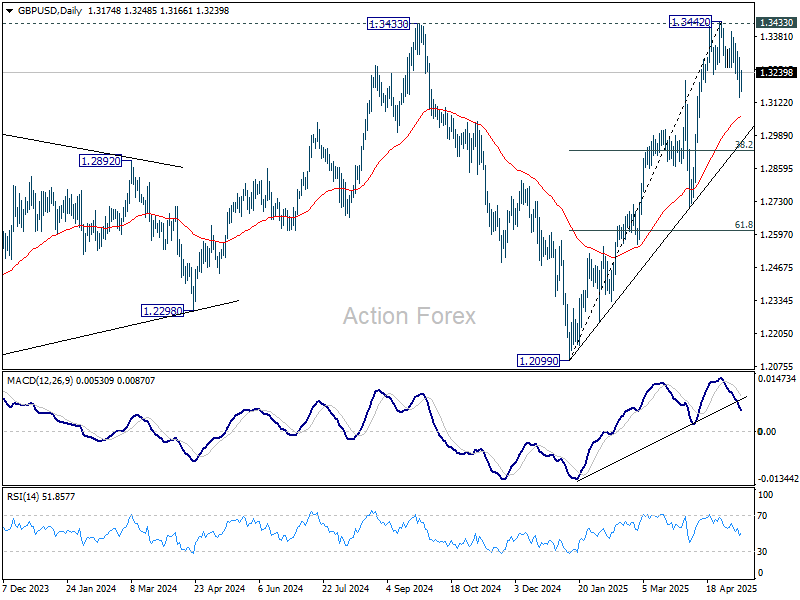
In the bigger picture, price actions from 1.3433 are seen as a corrective pattern to the up trend from 1.3051 (2022 low). Rise from 1.2099 could either be resuming the up trend, or the second leg of a consolidation pattern. Overall, GBP/USD should target 1.4248 key resistance (2021 high) on decisive break of 1.3433 at a later stage.
USD/CHF Mid-Day Outlook
Daily Pivots: (S1) 0.8367; (P) 0.8421; (R1) 0.8512; More….
Intraday bias in USD/CHF is turned neutral with current retreat. Strong resistance is expected from 38.2% retracement of 0.9200 to 0.8038 at 0.8482 to limit upside. Break of 0.8330 resistance turned support will turn intraday bias will turn bias back to the downside. Further break of 0.8184 will bring retest of 0.8038 low. However, sustained trading above 0.8482 will dampen this bearish view and target 61.8% retracement at 0.8756 next.
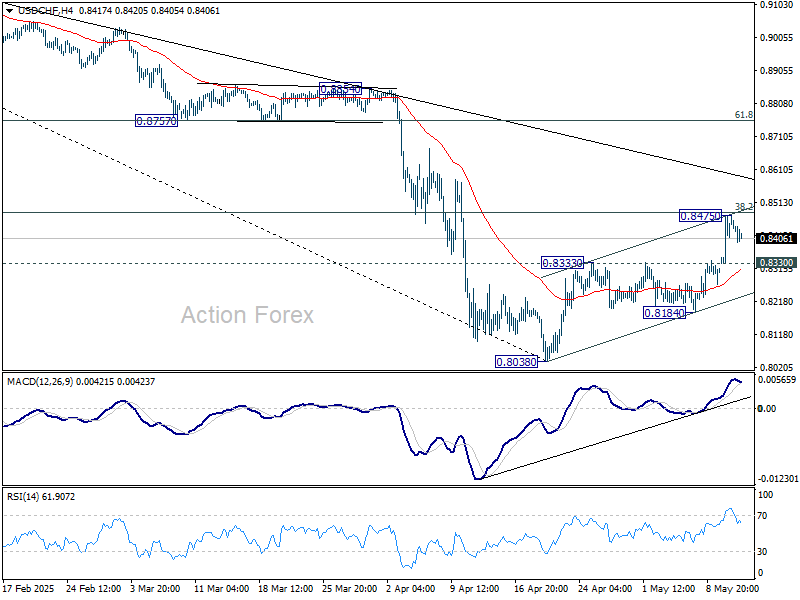
In the bigger picture, long term down trend from 1.0342 (2017 high) is still in progress and met 61.8% projection of 1.0146 (2022 high) to 0.8332 from 0.9200 at 0.8079 already. In any case, outlook will stay bearish as long as 55 W EMA (now at 0.8750) holds. Sustained break of 0.8079 will target 100% projection at 0.7382.
USD/JPY Mid-Day Outlook
Daily Pivots: (S1) 146.56; (P) 147.61; (R1) 149.50; More...
Intraday bias in USD/JPY remains mildly on the upside at this point. As noted before, fall from 158.86 could have completed 139.87 already. Further rise should be seen to 61.8% retracement of 158.86 to 139.87 at 151.60 next. On the downside, below 145.70 minor support will turn intraday bias neutral again first.
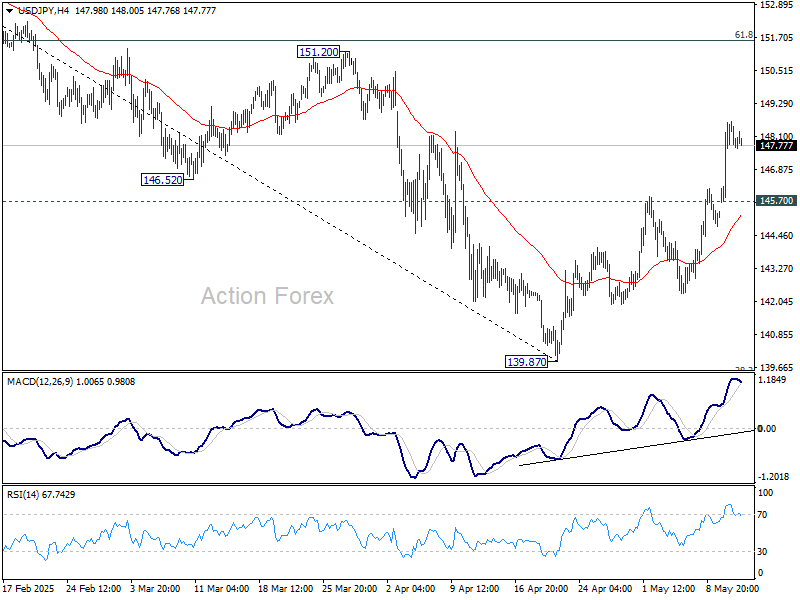
In the bigger picture, price actions from 161.94 are seen as a corrective pattern to rise from 102.58 (2021 low), with fall from 158.86 as the third leg. Strong support should be seen from 38.2% retracement of 102.58 to 161.94 at 139.26 to bring rebound. However, sustained break of 139.26 would open up deeper medium term decline to 61.8% retracement at 125.25.
US: Inflation Turns Higher in April, as Shelter Costs Remain a Key Driver of Price Growth
The Consumer Price Index (CPI) rose 0.2% in April, after falling 0.1% month-on-month (m/m) in March. On a twelve-month basis, CPI was up 2.3% (from 2.4% in March).
- The energy index rose 0.7% m/m, as a jump in electricity and natural gas costs more than offset the pullback in gas prices. Meanwhile, grocery store prices declined 0.4% m/m, with the year-ago measure slowing to 2.0%.
Excluding food and energy, core inflation rose 0.2% m/m, following a cooler than expected 0.06% m/m gain in March. The twelve-month change held at 2.8% for the second consecutive month.
Services prices (+0.3% m/m) rebounded in April, after having recorded its softest monthly gain since August 2021 the month prior.
- Primary shelter costs (+0.4% m/m) remained a key driver of price pressures, though non-housing services (April: +0.1% m/m vs. March: -0.2% m/m) also firmed. This was largely due to a rebound in vehicle insurance premiums (April: +0.7% m/m vs. March: -0.8% m/m) and further gains in medical care services (+0.5% m/m).
- Meanwhile, most discretionary service spending categories including recreational (-0.3% m/m), airfares (-2.8% m/m) and other personal services (-0.4% m/m) recorded price declines last month.
Core goods inflation rose 0.1% m/m, following a modest pullback the month prior. Small gains were seen in household furnishings, medical care products, recreational and other goods.
Key Implications
Price pressures heated up a touch in April, but that was after a very subdued reading the month prior. Most of the uptick was driven by firmer services prices, with higher shelter costs accounting for the nearly two-thirds of the gain in core inflation. And while goods prices also turned higher last month, there was little evidence to suggest that the uptick was driven by President Trump's sweeping tariffs announced at the beginning of April. Efforts by companies to stockpile inventories and a willingness to absorb some of the tariff costs suggests a more incremental strengthening in goods prices is likely to occur over the coming months.
The U.S. and China moved to deescalate trade tensions over the weekend, with both country's agreeing to a 90-day pause on most of the tariffs imposed in April. Unequivocally, this is a step in the right direction. While it will not undo the near-term inflation impacts already in the pipeline, the administration's move to deescalate, and perceived willingness to quickly negotiate new trade deals, should help to limit the economic damage.