
Sample Category Title
USD/CHF Mid-Day Outlook
Daily Pivots: (S1) 0.8367; (P) 0.8415; (R1) 0.8442; More….
Intraday bias in USD/CHF remains neutral for the moment. On the downside, firm break of 0.8333 resistance turned support will argue that corrective rebound from 0.8038 has completed at 0.8475, after rejection by 38.2% retracement of 0.9200 to 0.8038 at 0.8482. Intraday bias will be back on the downside for 0.8184, and then retest of 0.8038 low. However, sustained trading above 0.8482 will dampen this bearish view and target 61.8% retracement at 0.8756 next.
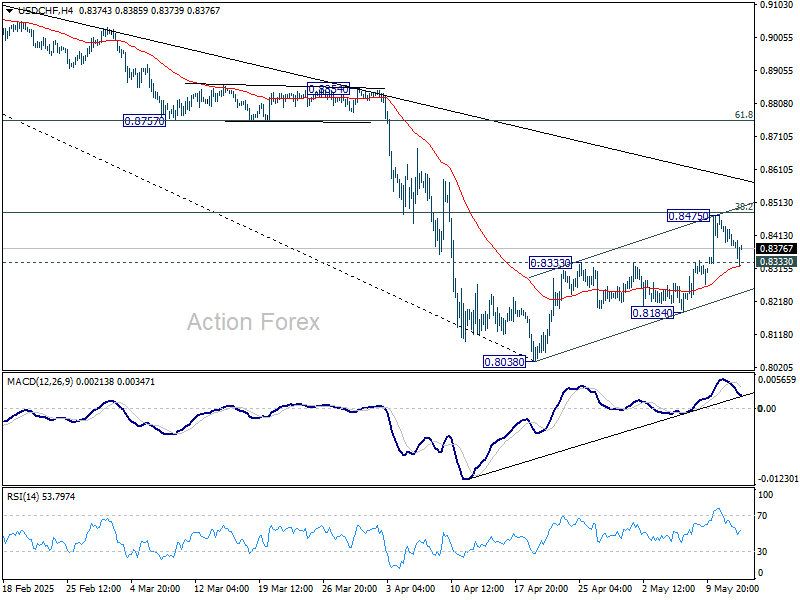
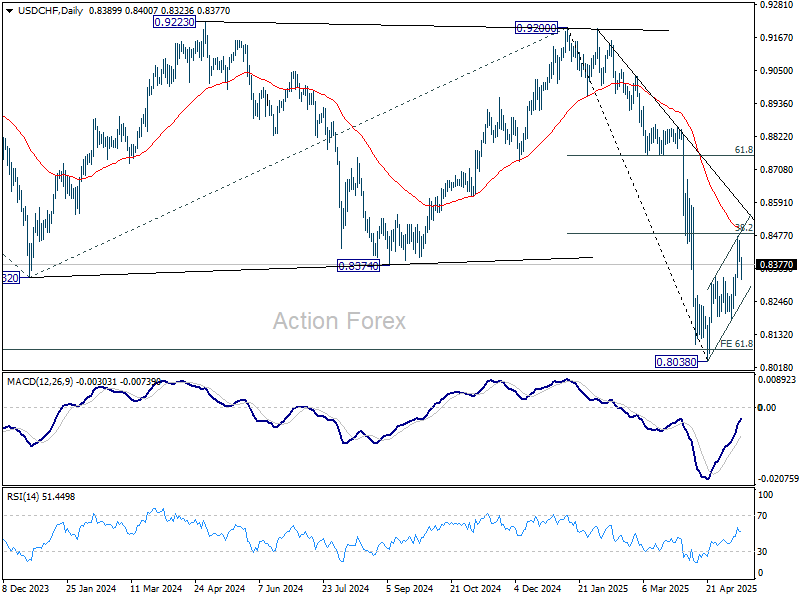
In the bigger picture, long term down trend from 1.0342 (2017 high) is still in progress and met 61.8% projection of 1.0146 (2022 high) to 0.8332 from 0.9200 at 0.8079 already. In any case, outlook will stay bearish as long as 55 W EMA (now at 0.8750) holds. Sustained break of 0.8079 will target 100% projection at 0.7382.
Dollar Steadies After Early Weakness, Focus Turns to Australia Jobs Data
Dollar faced broad selling pressure throughout the Asian and European sessions but has since found some footing as markets transition into the US trading day. However, direction remains murky, with traders appearing undecided on whether to push the greenback higher or extend the recent pullback. A similar tone of uncertainty is mirrored in equities, as European indexes drift sideways and US futures show little conviction. With no major catalysts in the immediate pipeline, both FX and equity markets are likely to stay range-bound until fresh data offers clearer cues.
Attention now turns to Thursday’s key releases, including Australia’s April employment report and the UK’s GDP figures. While Australia’s stronger-than-expected Q1 wage price index suggested some resilience in pay growth, the detail showed continued moderation in the private sector. This is unlikely to derail RBA's expected rate cut next week, as the central bank remains focused on cushioning the economy from tariff-related risks. The upcoming April employment data will be more telling—especially if it deviates significantly from the expected 20.9k job growth and 4.1% unemployment rate. A downside surprise could fuel speculation of faster easing later this year.
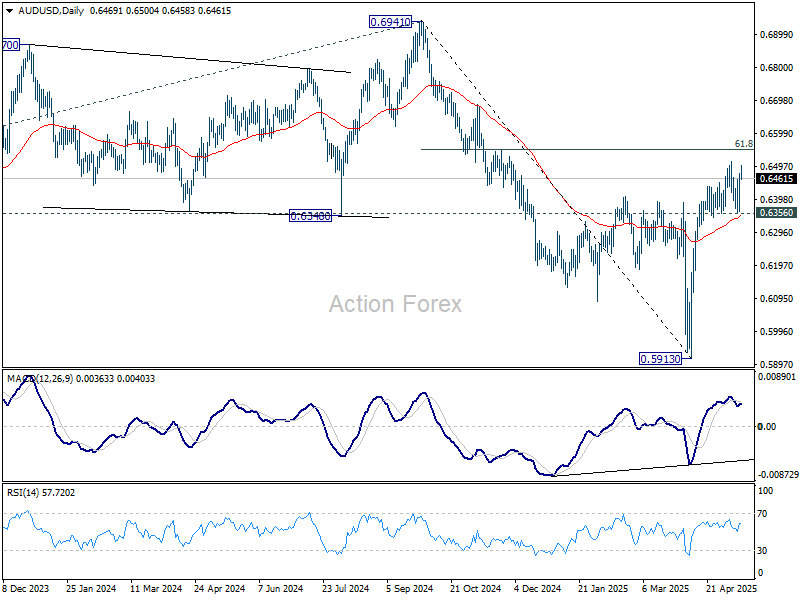
Technically, AUD/USD has struggled to establish momentum, despite a supportive risk-on backdrop. Even if a short-term rally resumes, 61.8% retracement of 0.6941 to 0.5913 at 0.6548 is likely to provide strong resistance to bring at least a near term pullback.
In Europe, at the time of writing, FTSE is up 0.09%. DAX is down -0.18%. CAC is down -0.29%. UK 10-year yield is up 0.039 at 4.715. Germany 10-year yield is up 0.005 at 2.686. Earlier in Asia, Nikkei fell -0.14%. Hong Kong HSI rose 2.30%. China Shanghai SSE rose 0.86%. Singapore Strait Times fell -0.26%. Japan 10-year JGB yield rose 0.008 to 1.457.
Fed’s Goolsbee urges patience amid ‘dusty’ data and tariff uncertainty
Chicago Fed President Austan Goolsbee cautioned against overinterpreting April’s softer inflation data, noting on NPR that it’s still too early to gauge the true impact of rising US import tariffs.
While recent consumer price figures suggest inflation may be easing, Goolsbee stressed that Fed needs more clarity before making firm policy judgments, describing the current environment as one filled with “a lot of dust in the air.”
He acknowledged that the data so far “suggest that it’s going okay,” but emphasized the difficulty of drawing long-term conclusions amid ongoing short-term volatility.
“It’s just not realistic,” he said, “to expect businesses or central banks to be jumping to conclusions” in such an uncertain setting.
ECB’s Nagel stresses Dollar’s global role, cautious on tariff impact ahead of June decision
German ECB Governing Council member Joachim Nagel emphasized the continued importance of the Dollar as a global reserve currency during remarks today. At the same time, he expected that Euro would gradually play a stronger role in the international financial system over the coming years.
Looking ahead to ECB’s June policy meeting, Nagel reiterated that the interest rate decision will be guided by incoming data. He acknowledged the uncertainty surrounding the impact of US tariffs on inflation and growth within the Eurozone.
The updated ECB staff projections, due next month, would be essential in shaping the decision. Nagel also stressed that central banks must increasingly adapt to operating in an environment characterized by persistent geopolitical and policy-driven uncertainty.
BoE hawk Mann: Labor market resilient, and firms yet to lose pricing power
BoE MPC member Catherine Mann explained her notable policy shift during an interview with CNBC, revealing why she moved from backing a 50bps rate cut in February to voting for a hold at last week’s meeting.
Mann cited the UK labor market’s resilience as a key factor in her reassessment. While recent data suggest some moderation "a slowing labor market", she argued that "it is not a non-linear adjustment."
Mann also flagged a new risk emerging from tariffs. She warned that rising US tariffs on countries like China could lead to an influx of diverted exports into markets such as the UK. While this could temporarily ease goods prices at the border, she cautioned that domestic retailers may use the opportunity to rebuild profit margins, keeping upward pressure on consumer price inflation rather than alleviating it.
Crucially, Mann emphasized the need to see a broad-based "loss of pricing power" in firms. "I need to see that firms are starting to be much more moderate in setting their prices across a broad range of products," she added. "Goods price inflation is actually going up, not down."
Japan’s PPI rises 4% yoy in April, record high for 8th straight month
Japan’s PPI rose 4.0% year-on-year in April, easing slightly from 4.3% yoy in March and matching market expectations. Despite the modest slowdown, the index climbed to a fresh record high of 126.3, marking the eighth consecutive month of new highs, highlighting persistent cost pressures at the wholesale level.
However, the data also showed little immediate impact from the sweeping US tariffs announced in early April, thanks in part to the 90-day suspension.
Japan’s Yen-based import price index fell sharply by -7.2% yoy in April, following a -2.4% yoy decline in March. The drop suggests that Yen's appreciation during the market turmoil have helped shield Japanese importers from some of the price shocks, at least for now.
Australian wage growth accelerates to 3.4% yoy in Q1, led by public sector
Australia’s Wage Price Index rose by 0.9% qoq in Q1, slightly above market expectations of 0.8% qoq. Public sector saw a stronger 1.0% qoq gain, outpacing the 0.9% qoq rise in private sector.
On an annual basis, wages grew by 3.4%, up from 3.2% in the previous quarter, marking the first uptick in annual wage growth since mid-2024.
The uptick in annual wage growth was driven primarily by the public sector, which saw a notable increase to 3.6% yoy from 2.9% yoy in Q4. Private sector wage growth was steady at 3.3% yoy.
USD/CHF Mid-Day Outlook
Daily Pivots: (S1) 0.8367; (P) 0.8415; (R1) 0.8442; More….
Intraday bias in USD/CHF remains neutral for the moment. On the downside, firm break of 0.8333 resistance turned support will argue that corrective rebound from 0.8038 has completed at 0.8475, after rejection by 38.2% retracement of 0.9200 to 0.8038 at 0.8482. Intraday bias will be back on the downside for 0.8184, and then retest of 0.8038 low. However, sustained trading above 0.8482 will dampen this bearish view and target 61.8% retracement at 0.8756 next.
In the bigger picture, long term down trend from 1.0342 (2017 high) is still in progress and met 61.8% projection of 1.0146 (2022 high) to 0.8332 from 0.9200 at 0.8079 already. In any case, outlook will stay bearish as long as 55 W EMA (now at 0.8750) holds. Sustained break of 0.8079 will target 100% projection at 0.7382.
Crypto Market Grows on Altcoins
Market Picture
Market capitalisation rose 2.7% in the last 24 hours to $3.38 trillion, with the market reaching $3.40 trillion the previous evening. These are the highest values since early February, driven by increased altcoin buying.
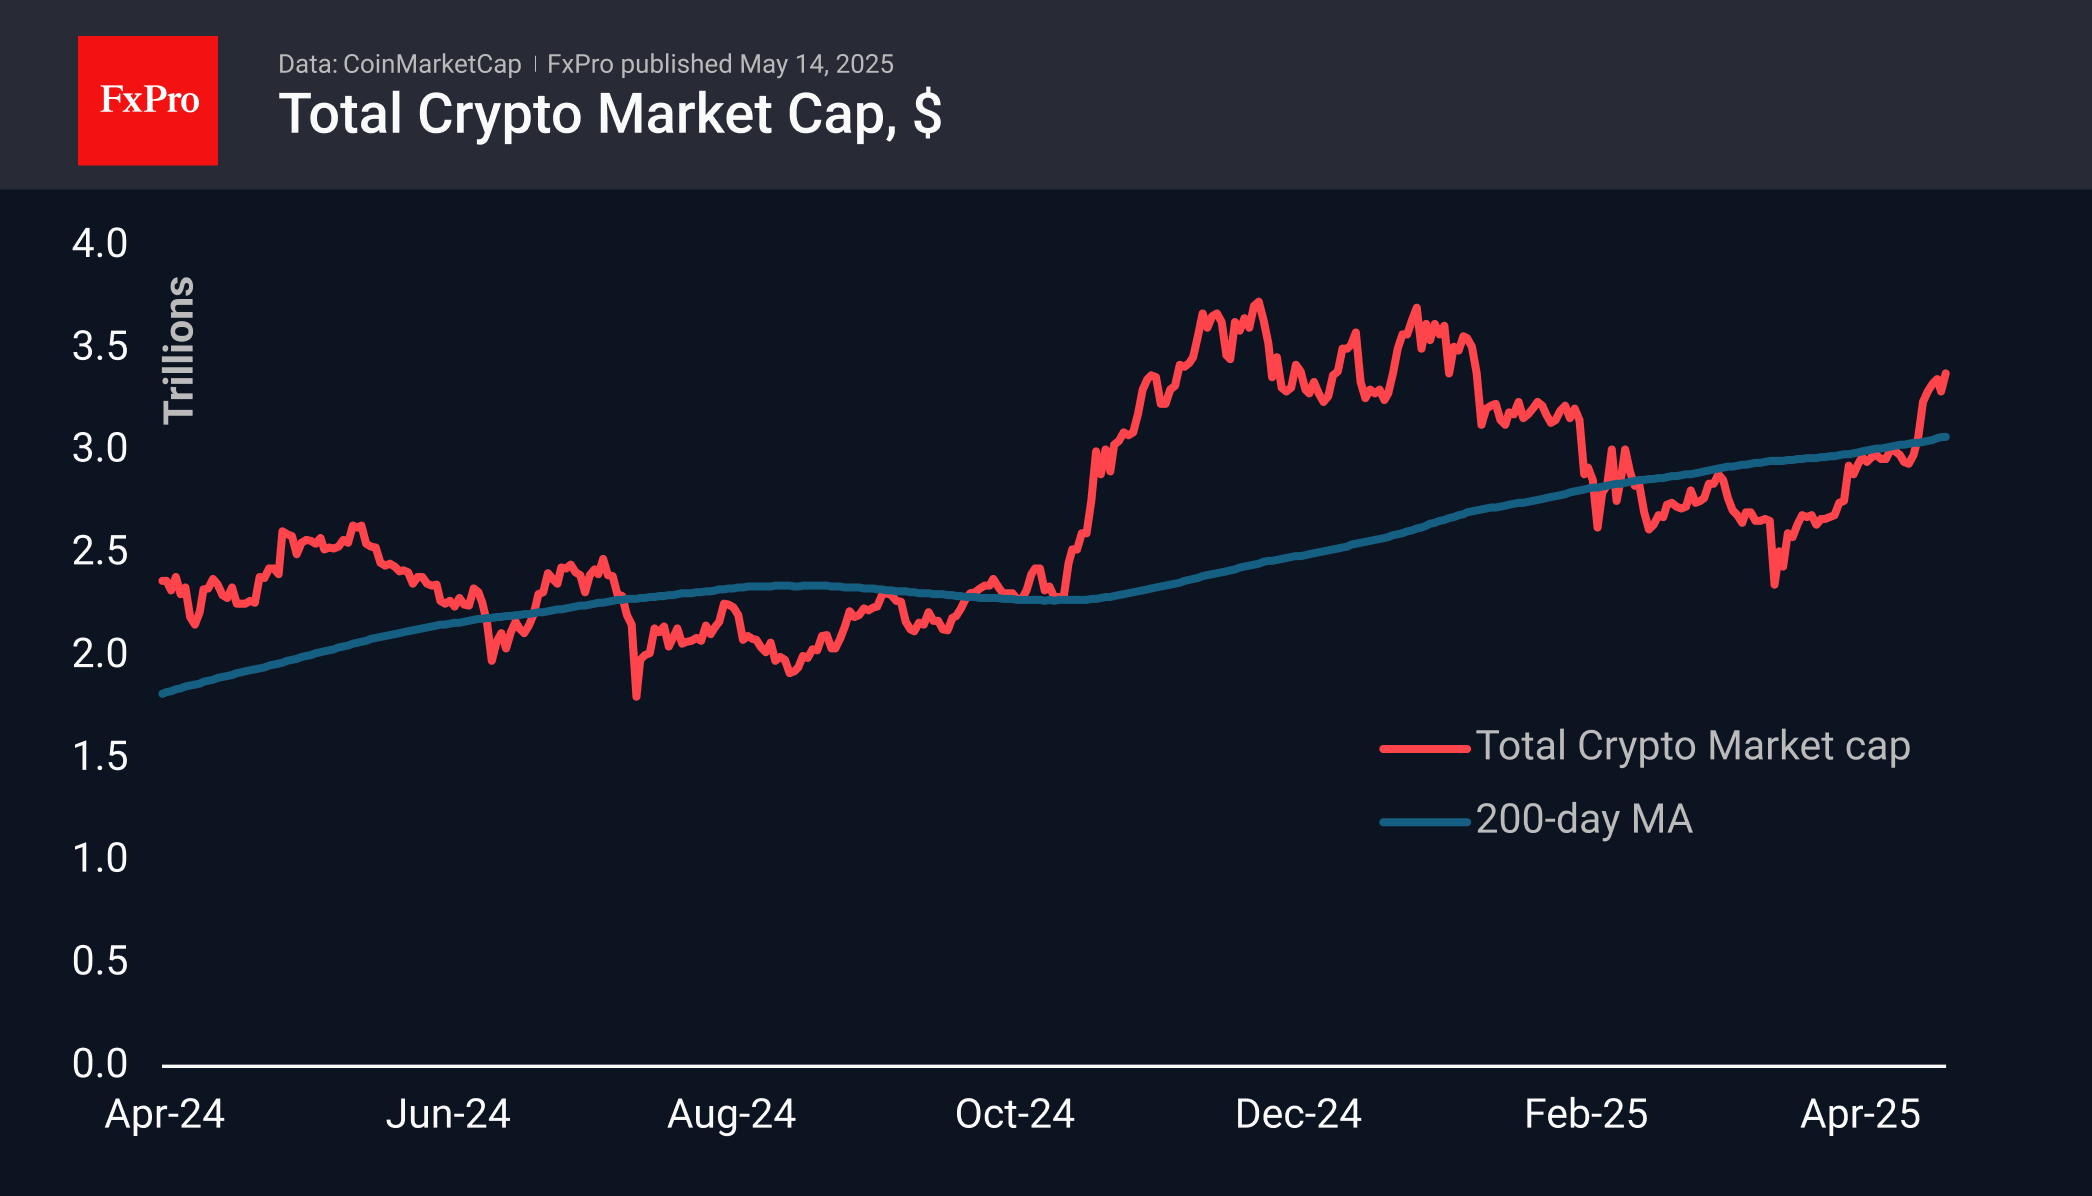
The sentiment index reached 73, indicating that it is approaching extreme greed territory, but remains far from the overbought zone, giving the bulls reason for further gains.
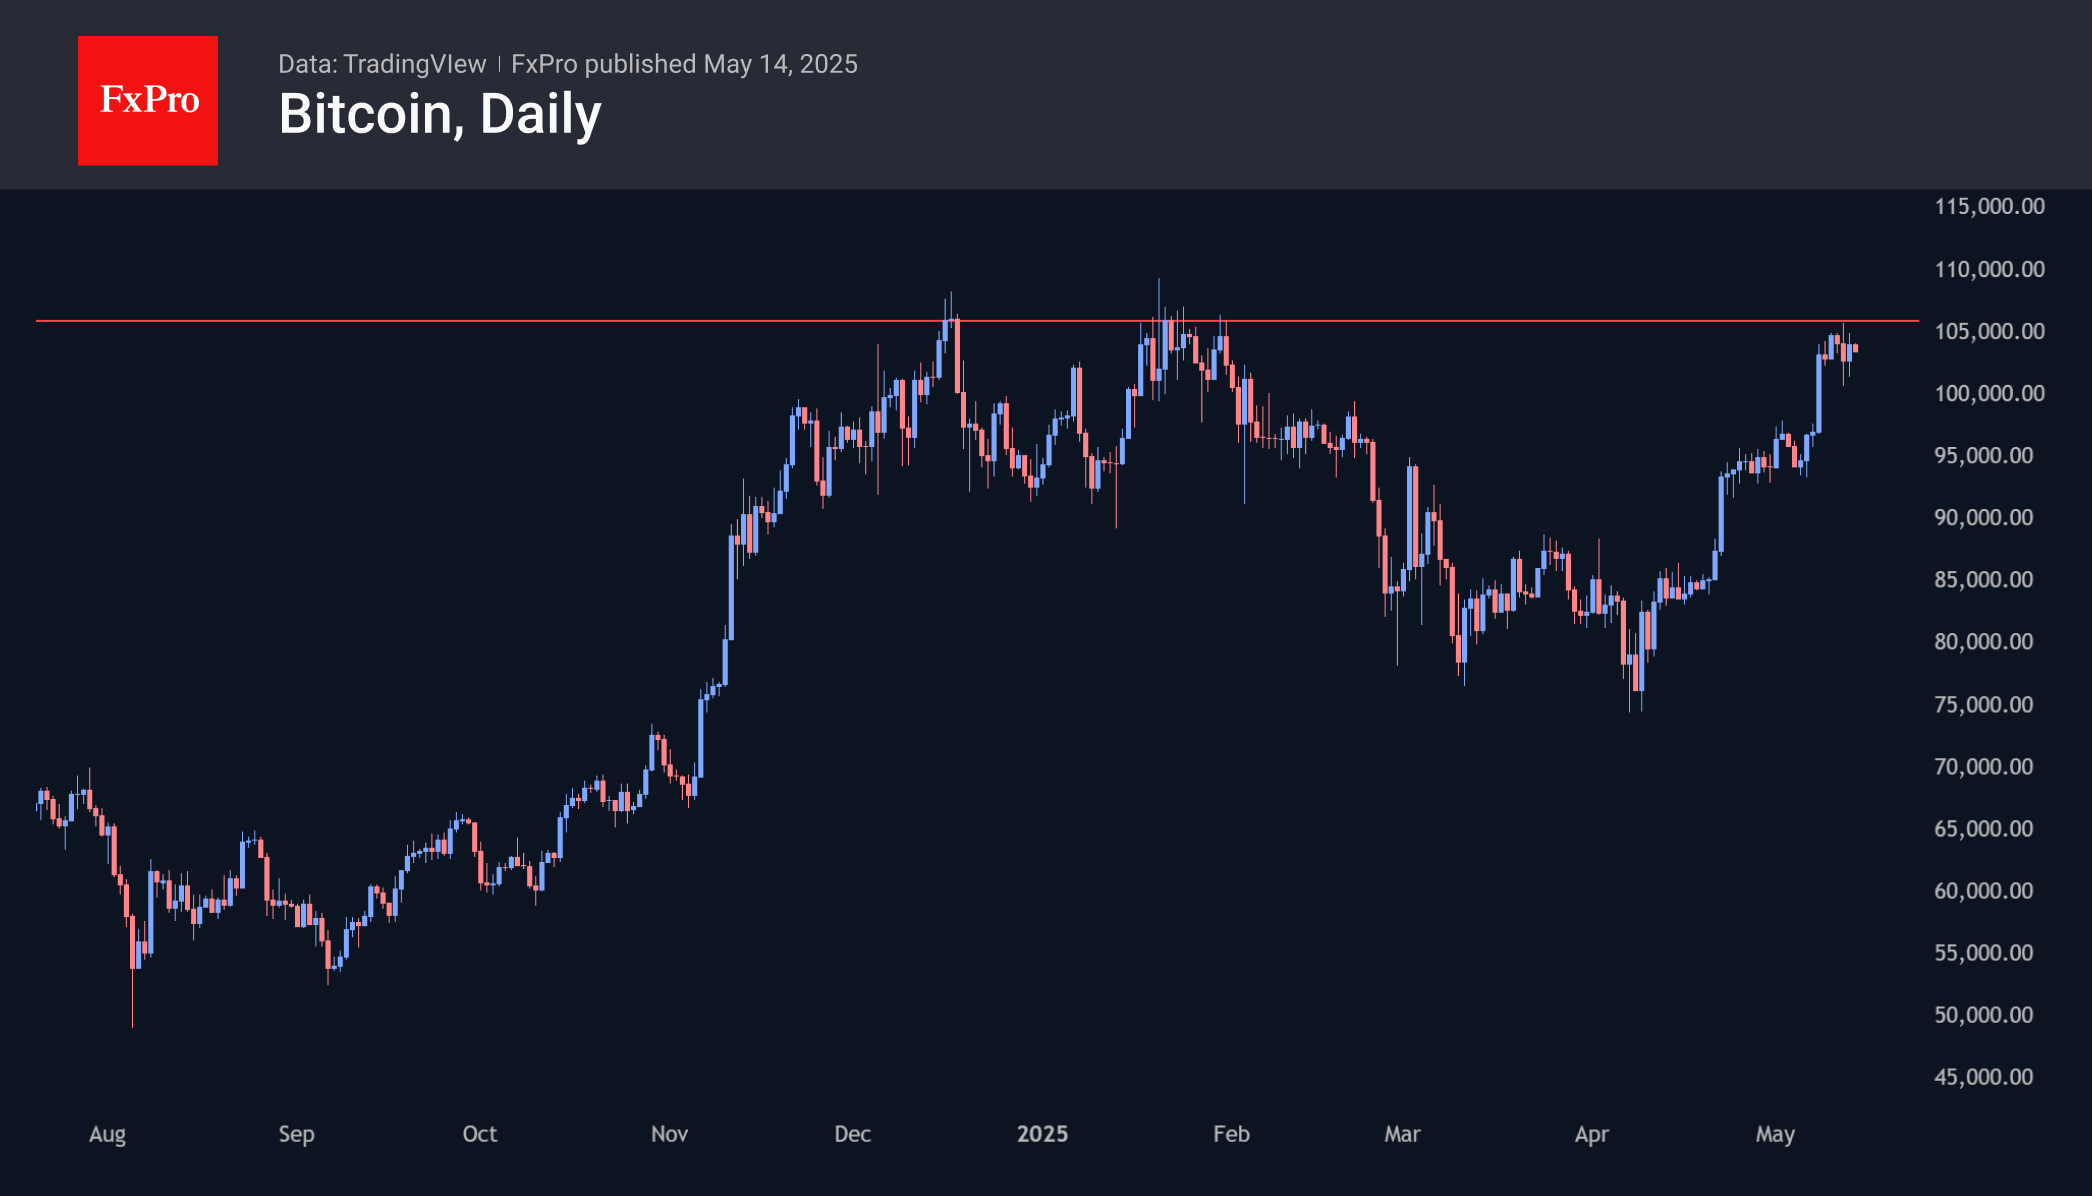
Bitcoin has been hovering around the $104k level for the sixth day
Bitcoin has been hovering around the $104k level for the sixth day, experiencing increased rotation. This is quite expected behaviour as we approach the all-time highs of December and January, which served as turning points.
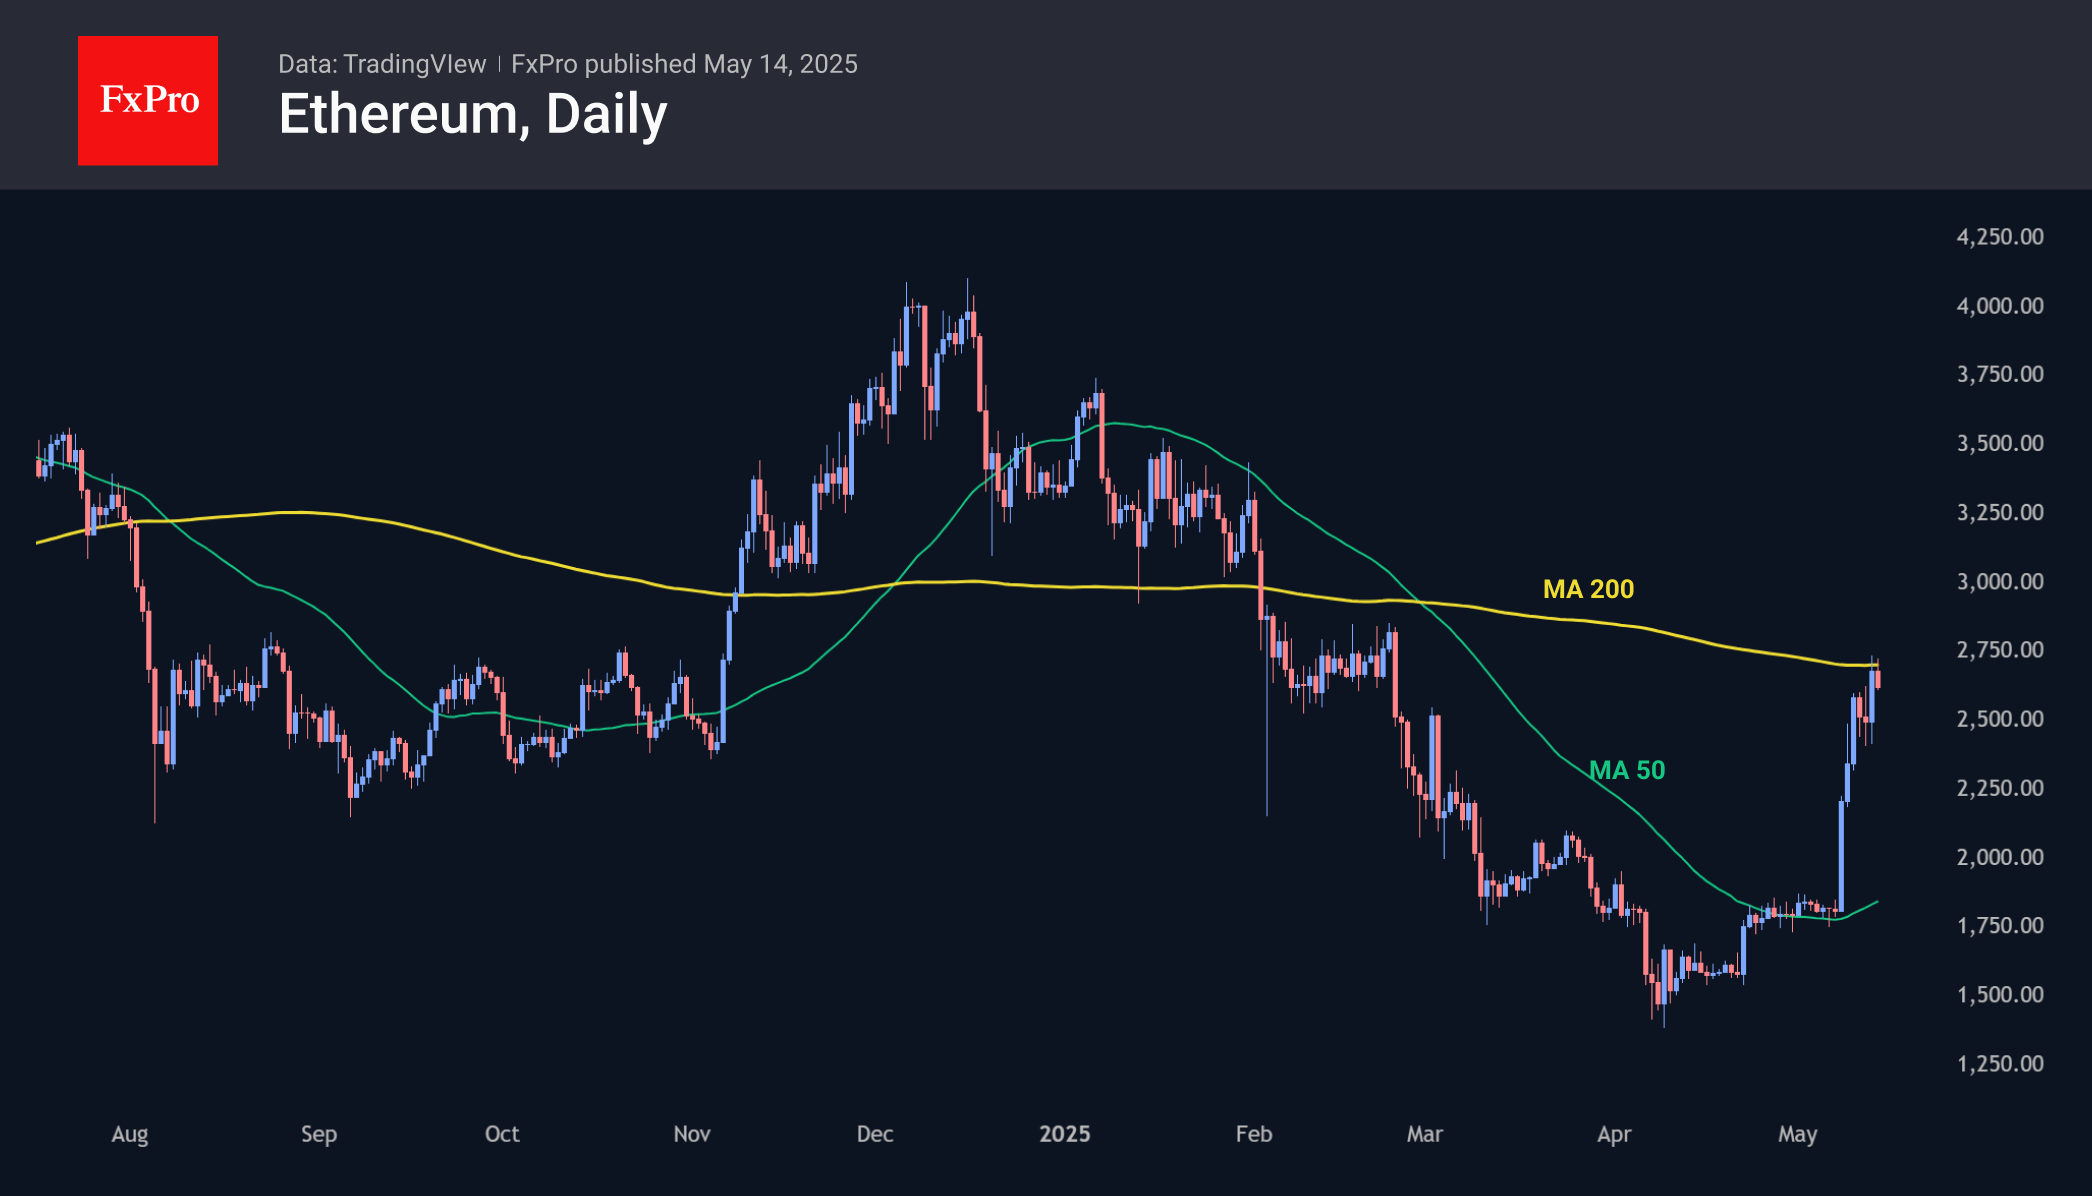
Ethereum is trading around $2615, having failed to consolidate above the $2700 mark, around which the 200-day moving average also passes. It is likely that after rallying 55% over the past seven days, the second-largest capitalised cryptocurrency will probably take a pause or start a correction with a potential target at $2400.
News Background
Bitcoin Magazine analysts point out that recent data points to a significant expansion of global liquidity (monetary aggregate M2), which historically accompanies bitcoin’s growth.
Glassnode experts note that the breakthrough of the psychological level of $100,000 has sparked interest from new bitcoin buyers, while experienced traders are cautious. According to Santiment, wallets with balances between 10 and 10,000 BTC have purchased an additional 83,105 BTC over the past 30 days.
Coinbase exchange shares will join the S&P 500 index from 19 May, replacing Discover Financial Services securities. Coinbase will become the first cryptocurrency company to be part of the U.S. broad market stock index. Bernstein estimates the new demand for the exchange’s shares from index funds to be $9bn.
Fed’s Goolsbee urges patience amid ‘dusty’ data and tariff uncertainty
Chicago Fed President Austan Goolsbee cautioned against overinterpreting April’s softer inflation data, noting on NPR that it’s still too early to gauge the true impact of rising US import tariffs.
While recent consumer price figures suggest inflation may be easing, Goolsbee stressed that Fed needs more clarity before making firm policy judgments, describing the current environment as one filled with “a lot of dust in the air.”
He acknowledged that the data so far “suggest that it’s going okay,” but emphasized the difficulty of drawing long-term conclusions amid ongoing short-term volatility.
“It’s just not realistic,” he said, “to expect businesses or central banks to be jumping to conclusions” in such an uncertain setting.
ECB’s Nagel stresses Dollar’s global role, cautious on tariff impact ahead of June decision
German ECB Governing Council member Joachim Nagel emphasized the continued importance of the Dollar as a global reserve currency during remarks today. At the same time, he expected that Euro would gradually play a stronger role in the international financial system over the coming years.
Looking ahead to ECB’s June policy meeting, Nagel reiterated that the interest rate decision will be guided by incoming data. He acknowledged the uncertainty surrounding the impact of US tariffs on inflation and growth within the Eurozone.
The updated ECB staff projections, due next month, would be essential in shaping the decision. Nagel also stressed that central banks must increasingly adapt to operating in an environment characterized by persistent geopolitical and policy-driven uncertainty.
NZD/USD Recoups Weekly Losses: Will It Turn Bullish Again?
- NZD/USD holds below 20-SMA after Tuesday's quick bounce.
- Bullish signals strengthen, but a break above 0.6020 is still needed.
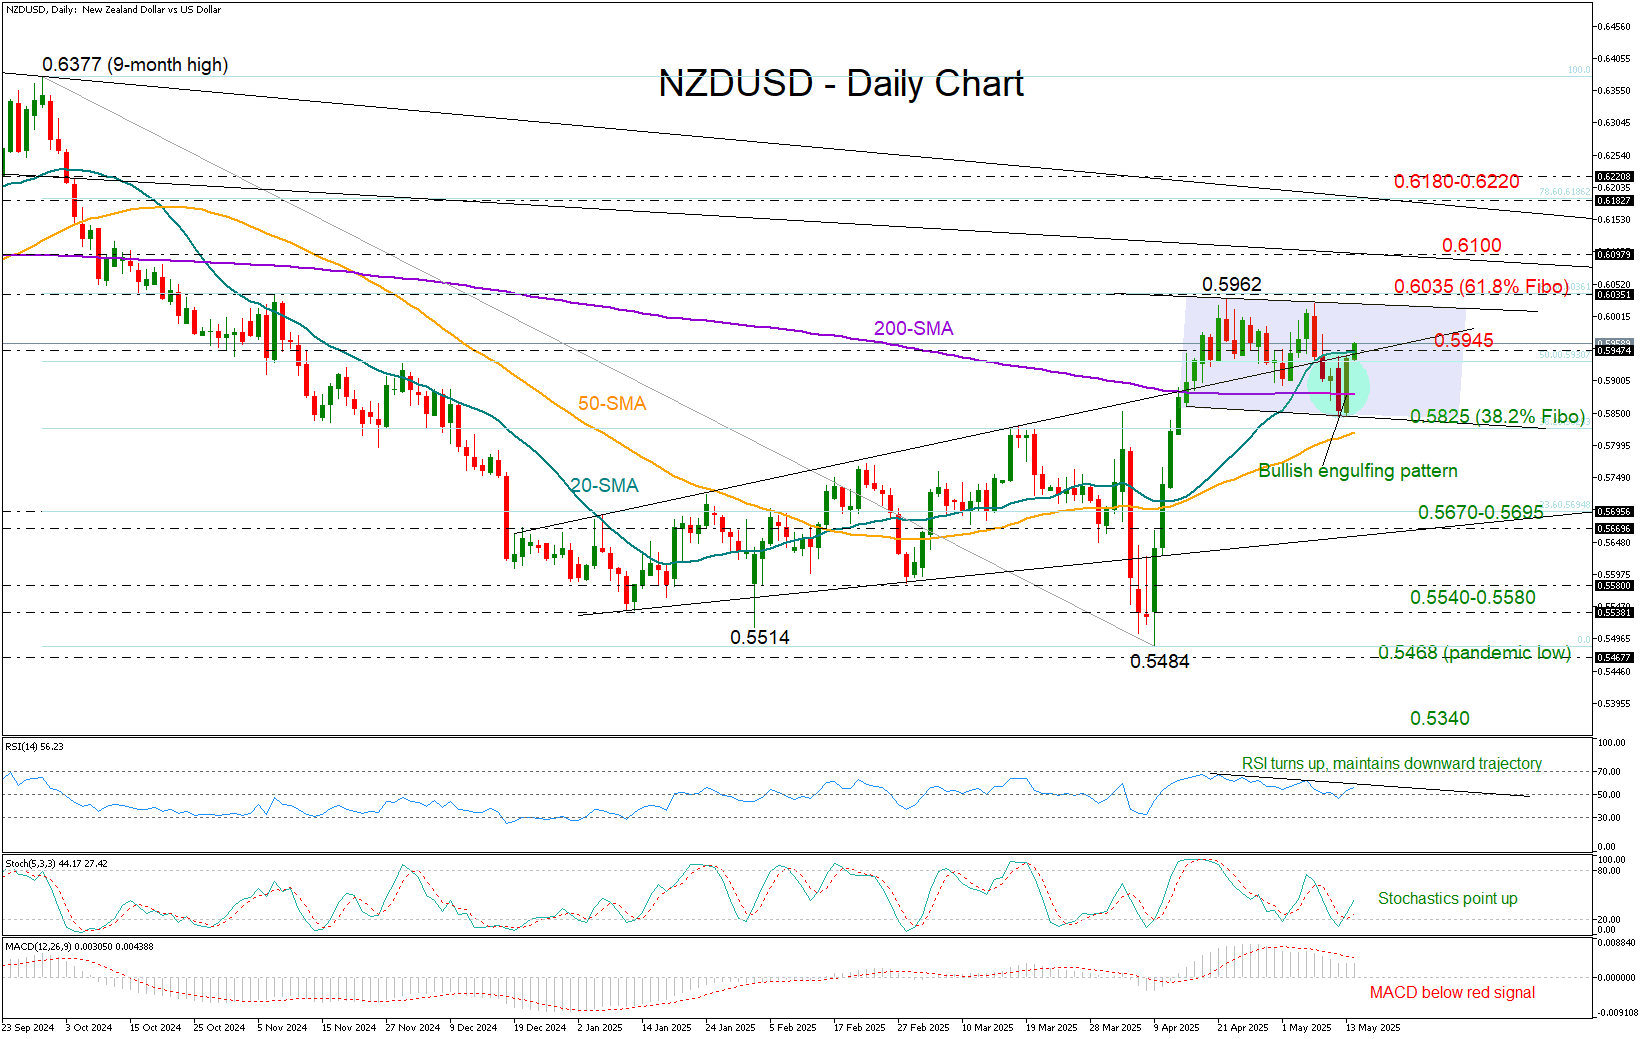
NZD/USD dropped to Monday’s low of 0.5845 before bouncing back to retest its 20-day simple moving average (SMA) at 0.5945, as the euphoria about the US-China trade deal faded, weighing on the US dollar. With the price still hovering around this line and near the 50% Fibonacci retracement level of the September–April downleg, the key question now is whether the bulls have enough momentum to break through that resistance and push into the 0.6000 area.
The positive rotation in the RSI and the stochastic oscillator, coupled with the bullish engulfing candlestick pattern formed on Tuesday, may help sustain buying interest. However, some caution is warranted, as the RSI remains on a downward slope, and the MACD continues to ease below its red signal line.
A continuation above the 61.8% Fibonacci level at 0.6020-0.6035 could place the pair back on a bullish track in the short-term picture, with resistance likely emerging near the 0.6100 level or even higher in the 0.6180–0.6220 region. Further gains beyond that could pave the way toward the October 2024 high of 0.6377.
In a bearish scenario, where the pair falls below the 38.2% Fibonacci level at 0.5825, the sell-off could accelerate toward the 0.5670–0.5695 region. A failure to stabilize there could drag the price further down to 0.5540–0.5580 and potentially toward the pandemic low of 0.5468.
Overall, NZD/USD may remain supported in the short term, though a sustained move above 0.6020 is needed to confirm a return to a bullish trajectory.
Yen Edges Higher as Market Capitalises on News-Driven Rebound
The USD/JPY pair dipped to 147.61 on Wednesday as the yen gained ground following softer-than-expected US inflation data.
Key factors influencing USD/JPY movement
Recent developments in global trade also captured market attention. The US and China had earlier agreed to a temporary 90-day tariff reduction, though uncertainty lingers over future trade policy once the agreement expires.
In bilateral discussions, Japanese Prime Minister Shigeru Ishiba stated that Tokyo would reject any provisional trade deal with the US unless it included safeguards for the auto industry. He urged Washington to reconsider its proposed 25% tariff on Japanese car imports.
Domestic data showed Japan’s producer prices rose at an annualised rate of 4.0% in April, down from 4.2% in March – marking the slowest growth since December last year.
The Bank of Japan remains cautious in its monetary policy approach, citing persistent uncertainties in both economic activity and inflation trends.
Meanwhile, demand for the yen as a safe-haven asset remains muted as global markets focus heavily on progress in US trade negotiations with key partners.
Technical analysis: USD/JPY
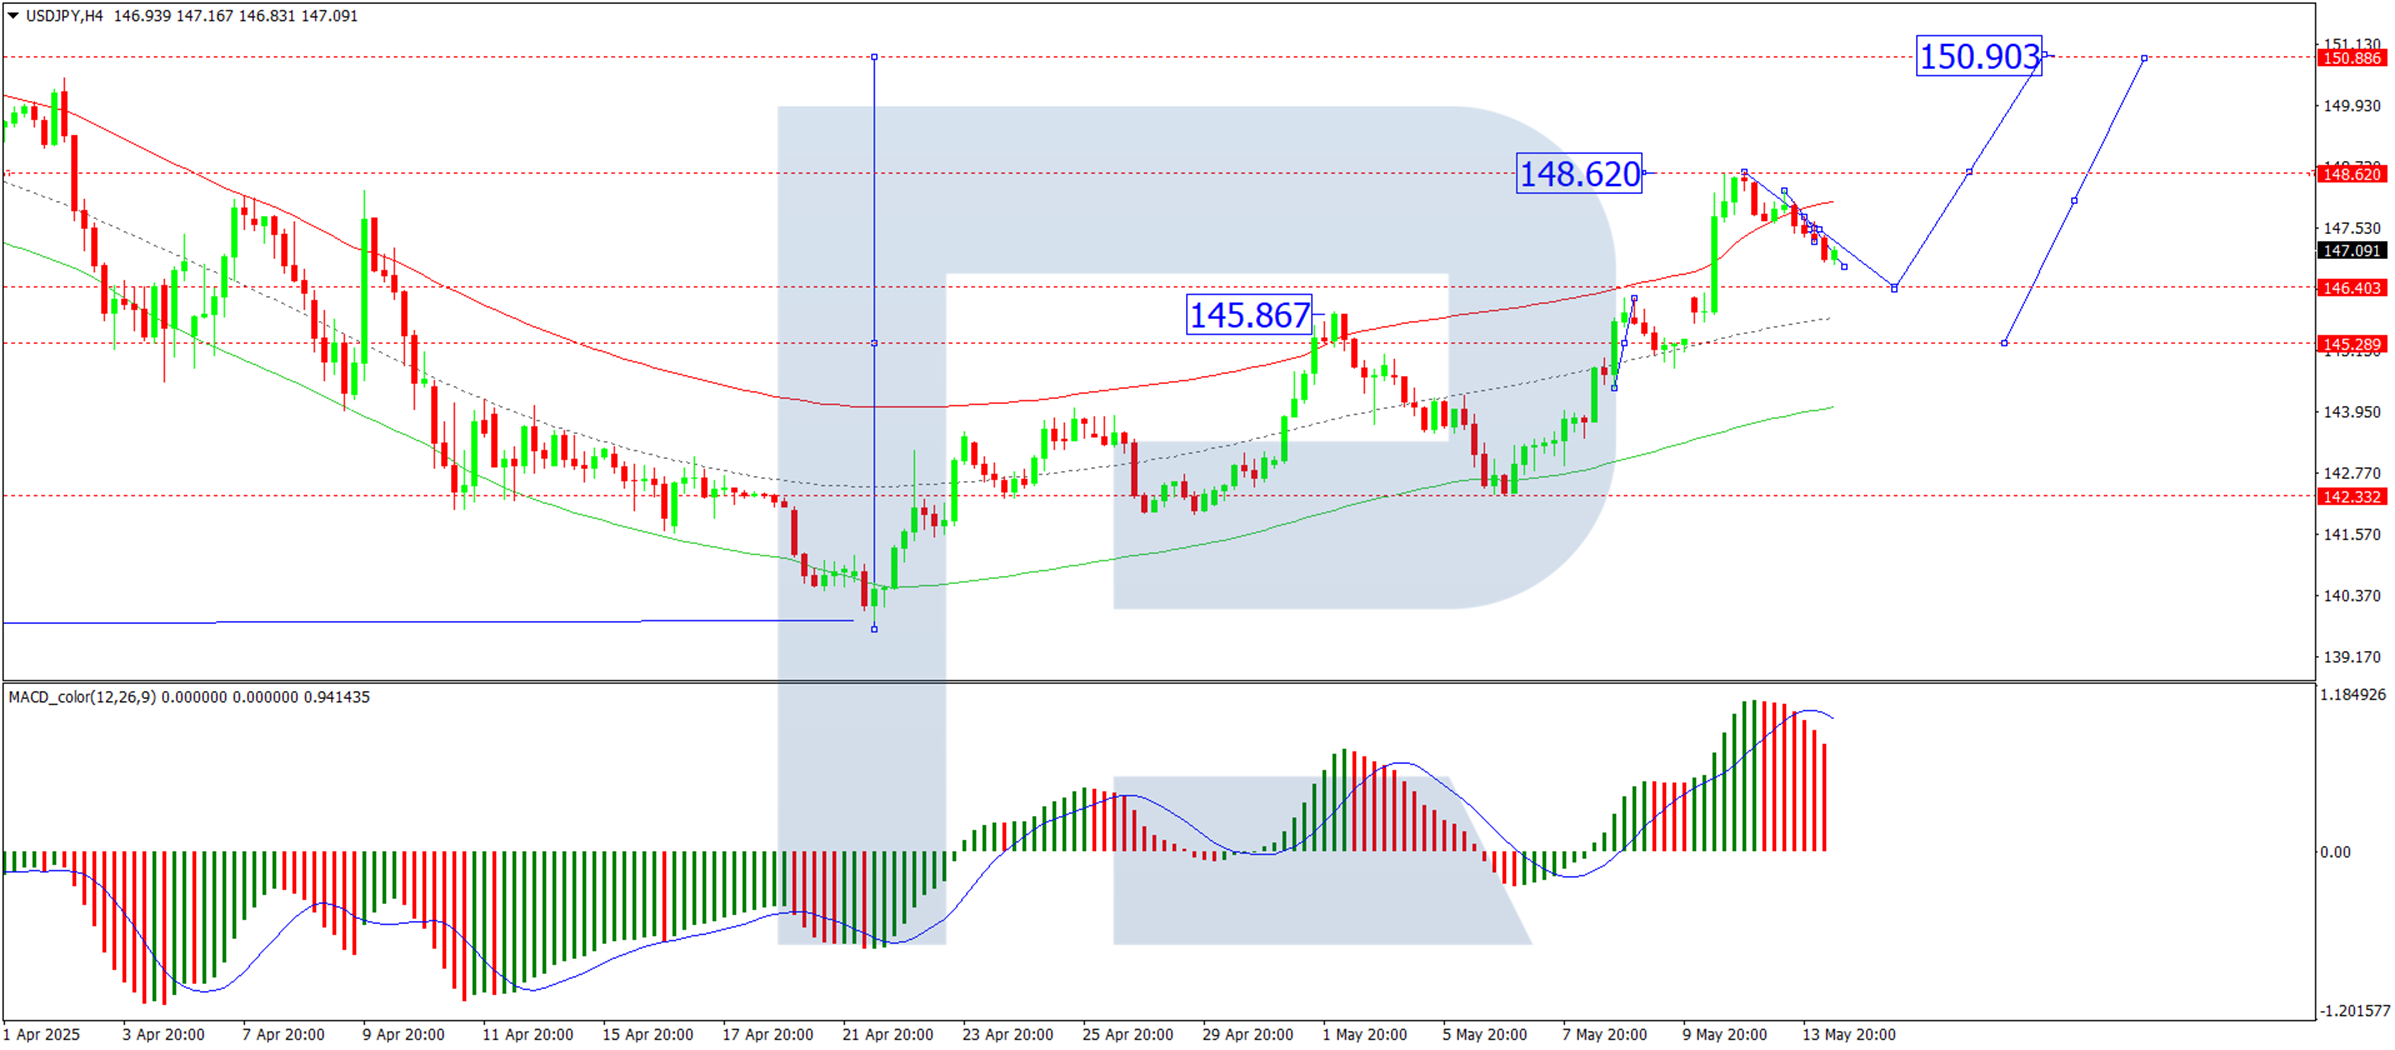
H4 Chart:
- The pair completed its third upward wave, peaking at 148.62, before entering a corrective phase
- The correction target stands at 146.40, with expectations of a new upward wave toward 150.90 once the pullback concludes
- This outlook is supported by the MACD indicator, where the signal line has exited the histogram zone and points firmly downward
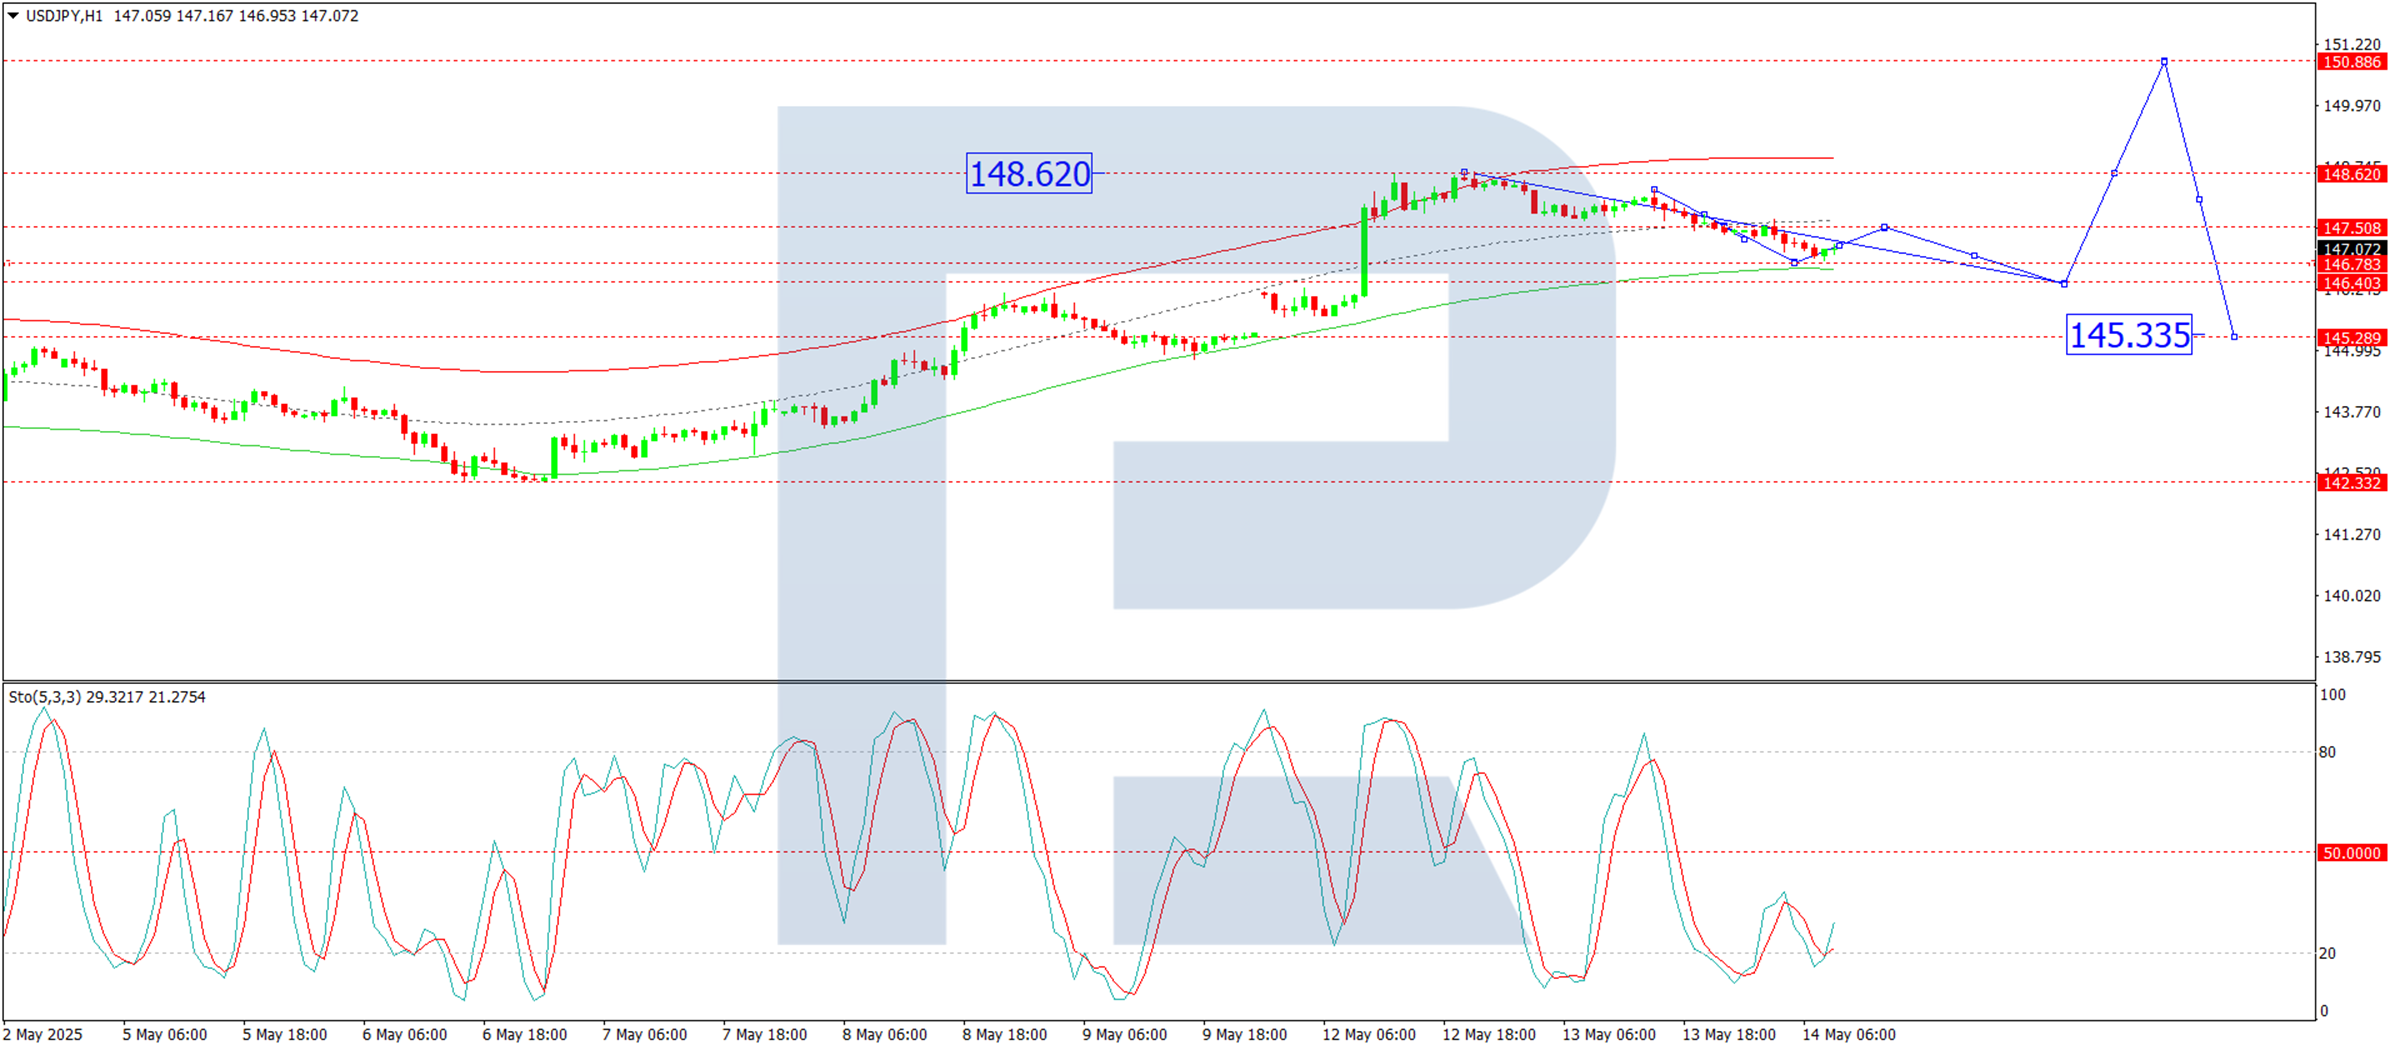
H1 Chart:
- The market has consolidated around 147.50, with a downward breakout extending the correction
- A further decline to 146.78 is anticipated, possibly followed by a retest of 147.50 (from below) before another drop toward 146.40
- A subsequent upward wave targeting 148.62 is expected
- The Stochastic oscillator confirms this scenario, with its signal line below 20 but rising sharply towards 50
Conclusion
The yen’s modest rebound reflects a combination of dollar weakness and cautious optimism in trade talks. However, with the BoJ maintaining a dovish stance and risk sentiment improving, further yen gains may be limited unless safe-haven demand resurges.
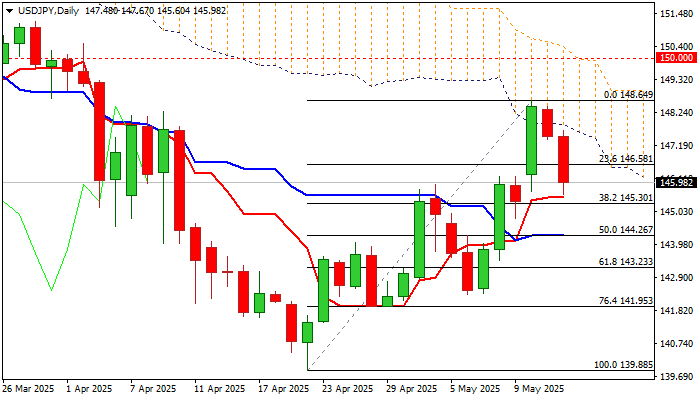
USD/JPY: Pullback Accelerates on Pressure from Bull-Trap /Falling Thick Daily Cloud
USDJPY extends pullback from new multi-week high (148.64) into second consecutive day, as overbought conditions prompted traders to collect profits.
Larger uptrend faced increased headwinds from falling daily Ichimoku cloud (brief penetration into cloud, spanned between 147.87 and 150.56 was short-lived) and also failed to clear Fibo barrier at 148.53 (76.4% of 151.20/139.88).
Bull-trap has been formed here that increased downside pressure, as falling thick cloud continues to weigh on near-term action.
Negative signals are developing on daily chart as bullish momentum is fading, stochastic emerging from overbought territory and south-heading RSI is approaching neutrality zone.
Fresh bears approach significant support at 145.30 (Fibo 38.2% of 139.88/148.64, reinforced by 10DMA), with clear break here to sideline larger bulls and open way for further easing towards 144.26 (50% retracement / daily Kijun-sen).
Near-term bias is expected to remain with bears while the price stays below 55DMA (146.50).
Res: 146.50; 147.67; 147.88; 148.64.
Sup: 145.30; 144.82; 144.26; 143.80.
S&P 500 Index May Lose Upward Momentum
Yesterday’s inflation data release held no major surprises, as the actual Consumer Price Index (CPI) figures came in close to analysts’ forecasts.
According to Forex Factory:
→ Annual CPI: actual = 2.3%, forecast = 2.4%, previous = 2.4%;
→ Monthly Core CPI: actual = 0.2%, forecast = 0.3%, previous = 0.1%.
Overall, stock indices rose yesterday, but according to media reports, this momentum may begin to slow in the near future:
→ UBS analysts downgraded their rating on US equities from “attractive” to “neutral” following the recovery from early April lows;
→ Goldman Sachs analysts believe that the US stock market rally could stall at current levels. In their view, the S&P 500 (US SPX 500 mini on FXOpen) is likely to reach 5900 over the next three months.
Technical Analysis of the E-Mini S&P 500 Chart
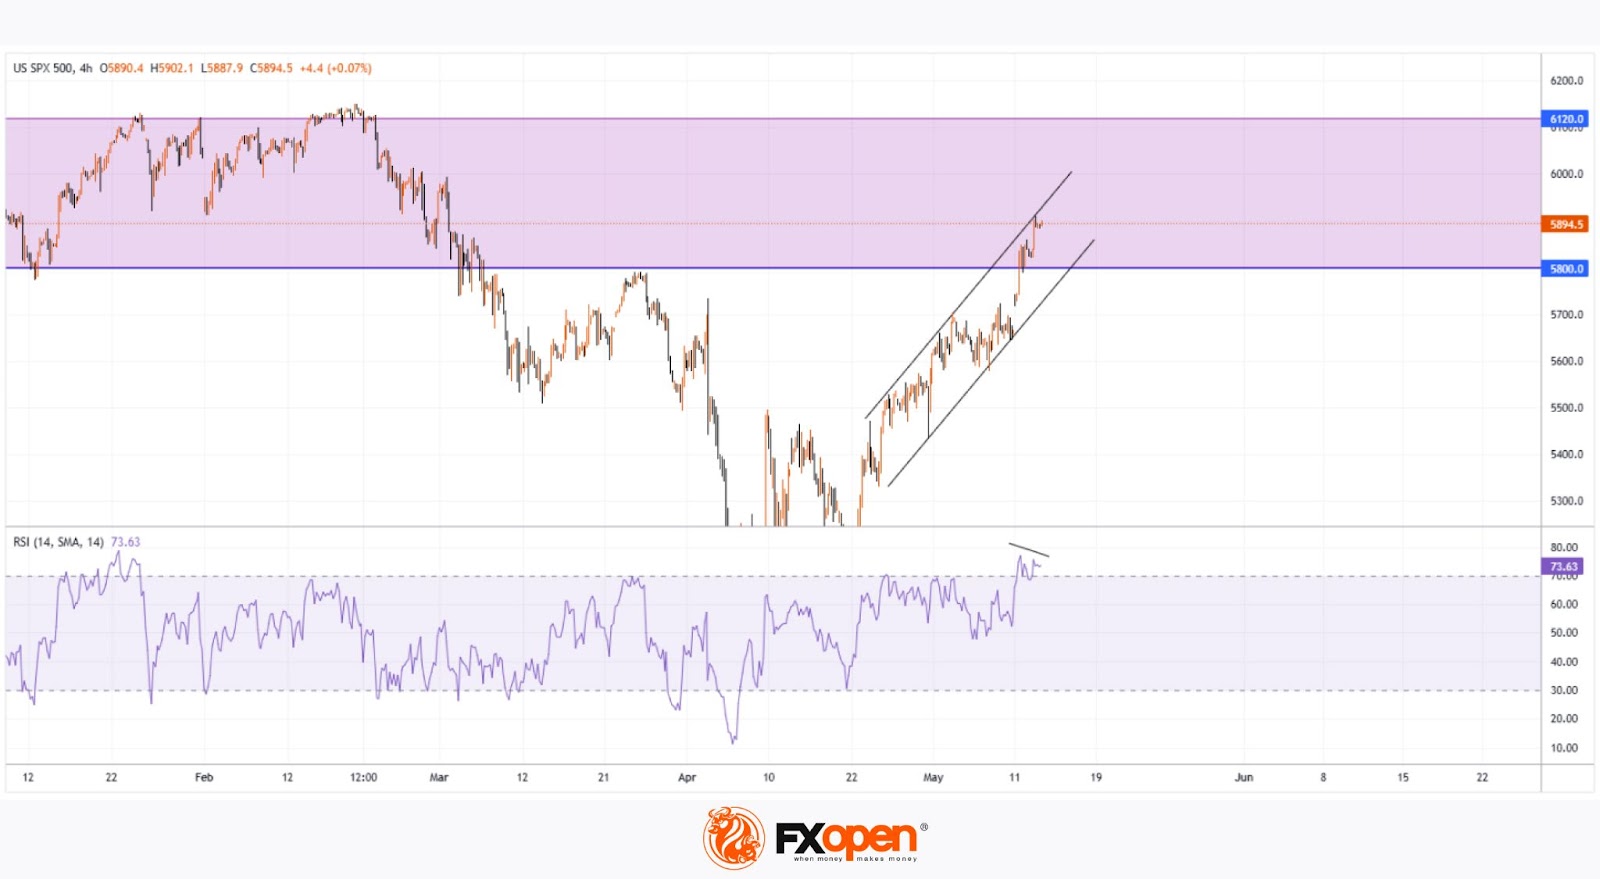
The chart provides more reasons to suggest that the current pace of growth may begin to slow.
Firstly, the index has entered a broad range between 5800 and 6120, where it spent a prolonged period during late 2024 and early 2025. This is a zone (highlighted in purple) where supply and demand previously reached a stable equilibrium — and similar balance could potentially emerge again.
Secondly:
→ the slope of the current upward channel (marked in black) appears excessively steep;
→ the RSI indicator points to a divergence;
→ the psychological level of 6000 may act as resistance.
Given the above, special attention should be paid to the scenario in which the S&P 500 (US SPX 500 mini on FXOpen) forms a short-term correction before the end of the month.
Trade global index CFDs with zero commission and tight spreads. Open your FXOpen account now or learn more about trading index CFDs with FXOpen.
This article represents the opinion of the Companies operating under the FXOpen brand only. It is not to be construed as an offer, solicitation, or recommendation with respect to products and services provided by the Companies operating under the FXOpen brand, nor is it to be considered financial advice.
DAX Opens Positive, US Tech Stocks Rise, and Oil Prices Jump on Iran Sanctions
Asian Session Market Wrap
Asia's main stock index went up, driven by tech companies, as investors waited for earnings reports from big Chinese tech firms this week.
Regional tech stocks rose for a fourth straight day after Nvidia and AMD said they would sell chips to a Saudi AI company for a $10 billion data center project. Meanwhile, US stock futures stayed steady.
China's top tech giant, Tencent, will release earnings on Wednesday, followed by Alibaba on Thursday. These results could show how the two key firms are handling geopolitical challenges and whether Chinese tech stocks might continue their recovery.
Australia's wages grew more than expected in the first quarter, reflecting a tight job market boosted by increased public-sector hiring
The European Open
Heading into the European open, Stock futures signaled declines in European markets and a steady session for Wall Street with the S&P 500 marginally higher.
Sentiment remains relatively stable for now but there is a 90-day deadline hanging over markets which may cast a shadow. Given the flip-flopping we have seen by the Trump administration, one could forgive market participants for not overly committing just yet.
Tech stocks are gaining attention again after U.S. chipmakers Nvidia and AMD announced major AI deals in the Middle East, coinciding with Trump’s visit to Saudi Arabia.
Nvidia’s stock jumped on Tuesday, boosting the company’s value to $3 trillion and CEO Jensen Huang's wealth to $120 billion.
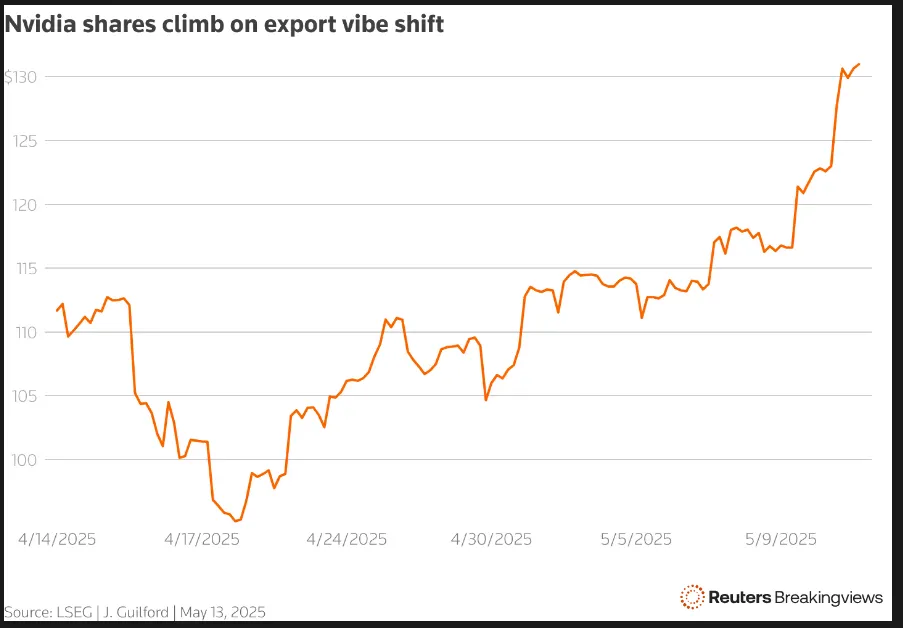
Source: LSEG
On the FX front, the U.S. dollar index stayed steady at 100.87 after its biggest drop in over three weeks. It had risen 1% on Monday, reaching a one-month high, as hopes grew that easing U.S.-China trade tensions could prevent a global recession.
The dollar rose 0.24% to 7.2122 yuan in offshore trading, after hitting a six-month low at 7.1791 yuan on Tuesday.
Meanwhile, the dollar fell 0.41% to 146.89/JPY, continuing Tuesday’s 0.66% decline. On Monday, it saw its biggest jump since March 2020, rising 2.14%. It also slipped 0.1% to 0.8384 Swiss francs.
The euro traded at 1.1191 and the British pound at $1.3307, with little change in either currency pair ahead of the European session.
Currency Strength Chart
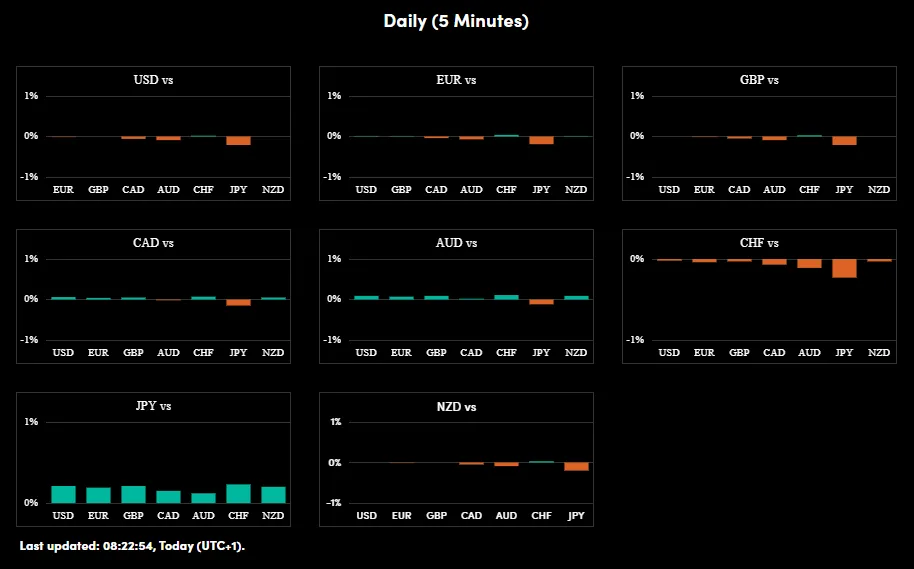
Source: OANDA Labs
Commodities remain interesting with Gold continuing to face headwinds following the weekend. Gold trades around $100 off Fridays daily close around the $3324/oz handle with a brief attempt at a recovery fizzling away yesterday. For now, the precious metal may struggle if sentiment continues to improve or if the current status quo remains unchanged.
Brent crude oil prices jumped nearly 2.6% yesterday, hitting their highest level since late April.
There have been growing concerns among US oil companies as Oil prices flirted with the $60 a barrel mark. President Trump had pledged to lower Oil prices to benefit consumers as well as increase US production. However, if oil prices dip significantly it will affect the profitability of US firms. In a way, it appears President Trump may struggle to deliver on both promises moving forward.
The main driver was the threat of more sanctions on Iranian oil exports. The US Treasury imposed sanctions on a group involved in shipping Iranian oil to China, and President Trump mentioned the possibility of stricter sanctions if no nuclear deal with Iran is reached. Trump has often warned about reducing Iran’s oil exports to zero. Although this is unlikely, there’s still potential for a significant decrease, as Iran currently exports around 1.6 million barrels per day.
Later today we will get the OPEC monthly oil report and it should be an interesting one given the desire by OPEC + countries to continue with aggressive supply hikes.
Economic data releases
From a data standpoint, it is not a busy day with limited data release. However, the following events could still stoke volatility while the overarching trade deal narrative remains firmly in play.
- Germany, Spain report final CPI figures for April
- Europe earnings: Burberry Group full year, ABN Amro Bank Q1
- Bank of England Governor Andrew Bailey speaks in Amsterdam
- Fed Bank of New York Q1 report on household debt and credit
- Fed Vice Chair Philip Jefferson speaks on the economic outlook at a virtual conference
- OPEC Monthly Report (Tentative)
- EIA crude oil inventories
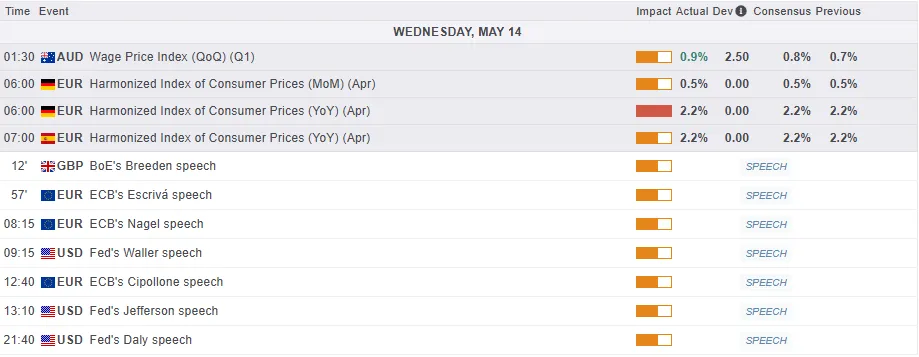
For all market-moving economic releases and events, see the MarketPulse Economic Calendar. (click to enlarge)
Chart of the day - DXY
The US Dollar Index (DXY) rally appears to fizzling out after the index rallied to a 1-month high on Monday.
Yesterday saw a bearish engulfing candle close on the daily timeframe with the index slightly down during Asian trade.
The markets reaction since Monday suggests significant bearish appetite for the US Dollar with yesterday lower that expected inflation print unlikely to help.
The grind higher when looked at in comparison to the decline also suggests that bearish interest remains strong.
If the DXY is to maintain its current uptrend and extend its recovery, a hold above the psychological 100.00 handle may be key.
For now though, immediate support rests at 100.61 and 100.00 before the 99.57 handle comes into focus.
A bullish continuation may bring recent highs around 102.00 back into focus before the 102.16 and 102.64 handle become areas of concern.
US Dollar Index (DXY) Daily Chart, May 14, 2025
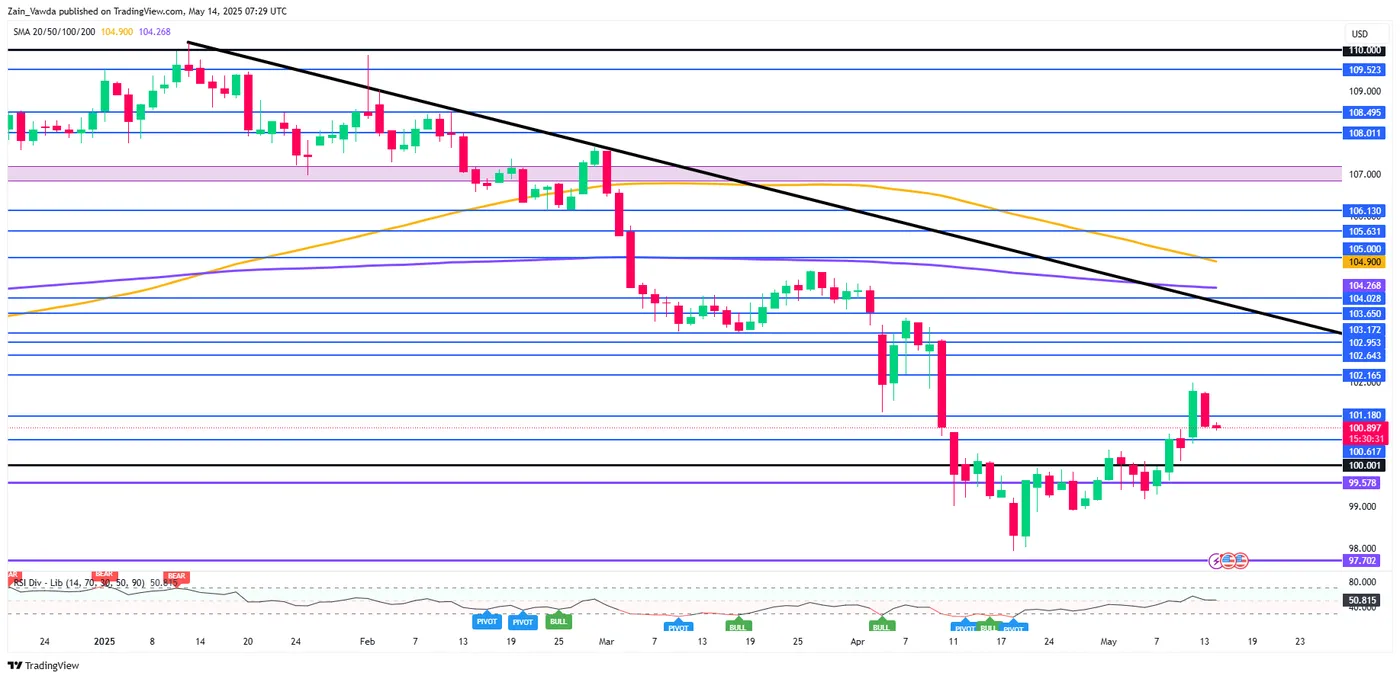
Source: TradingView.com (click to enlarge)