Sample Category Title
GBP/USD Daily Outlook
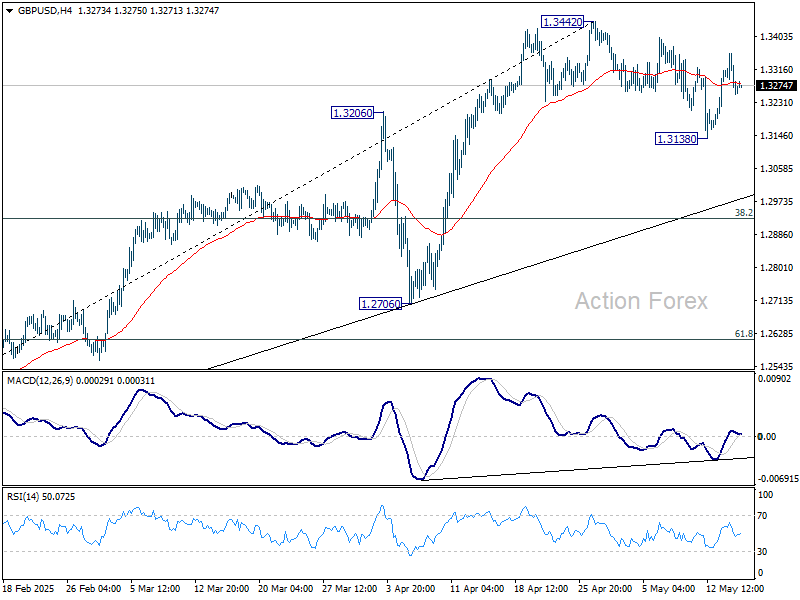
Daily Pivots: (S1) 1.3225; (P) 1.3292; (R1) 1.3331; More...
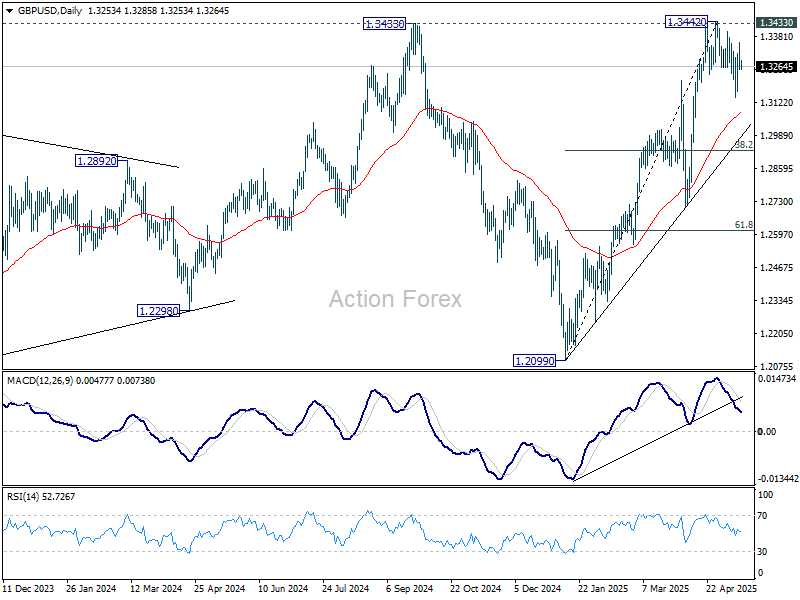
Intraday bias in GBP/USD is turned neutral first with current retreat. The view is unchanged that correction from 1.3442 might have completed at 1.3138 already. Decisive break of 1.3433/42 key resistance zone will confirm larger up trend resumption. Nevertheless, below 1.3138 will resume the correction. But downside should be contained by 38.2% retracement of 1.2099 to 1.3442 at 1.2929 to bring rebound.
In the bigger picture, price actions from 1.3433 are seen as a corrective pattern to the up trend from 1.3051 (2022 low). Rise from 1.2099 could either be resuming the up trend, or the second leg of a consolidation pattern. Overall, GBP/USD should target 1.4248 key resistance (2021 high) on decisive break of 1.3433 at a later stage.
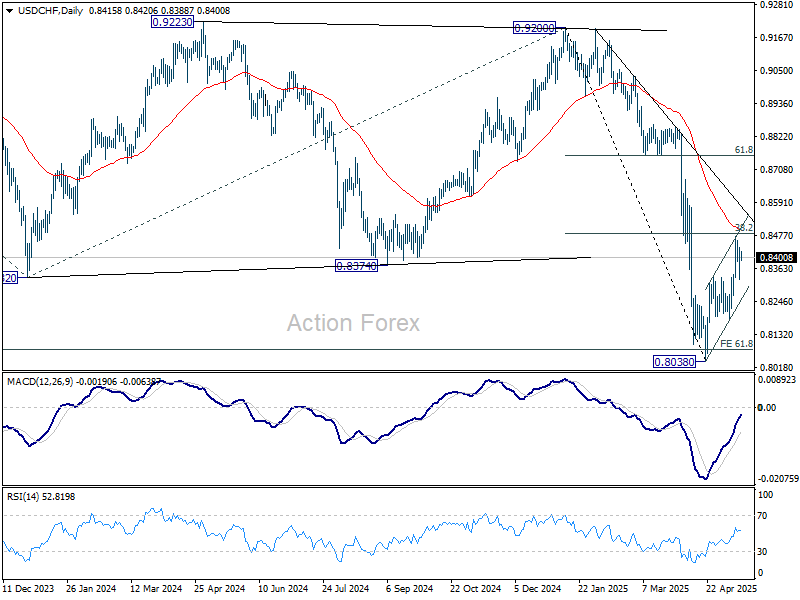
USD/CHF Daily Outlook
Daily Pivots: (S1) 0.8352; (P) 0.8394; (R1) 0.8463; More….
Intraday bias in USD/CHF stays neutral at this point. On the downside, firm break of 0.8333 resistance turned support will argue that corrective rebound from 0.8038 has completed at 0.8475, after rejection by 38.2% retracement of 0.9200 to 0.8038 at 0.8482. Intraday bias will be back on the downside for 0.8184, and then retest of 0.8038 low. However, sustained trading above 0.8482 will dampen this bearish view and target 61.8% retracement at 0.8756 next.
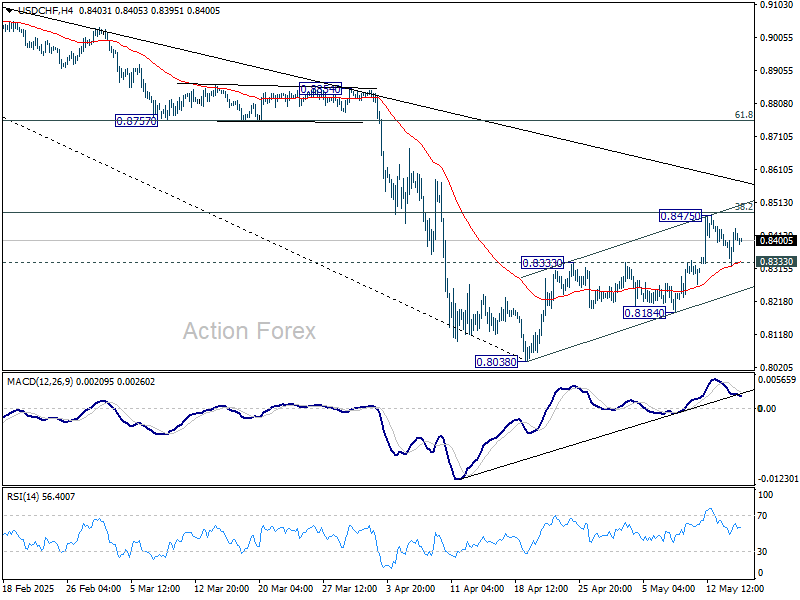
In the bigger picture, long term down trend from 1.0342 (2017 high) is still in progress and met 61.8% projection of 1.0146 (2022 high) to 0.8332 from 0.9200 at 0.8079 already. In any case, outlook will stay bearish as long as 55 W EMA (now at 0.8750) holds. Sustained break of 0.8079 will target 100% projection at 0.7382.
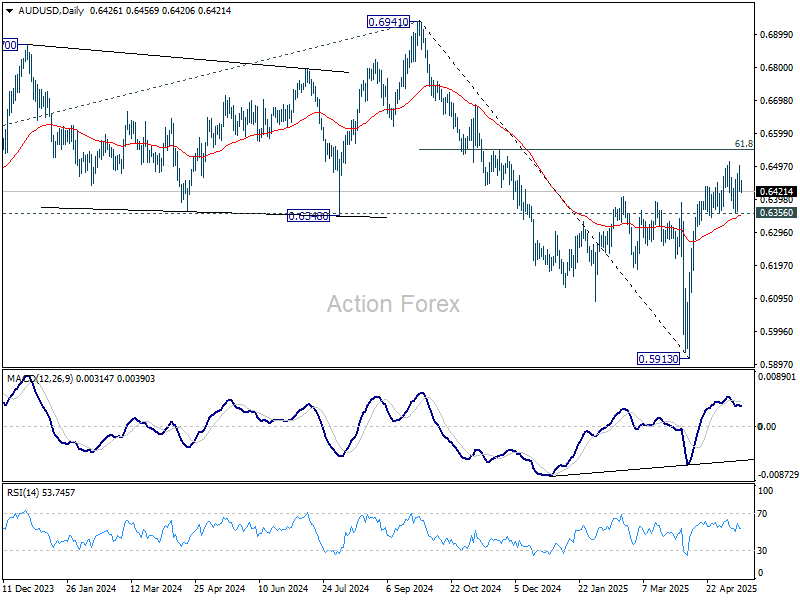
AUD/USD Daily Report
Daily Pivots: (S1) 0.6400; (P) 0.6451; (R1) 0.6478; More...
Range trading continues in AUD/USD and intraday bias stays neutral at this point. On the upside, firm break of 0.6511 will resume the rally from 0.5913 to 61.8% retracement of 0.6941 to 0.5913 at 0.6548. However, break of 0.6356 will bring deeper pullback to 38.2% retracement of 0.5913 to 0.6511 at 0.6283.
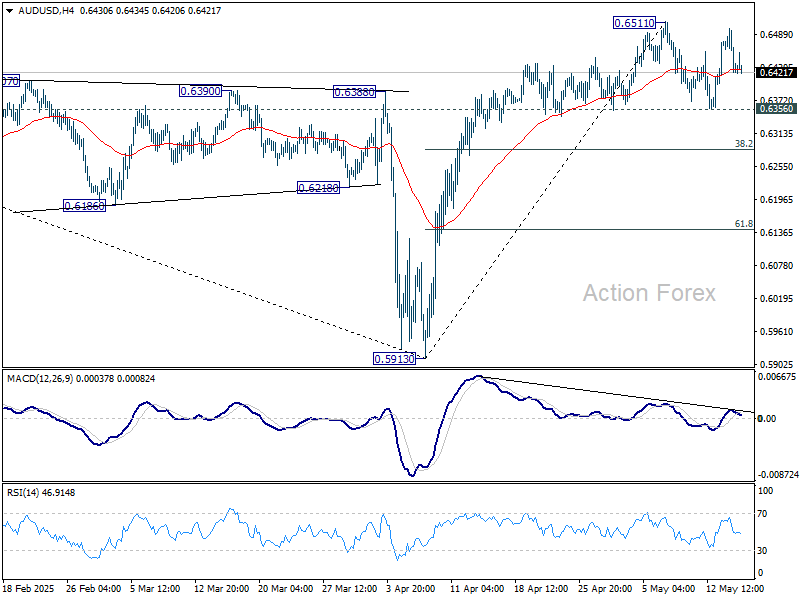
In the bigger picture, as long as 55 W EMA (now at 0.6441) holds, down trend from 0.8006 (2021 high) should resume later to 61.8% projection of 0.8006 to 0.6169 from 0.6941 at 0.5806. However, sustained trading above 55 W EMA will argue that a medium term bottom was already formed, and set up further rebound to 0.6941 resistance instead.
USD/CAD Daily Outlook
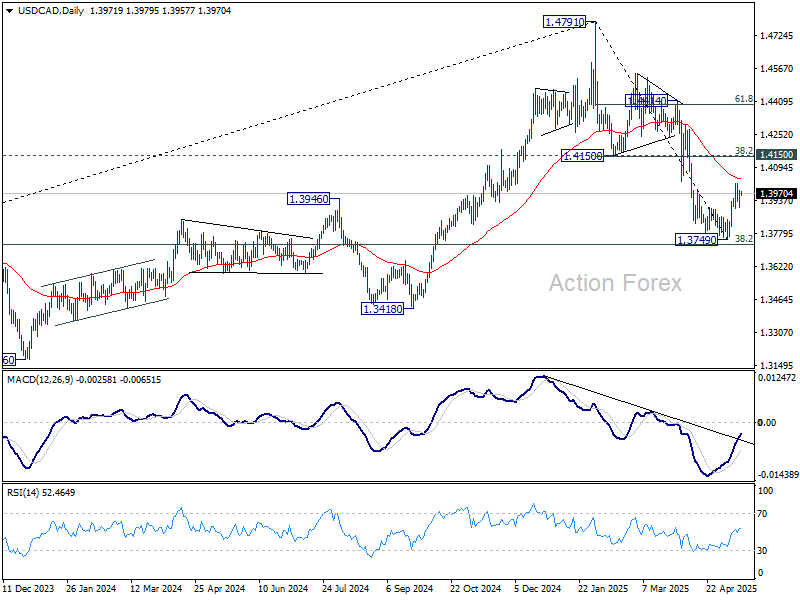
Daily Pivots: (S1) 1.3928; (P) 1.3957; (R1) 1.4012; More...
Intraday bias in USD/CAD remains neutral for the moment. Further rise is in favor with 1.3898 minor support intact. Above 1.4014 will resume the rebound from 1.3749 to 1.4150 cluster resistance (38.2% retracement of 1.4791 to 1.3749 at 1.4147). However, break of 1.3898 minor support will indicate that the rebound has completed, and bring retest of 1.3749.
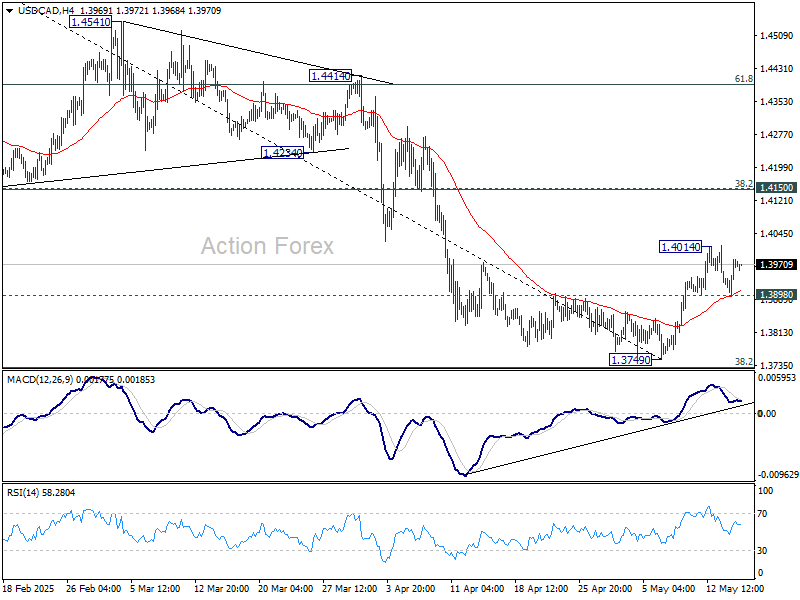
In the bigger picture, price actions from 1.4791 medium term top could either be a correction to rise from 1.2005 (2021 low), or trend reversal. In either case, further decline is expected as long as 1.4150 resistance turned support holds. Firm break of 38.2% retracement of 1.2005 (2021 low) to 1.4791 at 1.3727 will pave the way back to 61.8% retracement at 1.3069.
Cautious Trade as APEC Cuts Growth View, Key UK and US Releases Awaited
Activity in the global stock markets remained relatively subdued, with US posting a mixed close overnight and Asian markets slipping modestly lower today. Despite China’s 50bps Reserve Requirement Ratio cut taking effect, expected to inject over USD 138B into the banking system, investor reaction has been muted. The cautious tone reflects lingering concerns over the global trade outlook, which continues to overshadow stimulus measures and upbeat economic data.
Trade-related uncertainty remains a key drag on sentiment, with APEC group issuing a stark warning about the deteriorating outlook. At its 2025 trade ministers meeting in South Korea, APEC projected regional exports to grow by just 0.4% this year, sharply down from 5.7% in 2024. The group also downgraded its regional economic growth forecast to 2.6%, from 3.3% previously, citing weakening external demand, particularly in manufacturing and consumer goods, as well as rising policy uncertainty across trade and services sectors.
In the currency markets, Yen and Swiss Franc are the strongest performer today so far, benefiting from mild pullback in risk-on sentiment and likely some short covering after recent weakness. Aussie is gaining ground as well, lifted by a stronger-than-expected employment report, which suggests that while the Reserve Bank of Australia is still on track for a rate cut next week, a more aggressive easing path may be off the table for now.
Conversely, Dollar is the weakest major today, although the downside lacks conviction so far. Loonie and Kiwi are also under some mild pressure. Euro and Pound are holding steady, awaiting further catalysts, with the UK GDP report due in the European session.
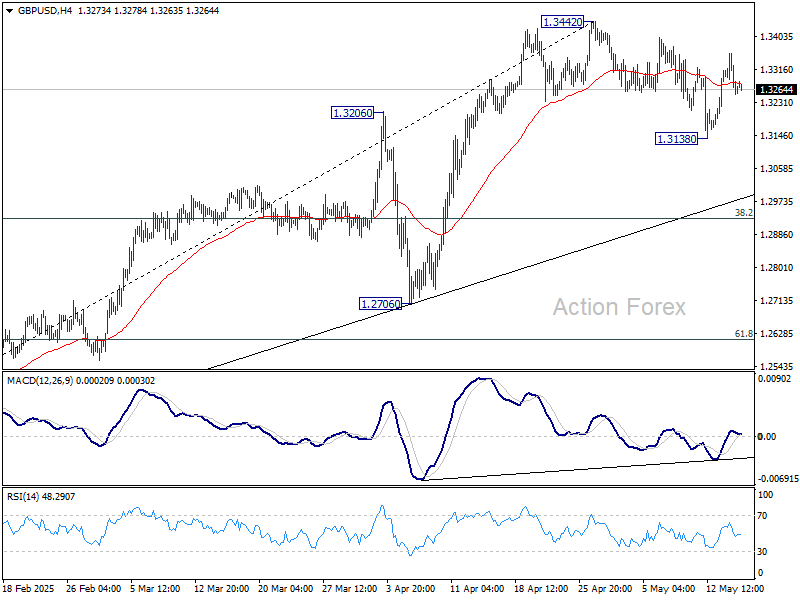
Technically, GBP/USD's rebound from 1.3138 stalled well ahead of 1.3442 resistance. But for now, correction from 1.3442 is still seen as completed. Another rise would be in favor as long as 1.3138 holds. Retest of 1.3442 should be seen next, and firm break there will resume larger up trend.
In Asia, at the time of writing, Nikkei is down -1.01%. Hong Kong HSI is down -0.25%. China Shanghai SSE is down -0.42%. Singapore Strait Times is up 0.41%. Japan 10-year JGB yield is up 0.023 at 1.48. Overnight, DOW fell -0.21%. S&P 500 rose 0.10%. NASDAQ rose 0.72%. 10-year yield rose 0.029 to 4.528.
Looking ahead, UK GDP data will be the main focus in European session. Swiss PPI, Eurozone GDP revision and industrial production will also be released. Later in the day, US retail sales and PPI will take center stage. Jobless claims, Empire state manufacturing, Philly Fed manufacturing, industrial production will also be released.
Fed’s Daly: Economy doing fairly well, patience key amid uncertainties
At an event overnight, San Francisco Fed President Mary Daly said Fed is in a "good position" to respond to evolving conditions and uncertainties. She emphasized, “patience is the word of the day,”
"We've got solid growth, a solid labor market and declining inflation," she said. Despite lingering uncertainties, overall sentiment remains constructive, with people feeling the economy is performing “fairly well.”
"It's just a matter of resolving the uncertainty so we can continue to do very well," Daly added.
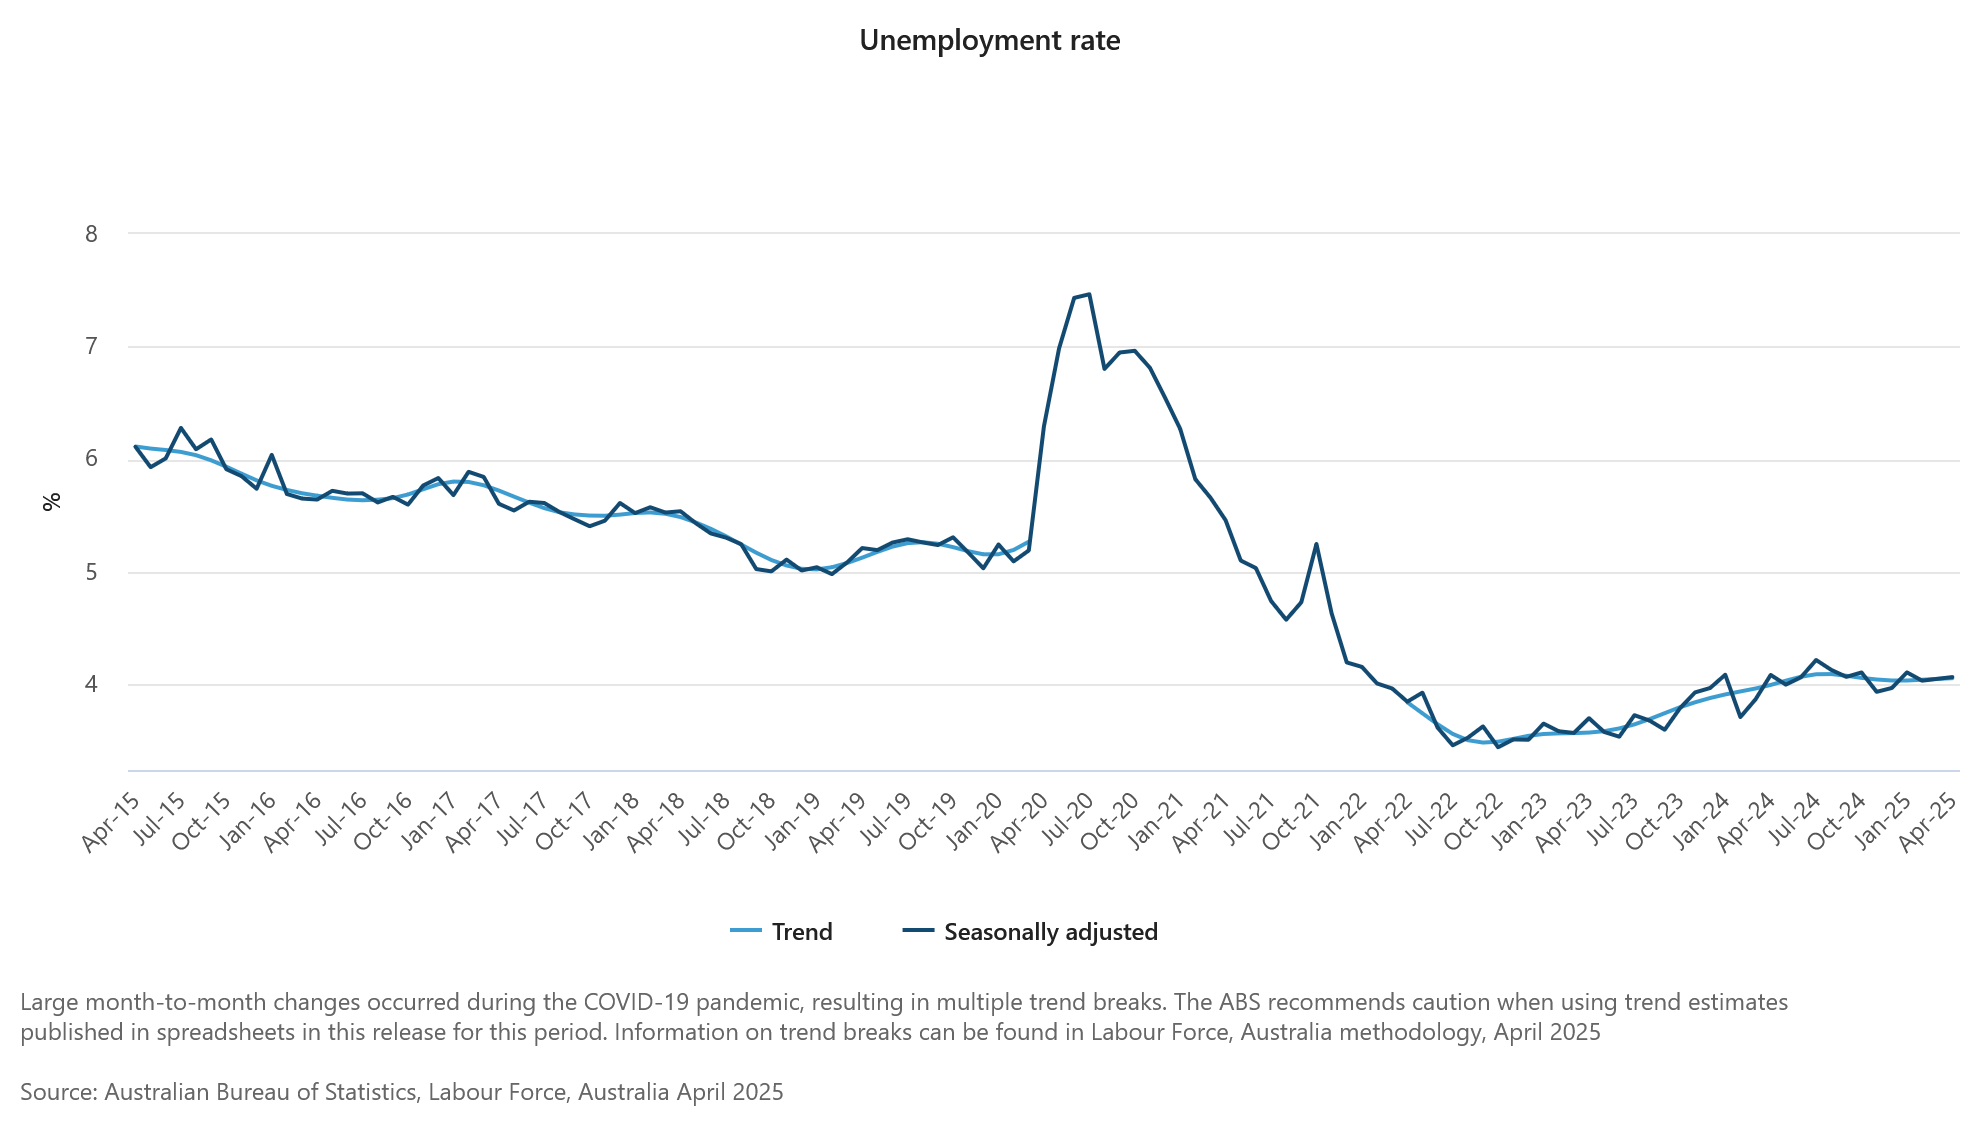
Australia jobs surge 89k in April, unemployment rate unchanged at 4.1%
Australia’s labor market delivered a strong upside surprise in April, with employment rising by 89k, sharply above expectations of 20.9k. Full-time jobs accounted for 59.5k of the gain, while part-time employment rose by 29.5k.
Unemployment rate held steady at 4.1%, in line with forecasts, as the surge in employment was matched by a jump in labor force participation from 66.8% to 67.1%.
Despite the headline strength, hours worked were largely unchanged on the month. Nonetheless, the employment-to-population ratio rose by 0.3 percentage points to 64.4%, just shy of the record high reached in January.
USD/CAD Daily Outlook
Daily Pivots: (S1) 1.3928; (P) 1.3957; (R1) 1.4012; More...
Intraday bias in USD/CAD remains neutral for the moment. Further rise is in favor with 1.3898 minor support intact. Above 1.4014 will resume the rebound from 1.3749 to 1.4150 cluster resistance (38.2% retracement of 1.4791 to 1.3749 at 1.4147). However, break of 1.3898 minor support will indicate that the rebound has completed, and bring retest of 1.3749.
In the bigger picture, price actions from 1.4791 medium term top could either be a correction to rise from 1.2005 (2021 low), or trend reversal. In either case, further decline is expected as long as 1.4150 resistance turned support holds. Firm break of 38.2% retracement of 1.2005 (2021 low) to 1.4791 at 1.3727 will pave the way back to 61.8% retracement at 1.3069.
Australia jobs surge 89k in April, unemployment rate unchanged at 4.1%
Australia’s labor market delivered a strong upside surprise in April, with employment rising by 89k, sharply above expectations of 20.9k. Full-time jobs accounted for 59.5k of the gain, while part-time employment rose by 29.5k.
Unemployment rate held steady at 4.1%, in line with forecasts, as the surge in employment was matched by a jump in labor force participation from 66.8% to 67.1%.
Despite the headline strength, hours worked were largely unchanged on the month. Nonetheless, the employment-to-population ratio rose by 0.3 percentage points to 64.4%, just shy of the record high reached in January.
Fed’s Daly: Economy doing fairly well, patience key amid uncertainties
At an event overnight, San Francisco Fed President Mary Daly said Fed is in a "good position" to respond to evolving conditions and uncertainties. She emphasized, “patience is the word of the day,”
"We've got solid growth, a solid labor market and declining inflation," she said. Despite lingering uncertainties, overall sentiment remains constructive, with people feeling the economy is performing “fairly well.”
"It's just a matter of resolving the uncertainty so we can continue to do very well," Daly added.
WTI Crude Oil Faces Downside Risk — Is a New Leg Lower Coming?
Key Highlights
- WTI Crude Oil prices started a recovery wave above the $60.00 level.
- A connecting bullish trend line is forming with support at $61.90 on the 4-hour chart.
- Gold prices dipped below the $3,300 and $3,280 levels.
- EUR/USD is now trading below the 1.1320 resistance zone.
WTI Crude Oil Price Technical Analysis
WTI Crude Oil price found support at $55.50 and recovered against the US Dollar. It tested $63.90 and is again showing bearish signs.
Looking at the 4-hour chart of XTI/USD, the price settled above the $61.50 level and the 100 simple moving average (red, 4-hour). However, it is now struggling to settle above the 200 simple moving average (green, 4-hour).
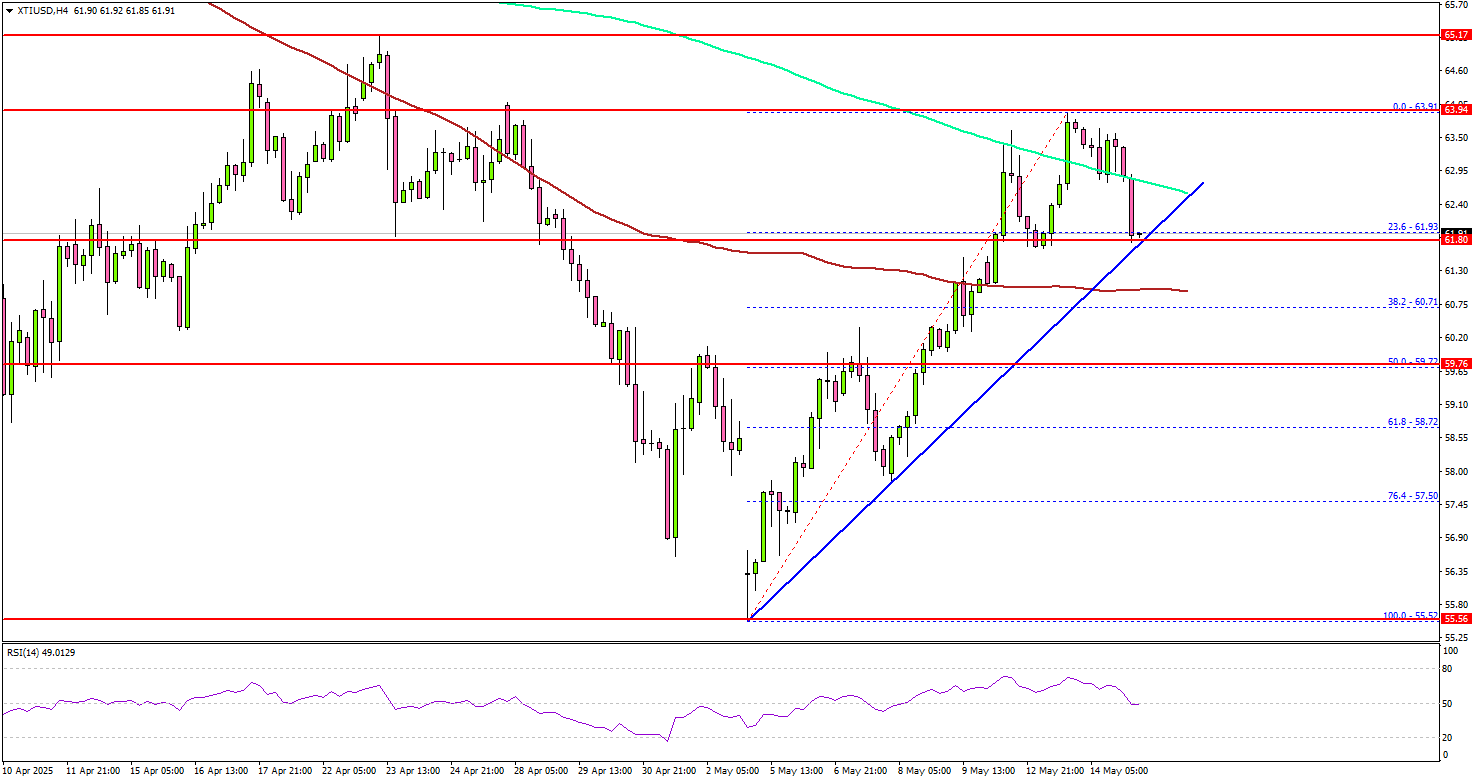
The price is now moving lower below $62.50 and testing the 23.6% Fib retracement level of the upward move from the $55.52 swing low to the $63.91 high.
There is also a connecting bullish trend line forming with support at $61.90 on the same chart. On the downside, the first major support sits near the $61.90 zone. A daily close below $61.90 could open the doors for a larger decline.
The next major support is $59.20 and the 50% Fib retracement level of the upward move from the $55.52 swing low to the $63.91 high. Any more losses might send oil prices toward $56.50 in the coming days.
On the upside, the price is facing hurdles near the $62.50 level. The first key resistance sits near the $63.20 level. The main hurdle is now near the $64.00 zone, above which the price may perhaps accelerate higher. In the stated case, it could even visit the $65.50 resistance. Any more gains might call for a test of the $68.00 resistance zone in the near term.
Looking at Gold, there was a fresh decline, and the bears were able to push the price below the $3,280 support zone.
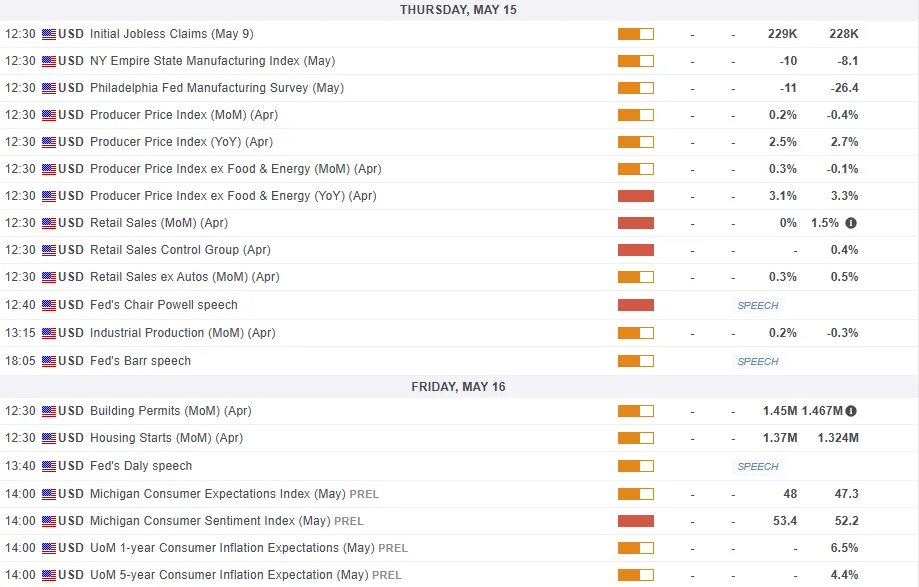
Economic Releases to Watch Today
- US Initial Jobless Claims - Forecast 229K, versus 228K previous.
- US Retail Sales for April 2025 (MoM) – Forecast 0%, versus +1.5% previous.
- US Producer Price Index for April 2025 (YoY) – Forecast +2.5%, versus +2.7% previous.
USD/CAD at Key Inflection Point of 1.4000. Bears or Bulls to Take Charge?
USD/CAD has been on a grind higher since May 6 and has now returned to the key psychological level 1.4000 level. Volatility has subsided somewhat of late as trade deals and a rebound in overall market sentiment has led to calmer markets as a whole.
May has been a rough month thus far for the Canadian dollar. Prime Minister Mark Carney’s visit to meet Trump didn’t show any signs of easing US-Canada tensions. Renegotiating the USMCA trade deal looks like it’ll take longer than other international trade agreements for both countries. This has come at a time where the US Dollar has shown signs of a recovery but there are still headwinds for the greenback moving forward.
Is the US Dollar set for more pain?
The US Dollar rise of late has been welcomed by markets but there is growing concern over the sustainability of the Dollar's strength. Earlier today there was a report stating that the US is not seeking to weaken the Dollar through trade deals, citing an unnamed source.
According to a person familiar with the situation, US officials negotiating trade deals around the world are not attempting to include currency policy pledges in the agreements.
Foreign exchange markets are on edge due to concerns. President Donald Trump's administration wants a weaker dollar and may use trade negotiations to achieve that goal. On Wednesday, the South Korean won rose nearly 2% against the dollar, while the Japanese yen also gained. Earlier this month, Taiwan's currency experienced its biggest increase in decades.
An ING Think report today painted a picture of concern for the Greenback. The report may be on to something, citing the recent 90-day pause between the US-China as a pragmatic approach but one which is unlikely to wipe away the scars of a topsy-turvy month of April.
There had been a noticeable shift in April away from the Greenback as asset managers sought more diversification when it comes to FX reserves given the volatility and lack of safe haven appeal of the Dollar.
ING states that the lag effects of this pivot are yet to be felt which may be true to some extent at least. Further adding to this, ING cites the upcoming unfunded tax cuts making its way through Congress as another factor which could weigh on the Dollar moving forward.
All in all the US Dollar picture remains uncertain to say the least.
Bank of Canada (BoC) to Cut Rates Again?
The Bank of Canada faces an interesting few months ahead as data continues to deteriorate. When it comes to monetary policy, the Fed and BoC are both expected to cut rates in the coming months. However, at present it does appear that the BoC may beat the Fed to cut rates first.
This could be something else that is weighing on the CAD of late and could come into play in the weeks ahead.
Economic Data Ahead
Looking ahead, the calendar is light this week in terms of Canadian data. There is however a host of US data releases and Fed speakers scheduled to speak before the week comes to a close.
For all market-moving economic releases and events, see the MarketPulse Economic Calendar.
Technical Analysis - USD/CAD
From a technical standpoint, USD/CAD has rejected of the psychological 1.4000 level on both Monday and Tuesday.
Tuesdays daily candle closed as a shooting star on the daily timeframe which hinted at further downside.
However yesterdays daily candle closed as a hammer off support at 1.3900 hinting at further upside.
If USD/CAD can clear the 1.4000 handle the top of the descending channel may come into focus around the 1.4100 handle.
If price fails to make a convincing move above the 1.4000 a retest of the 1.3900 support may come into focus. Below that support may be found at 1.3854 and 1.3747.
USD/CAD Daily Chart, May 14, 2025
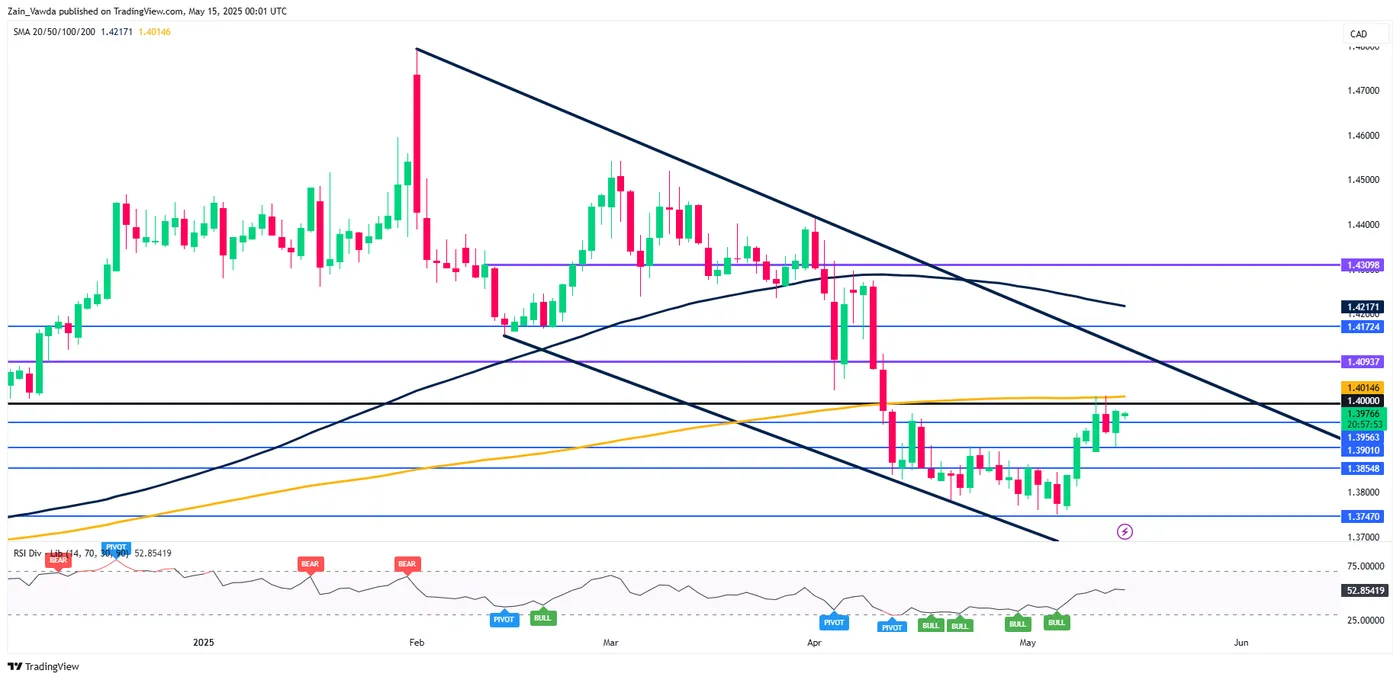
Source: TradingView (click to enlarge)
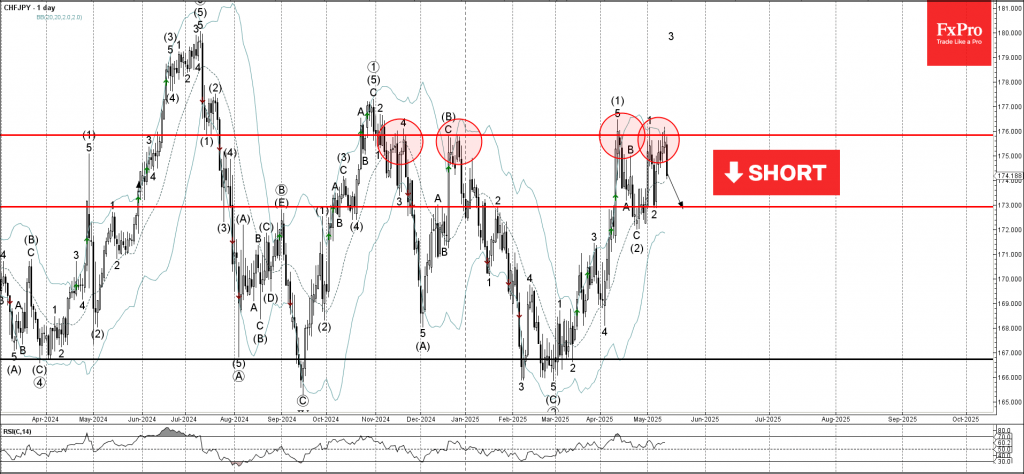
CHFJPY Wave Analysis
CHFJPY: ⬇️ Sell
- CHFJPY reversed from the resistance level 176.00
- Likely to fall to support level 173.00
CHFJPY currency pair recently reversed from the pivotal resistance level 176.00, which has been repeatedly reversing the price since November.
The resistance level 176.00 was strengthened by the upper daily Bollinger Band.
Given the strength of the resistance level 176.00 and the strongly bullish yen sentiment seen today, CHFJPY currency pair can be expected to fall to the next support level 173.00 (low of the previous correction 2).