
Sample Category Title
EUR/USD Daily Outlook
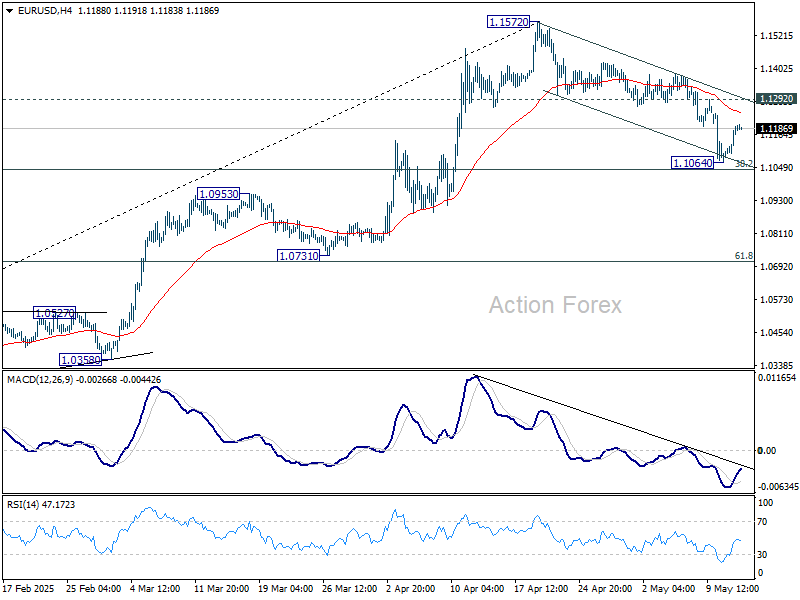
Daily Pivots: (S1) 1.1114; (P) 1.1155; (R1) 1.1225; More...
Intraday bias in EUR/USD remains neutral for the moment. Strong support is expected from 38.2% retracement of 1.0176 to 1.1572 at 1.1039 to complete the correction from 1.1572. On the upside, break of 1.1292 resistance will bring retest of 1.1572 high. However, sustained break of 1.1039 will dampen this view and target 61.8% retracement at 1.0709 next.
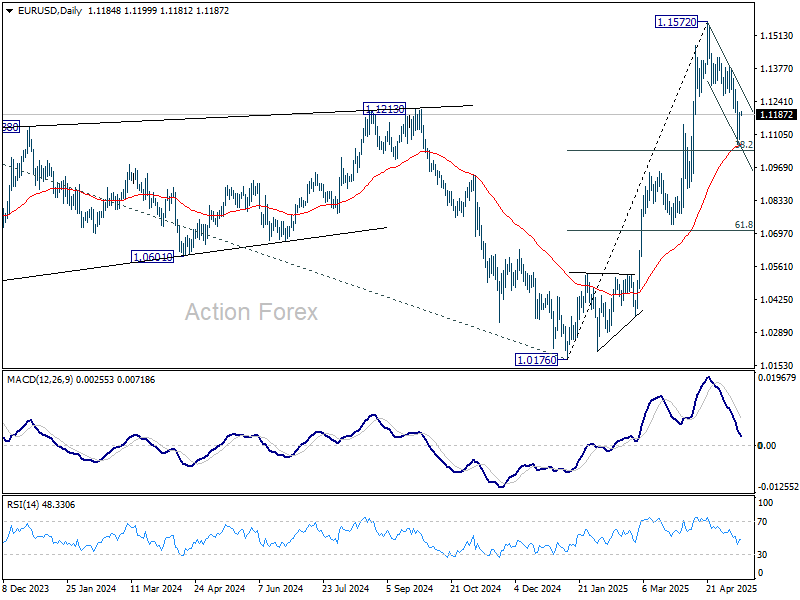
In the bigger picture, rise from 0.9534 long term bottom could be correcting the multi-decade downtrend or the start of a long term up trend. In either case, further rise should be seen to 100% projection of 0.9534 to 1.1274 from 1.0176 at 1.1916. This will now remain the favored case as long as 55 W EMA (now at 1.0789) holds.
USD/JPY Daily Outlook
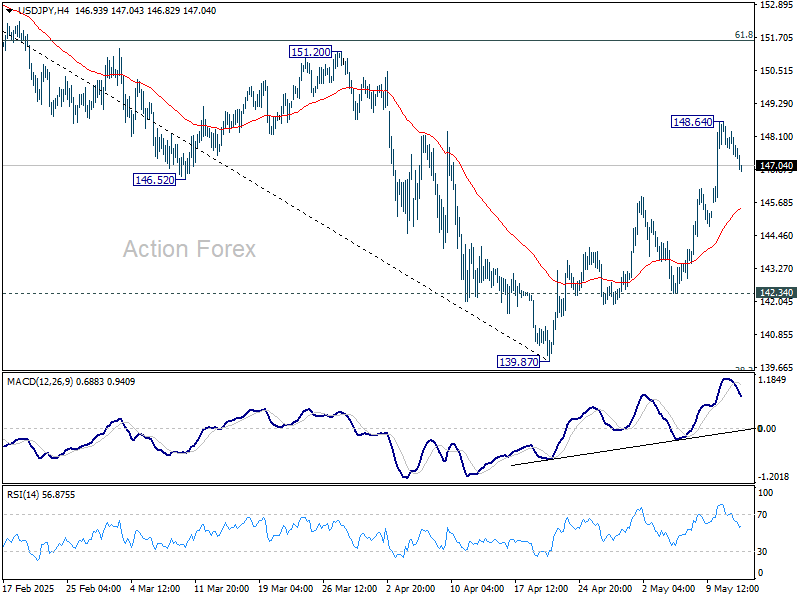
Daily Pivots: (S1) 147.06; (P) 147.79; (R1) 148.21; More...
Intraday bias in USD/JPY is turned neutral first. But further rally is expected as long as 142.43 support holds. As noted before, fall from 158.86 could have completed 139.87 already. Above 148.64 will target 61.8% retracement of 158.86 to 139.87 at 151.60 next.
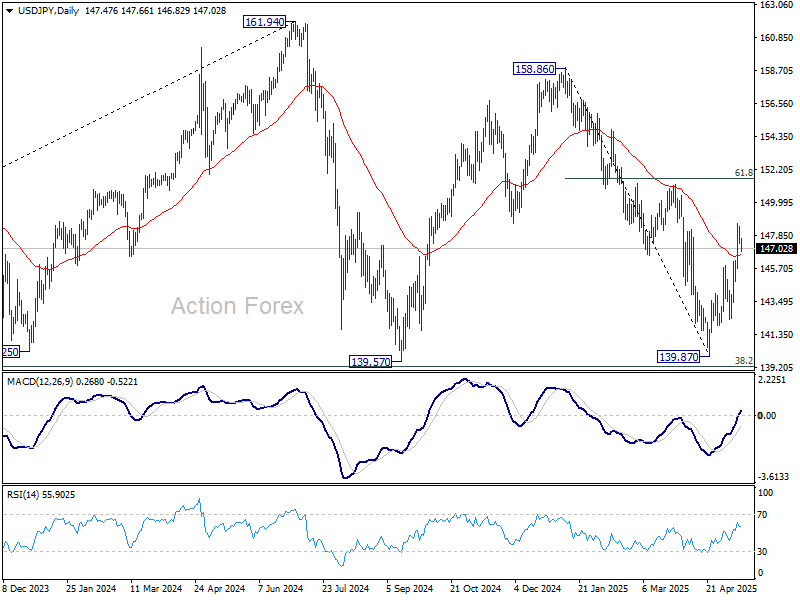
In the bigger picture, price actions from 161.94 are seen as a corrective pattern to rise from 102.58 (2021 low), with fall from 158.86 as the third leg. Strong support should be seen from 38.2% retracement of 102.58 to 161.94 at 139.26 to bring rebound. However, sustained break of 139.26 would open up deeper medium term decline to 61.8% retracement at 125.25.
GBP/USD Daily Outlook
Daily Pivots: (S1) 1.3202; (P) 1.3259; (R1) 1.3363; More...
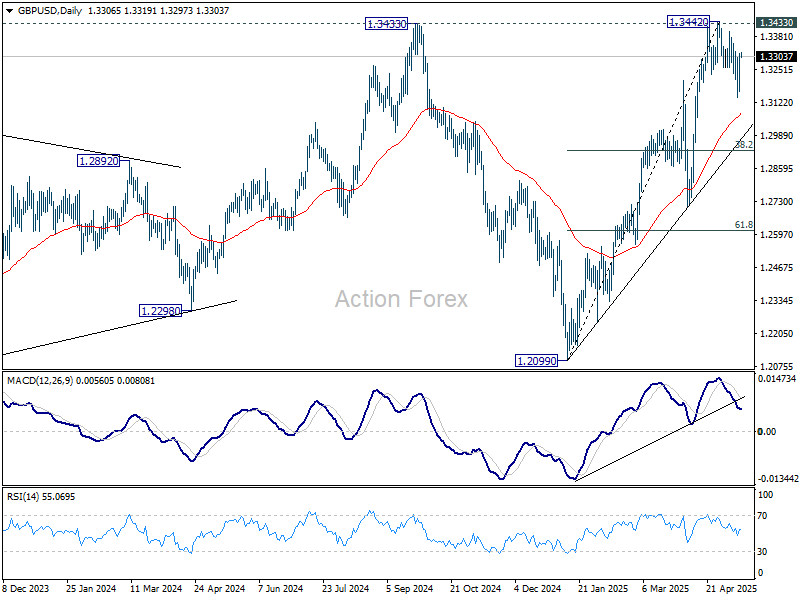
Intraday bias in GBP/USD remains neutral first. On the upside, break of 1.3221 resistance will indicate that pullback from 1.3442 has completed. Retest of 1.3433/42 resistance zone should be seen next. Firm break there will resume larger up trend. On the downside, below 1.3138 will resume the correction. But downside should be contained by 38.2% retracement of 1.2099 to 1.3442 at 1.2929 to bring rebound.
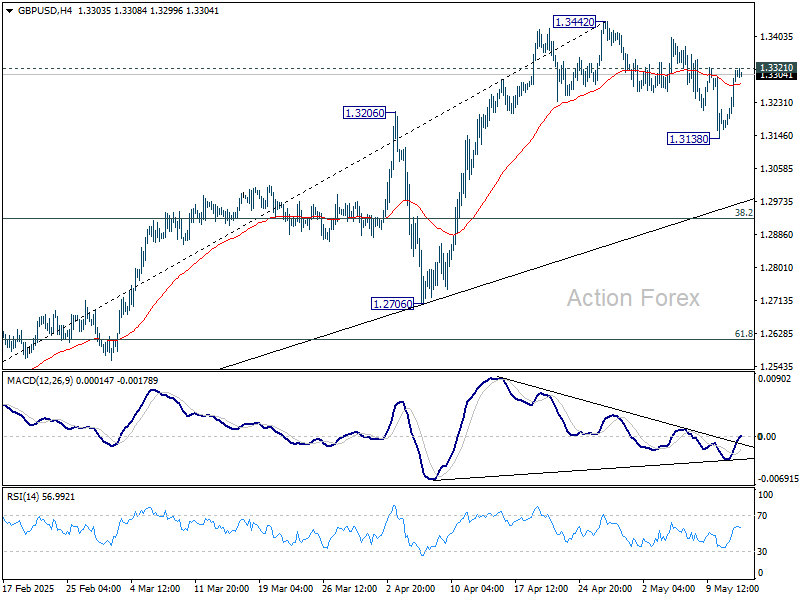
In the bigger picture, price actions from 1.3433 are seen as a corrective pattern to the up trend from 1.3051 (2022 low). Rise from 1.2099 could either be resuming the up trend, or the second leg of a consolidation pattern. Overall, GBP/USD should target 1.4248 key resistance (2021 high) on decisive break of 1.3433 at a later stage.
USD/CHF Daily Outlook
Daily Pivots: (S1) 0.8367; (P) 0.8415; (R1) 0.8442; More….
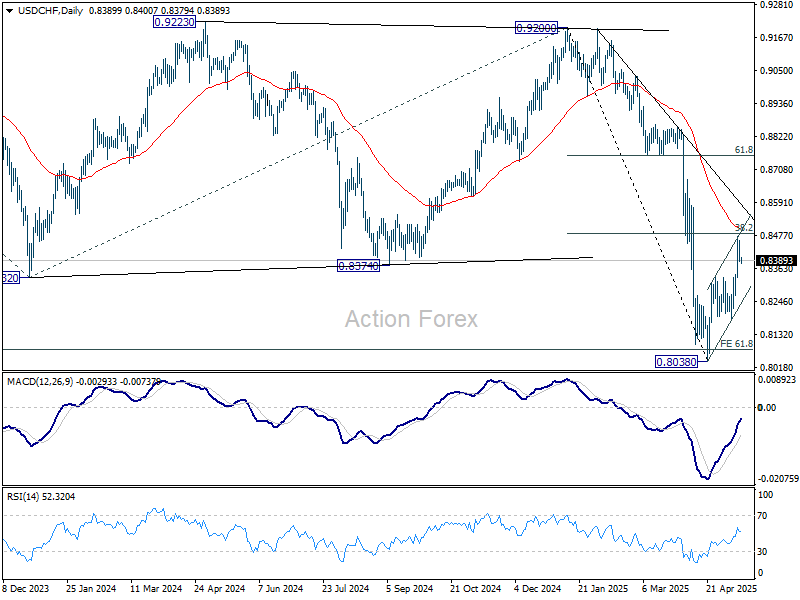
Intraday bias in USD/CHF remains neutral at this point. Strong resistance is expected from 38.2% retracement of 0.9200 to 0.8038 at 0.8482 to limit upside. Break of 0.8330 resistance turned support will turn intraday bias back to the downside. Further break of 0.8184 will bring retest of 0.8038 low. However, sustained trading above 0.8482 will dampen this bearish view and target 61.8% retracement at 0.8756 next.
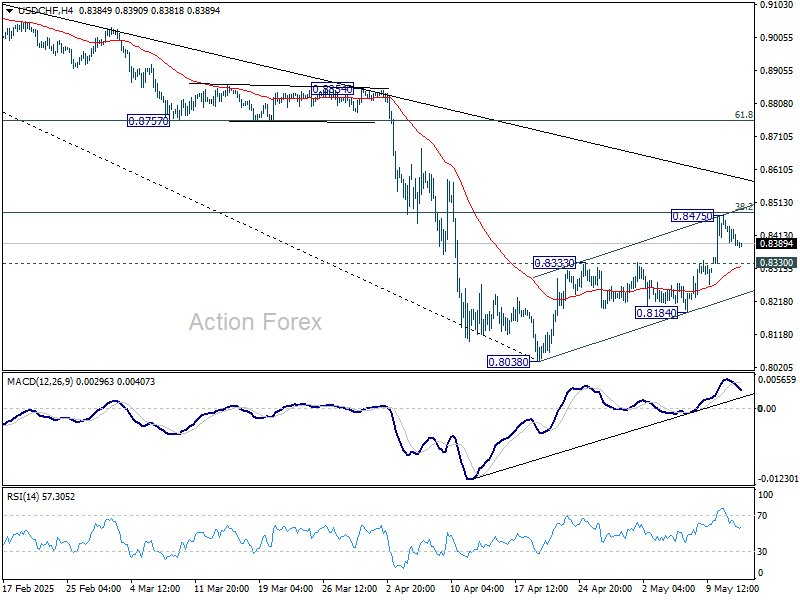
In the bigger picture, long term down trend from 1.0342 (2017 high) is still in progress and met 61.8% projection of 1.0146 (2022 high) to 0.8332 from 0.9200 at 0.8079 already. In any case, outlook will stay bearish as long as 55 W EMA (now at 0.8750) holds. Sustained break of 0.8079 will target 100% projection at 0.7382.
USD/CAD Daily Outlook
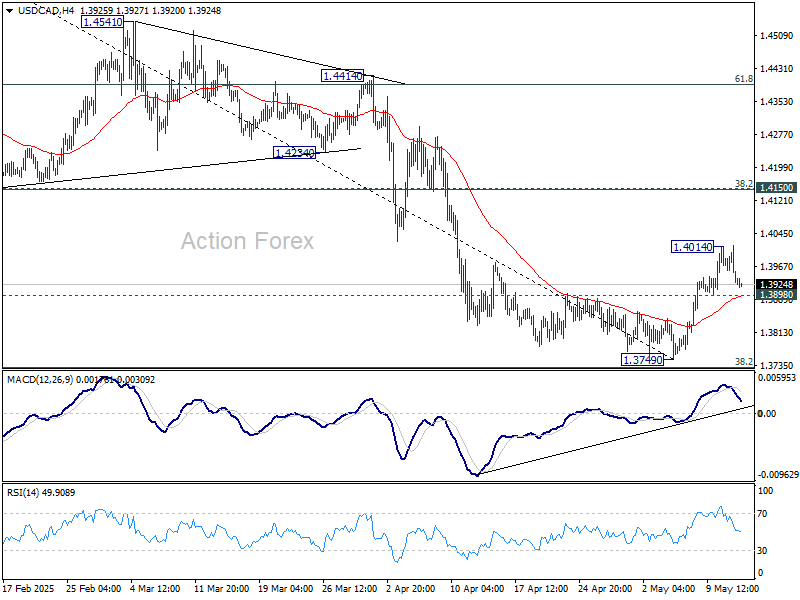
Daily Pivots: (S1) 1.3906; (P) 1.3961; (R1) 1.3991; More...
Intraday bias in USD/CAD is turned neutral first with current retreat. On the upside, break of 55 D EMA (now at 1.4038) will resume the rebound from 1.3749 to 1.4150 cluster resistance (38.2% retracement of 1.4791 to 1.3749 at 1.4147). However, break of 1.3898 minor support will indicate that the rebound from 1.3749 has completed, and bring retest of this low.
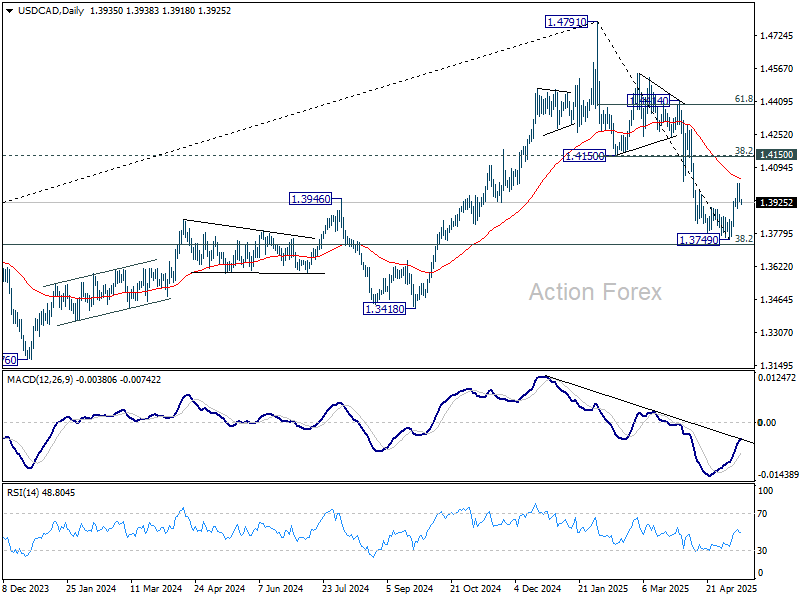
In the bigger picture, price actions from 1.4791 medium term top could either be a correction to rise from 1.2005 (2021 low), or trend reversal. In either case, further decline is expected as long as 1.4150 resistance turned support holds. Firm break of 38.2% retracement of 1.2005 (2021 low) to 1.4791 at 1.3727 will pave the way back to 61.8% retracement at 1.3069.
AUD/USD Daily Report
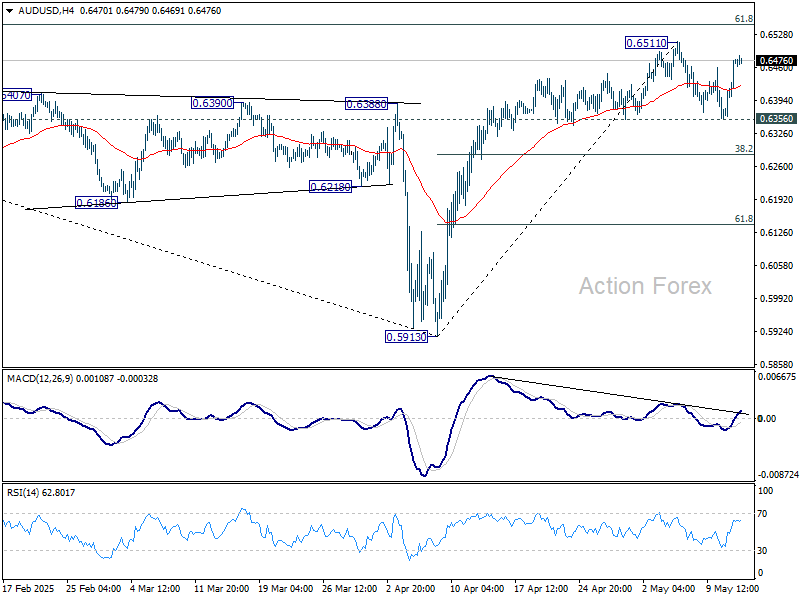
Daily Pivots: (S1) 0.6395; (P) 0.6437; (R1) 0.6513; More...
AUD/USD is staying in range below 0.6511 and intraday bias remains neutral. On the upside, firm break of 0.6511 will resume the rally from 0.5913 to 61.8% retracement of 0.6941 to 0.5913 at 0.6548. However, break of 0.6356 support should confirm short term topping. Intraday bias will be turned back to the downside for 38.2% retracement of 0.5913 to 0.6511 at 0.6283.
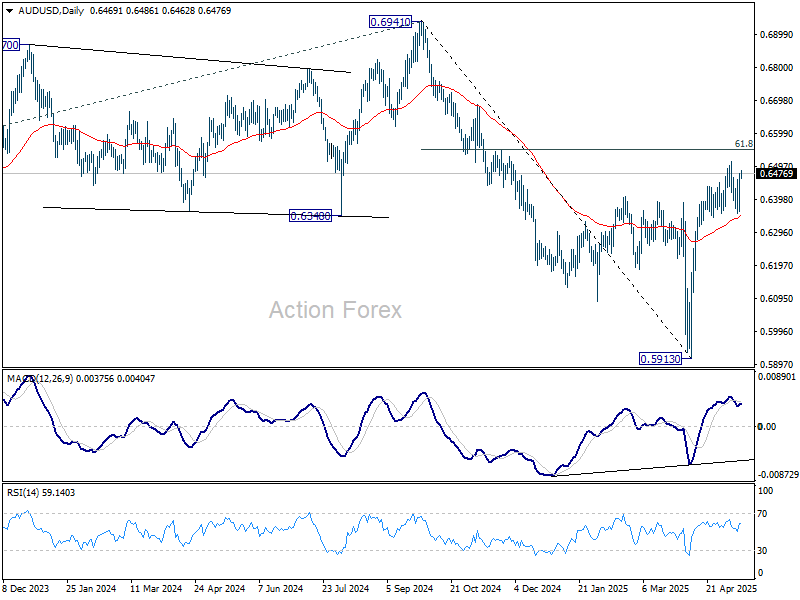
In the bigger picture, as long as 55 W EMA (now at 0.6441) holds, down trend from 0.8006 (2021 high) should resume later to 61.8% projection of 0.8006 to 0.6169 from 0.6941 at 0.5806. However, sustained trading above 55 W EMA will argue that a medium term bottom was already formed, and set up further rebound to 0.6941 resistance instead.
Dollar Rally Stalls, Market Cools, Trade Optimism Tempered by Reality
Global markets showed signs of fatigue overnight as trade optimism gave way to a more cautious tone. In the US, the S&P 500 eked out another gain, turning positive for the year, while DOW lagged and closed modestly lower. The divergence reflects a market still digesting the implications of recent trade developments. In Asia, stock markets also lacked direction, with investors reluctant to chase risk without clearer signs of progress on the trade front.
Despite the positive headlines, investors are coming to terms with the reality that any new trade deal with China is unlikely to resemble a full rollback to pre-conflict conditions. Even if an agreement is reached, it will likely involve layered provisions and protracted enforcement timelines, making the short-term benefits less impactful. Meanwhile, trade discussions with the EU remain stalled, and Brussels is preparing countermeasures should negotiations not advance in the near future. The fragmented state of trade diplomacy is leaving markets in a holding pattern, particularly as geopolitical and political uncertainties remain elevated.
That said, there is cautious hope that more preliminary deals could emerge soon. Market chatter suggests Switzerland, India, and Japan might be next in line for early-stage agreements. Though, like the recent UK deal, these are likely to be agreements in principle rather than fully ratified pacts, requiring extended negotiations before they take effect.
Adding to the anticipation, US National Economic Council Director Kevin Hassett said President Donald Trump is expected to announce a new trade deal upon returning from his Middle East trip. According to Hassett, around 25 negotiations are currently underway, with at least one nearing final confirmation.
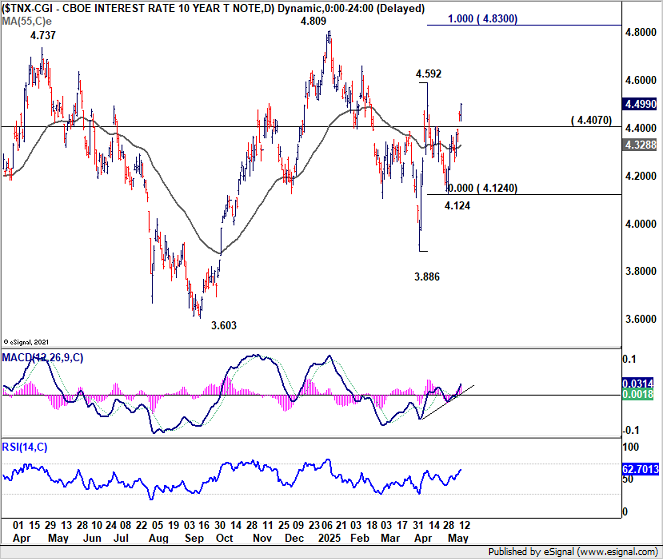
Dollar's rally also lost much momentum, despite extended rise in 10-year yield. Technically, Dollar's bounce earlier in the week look more like part of a corrective rise, then a genuine bullish reversal. As for 10-year yield, rise from 3.886 might be ready to resume with corrective pullback from 4.592 completed at 4.124. Further rally is now in favor to retest 4.592 first. Firm break there will confirm this bullish case and target 100% projection of 3.86 to 4.592 from 4.124 at 4.830.
As for currency performance this week, Aussie is now leading the pack, followed by Kiwi, and then Loonie. Yen remains the weakest, trailed by Swiss Franc and Euro. Dollar and British Pound are trading in the middle of the pack.
In Asia, at the time of writing, Nikkei is down -0.33%. Hong Kong HSI is up 1.42%. China Shanghai SSE is up 0.35%. Singapore Strait Times is down -0.22%. Japan 10-year JGB yield is up 0.008 at 1.457.
Overnight, DOW fell -0.64%. S&P 500 rose 0.72%. NASDAQ rose 1.61%. 10-year yield jumped 0.042 to 4.499.
Japan’s PPI rises 4% yoy in April, record high for 8th straight month
Japan’s PPI rose 4.0% year-on-year in April, easing slightly from 4.3% yoy in March and matching market expectations. Despite the modest slowdown, the index climbed to a fresh record high of 126.3, marking the eighth consecutive month of new highs, highlighting persistent cost pressures at the wholesale level.
However, the data also showed little immediate impact from the sweeping US tariffs announced in early April, thanks in part to the 90-day suspension.
Japan’s Yen-based import price index fell sharply by -7.2% yoy in April, following a -2.4% yoy decline in March. The drop suggests that Yen's appreciation during the market turmoil have helped shield Japanese importers from some of the price shocks, at least for now.
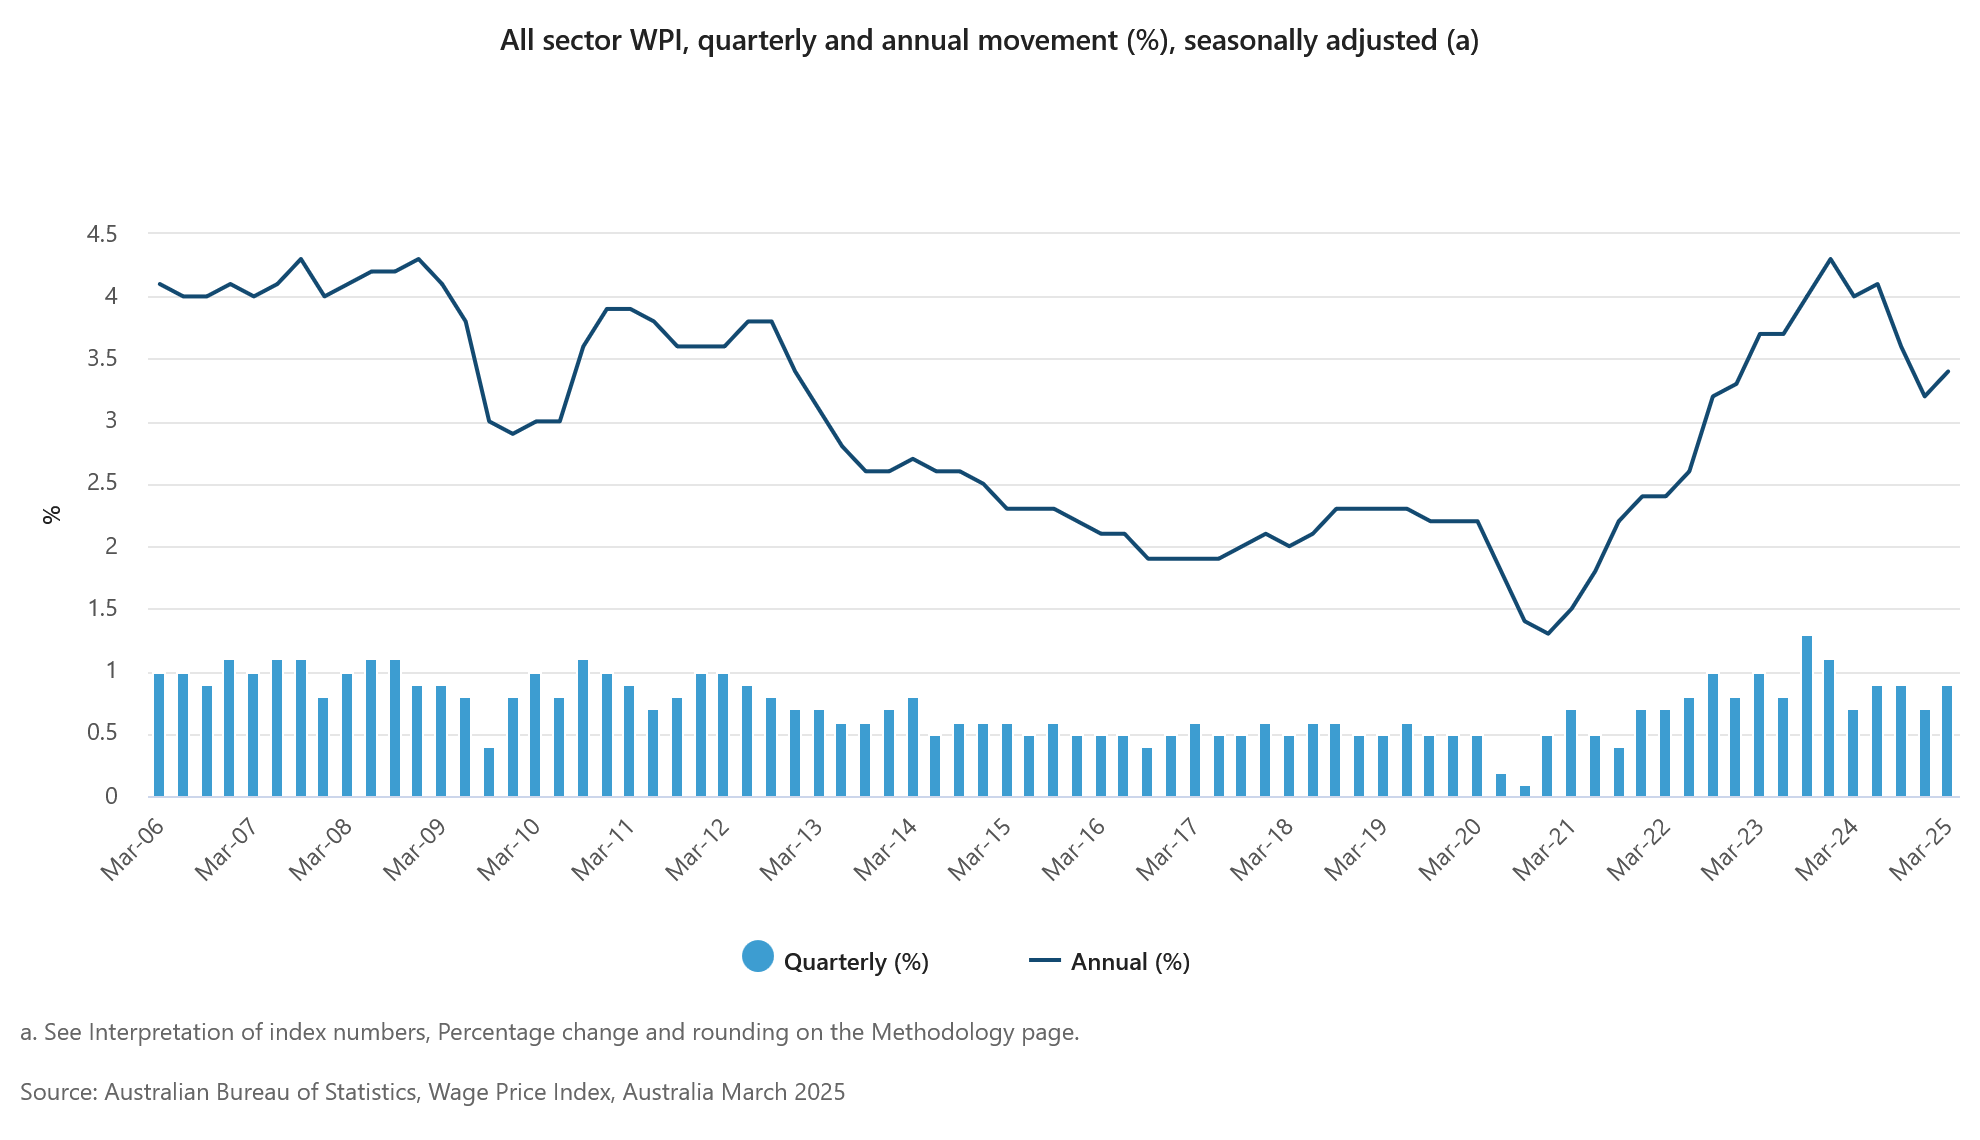
Australian wage growth accelerates to 3.4% yoy in Q1, led by public sector
Australia’s Wage Price Index rose by 0.9% qoq in Q1, slightly above market expectations of 0.8% qoq. Public sector saw a stronger 1.0% qoq gain, outpacing the 0.9% qoq rise in private sector.
On an annual basis, wages grew by 3.4%, up from 3.2% in the previous quarter, marking the first uptick in annual wage growth since mid-2024.
The uptick in annual wage growth was driven primarily by the public sector, which saw a notable increase to 3.6% yoy from 2.9% yoy in Q4. Private sector wage growth was steady at 3.3% yoy.
AUD/USD Daily Report
Daily Pivots: (S1) 0.6395; (P) 0.6437; (R1) 0.6513; More...
AUD/USD is staying in range below 0.6511 and intraday bias remains neutral. On the upside, firm break of 0.6511 will resume the rally from 0.5913 to 61.8% retracement of 0.6941 to 0.5913 at 0.6548. However, break of 0.6356 support should confirm short term topping. Intraday bias will be turned back to the downside for 38.2% retracement of 0.5913 to 0.6511 at 0.6283.
In the bigger picture, as long as 55 W EMA (now at 0.6441) holds, down trend from 0.8006 (2021 high) should resume later to 61.8% projection of 0.8006 to 0.6169 from 0.6941 at 0.5806. However, sustained trading above 55 W EMA will argue that a medium term bottom was already formed, and set up further rebound to 0.6941 resistance instead.
Australian wage growth accelerates to 3.4% yoy in Q1, led by public sector
Australia’s Wage Price Index rose by 0.9% qoq in Q1, slightly above market expectations of 0.8% qoq. Public sector saw a stronger 1.0% qoq gain, outpacing the 0.9% qoq rise in private sector.
On an annual basis, wages grew by 3.4%, up from 3.2% in the previous quarter, marking the first uptick in annual wage growth since mid-2024.
The uptick in annual wage growth was driven primarily by the public sector, which saw a notable increase to 3.6% yoy from 2.9% yoy in Q4. Private sector wage growth was steady at 3.3% yoy.
Japan’s PPI rises 4% yoy in April, record high for 8th straight month
Japan’s PPI rose 4.0% year-on-year in April, easing slightly from 4.3% yoy in March and matching market expectations. Despite the modest slowdown, the index climbed to a fresh record high of 126.3, marking the eighth consecutive month of new highs, highlighting persistent cost pressures at the wholesale level.
However, the data also showed little immediate impact from the sweeping US tariffs announced in early April, thanks in part to the 90-day suspension.
Japan’s Yen-based import price index fell sharply by -7.2% yoy in April, following a -2.4% yoy decline in March. The drop suggests that Yen's appreciation during the market turmoil have helped shield Japanese importers from some of the price shocks, at least for now.
Ethereum Regains Momentum: Can the Rally Push It to $3,000?
Key Highlights
- Ethereum rallied over 25% and cleared the $2,500 resistance.
- ETH surpassed a key bearish trend line with resistance at $1,820 on the daily chart.
- Bitcoin price also rallied and surpassed the $102,500 resistance.
- XRP is showing positive signs and might soon aim for a move above $2.65.
Ethereum Technical Analysis
Ethereum remained stable above $1,650 and started a fresh increase. ETH cleared a few key hurdles near $2,000 to start a fresh surge.
Looking at the daily chart, the price surpassed a key bearish trend line with resistance at $1,820. The price even surpassed the 50% Fib retracement level of the downward wave from the $3,740 swing high to the $1,379 low.
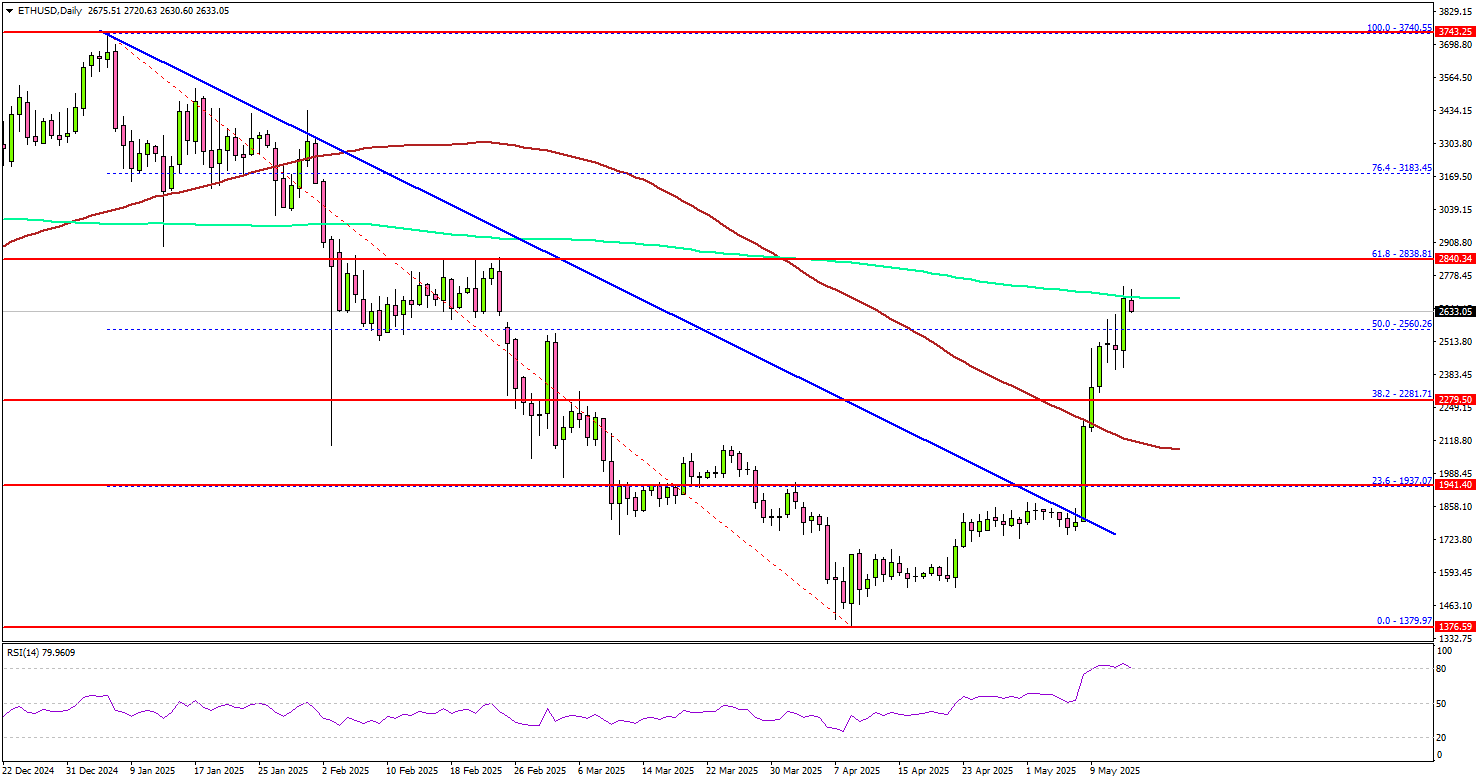
ETH settled above the 100-day simple moving average (red) and now approaches the 200-day simple moving average (green). Immediate resistance is near the $2,720 level.
The next major resistance is near the $2,840 level and the 61.8% Fib retracement level of the downward wave from the $3,740 swing high to the $1,379 low. A daily close above the $2,840 resistance zone could start another steady increase. In the stated case, the price may perhaps rise toward the $3,000 level. The next stop for the bulls may perhaps be $3,120.
On the downside, Ethereum might find support near the $2,350 level. The next major support is $2,280, below which the price could slide toward $2,120. Any more losses might call for a move toward the $2,000 level.
Looking at Bitcoin, there was a steady increase above the $102,000 level, and the price might continue to rise toward the $108,000 level.
Economic Releases
- Fed's Waller speech.
- Fed's Jefferson speech.