
Sample Category Title
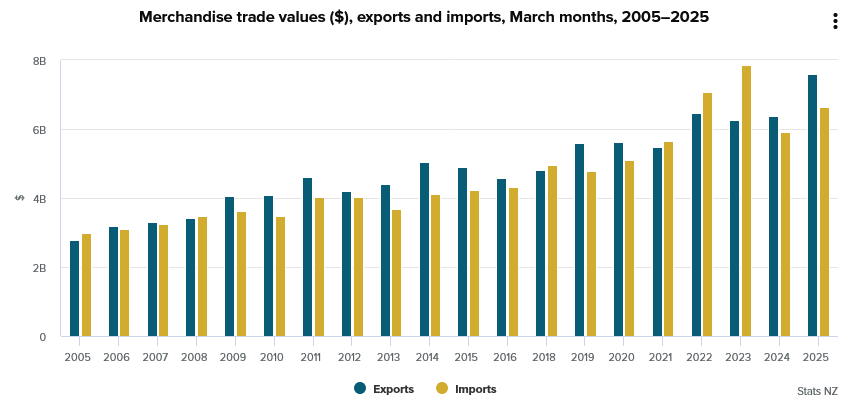
New Zealand posts surprise NZD 970m trade surplus as exports surge 19%
New Zealand recorded stronger-than-expected trade surplus of NZD 970m in March, far exceeding forecasts of NZD 80m. The surprise was driven by a robust 19% yoy increase in goods exports, which rose by NZD 1.2B to NZD 7.6B. Imports also grew, up 12% yoy to NZD 6.6B.
Export performance was particularly strong across key trading partners. Shipments to China rose by NZD 371m (23% yoy), while exports to the US and the EU grew by 22% yoy and 51% yoy respectively. Exports to Japan also increased 11% yoy, although shipments to Australia dipped slightly, down -0.47% yoy.
On the import side, the largest increases came from the US, with a 48% yoy jump worth NZD 243m. This was followed by China and the EU, which posted 14% yoy and 19% yoy gains respectively. Imports from South Korea bucked the trend, falling -12% yoy.
USD/CHF Nosedives—Dollar Decline Triggers Sharp Drop
Key Highlights
- USD/CHF declined heavily below the 0.8380 and 0.8250 levels.
- A major bearish trend line is forming with resistance at 0.8150 on the 4-hour chart.
- EUR/USD rallied above the 1.0450 and 1.0500 resistance levels.
- Gold prices traded to a new record high and surpassed the $3,420 level.
USD/CHF Technical Analysis
The US Dollar faced heavy selling pressure against its peers like Swiss Franc. USD/CHF declined below the 0.8250 and 0.8200 support levels.
Looking at the 4-hour chart, the pair settled below the 0.8200 level, the 100 simple moving average (red, 4-hour), and the 200 simple moving average (green, 4-hour). The bears even pushed the pair below the 0.8050 level.
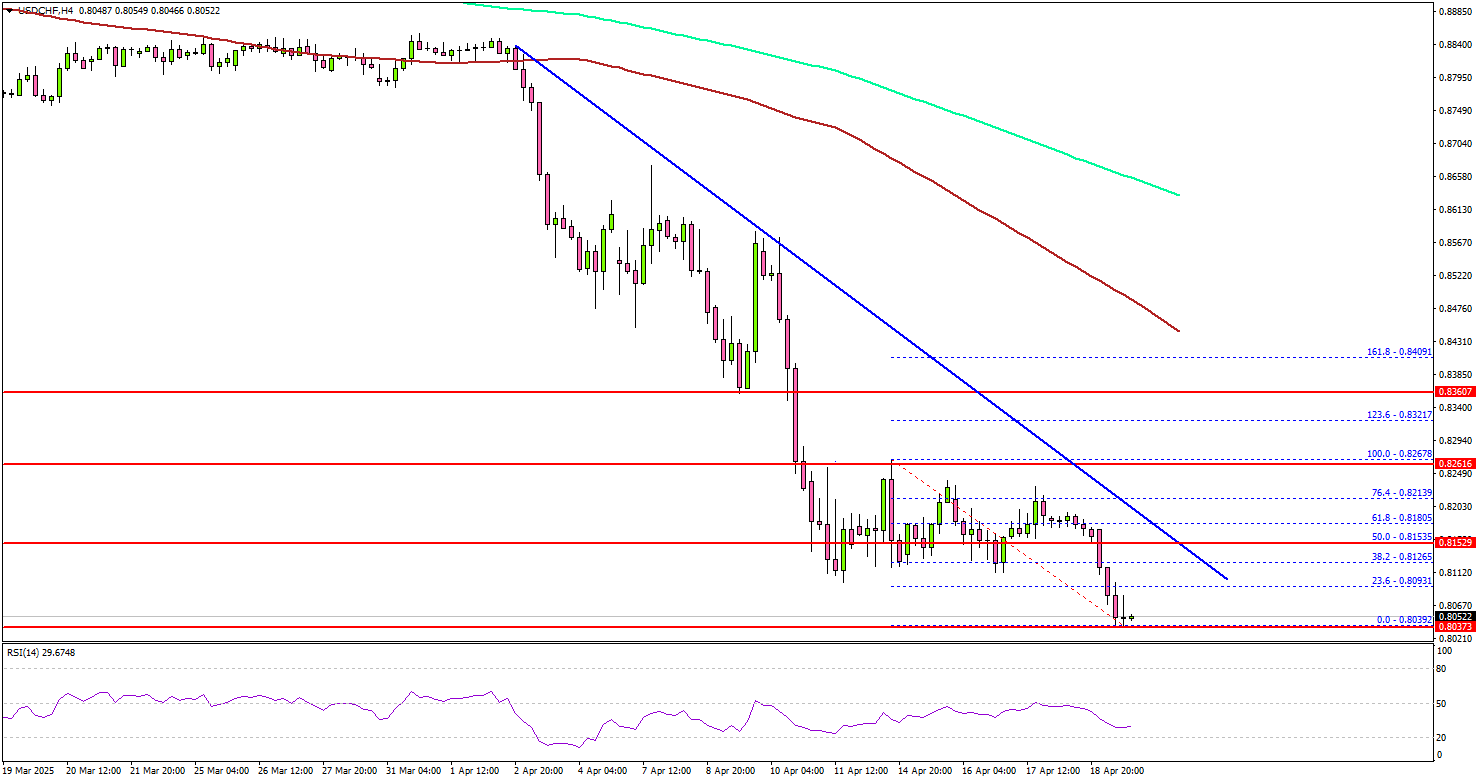
On the downside, immediate support sits near the 0.8000 level. The next key support sits near the 0.7965 level. Any more losses could send the pair toward the 0.7880 level, where the bulls might take a stand.
If there is a recovery wave, the pair could face resistance near the 0.8080 level. The next major resistance is near the 0.8120 level. The main resistance is now forming near the 0.8150 zone.
There is also a major bearish trend line forming with resistance at 0.8150 on the same chart. A close above the 0.8150 level could set the tone for another increase. In the stated case, the pair could even clear the 0.8200 resistance.
Looking at EUR/USD, the bulls remained in action and were able to push the pair to a new multi-month high above the 1.1500 resistance.
Upcoming Economic Events:
- Richmond Fed Manufacturing Index for April 2025 – Forecast -6 versus -4 previous
- Fed's Harker speech.
- Fed's Kashkari speech.
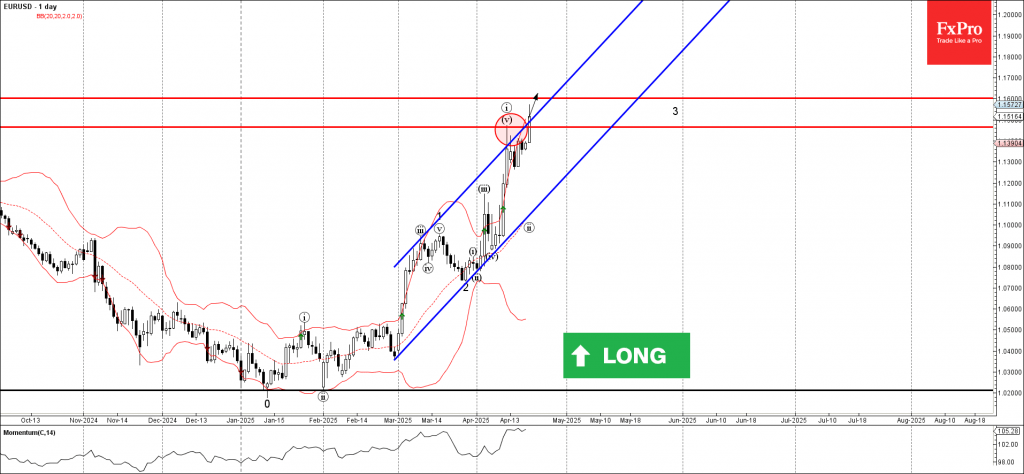
EURUSD Wave Analysis
EURUSD: ⬆️ Buy
- EURUSD broke the resistance area
- Likely to test resistance level 1.1600
EURUSD currency pair recently broke the resistance area between the resistance trendline of the daily up channel from the end of February and the resistance level 1.1465 (which stopped the previous impulse wave i).
The breakout of this area accelerated the active short-term impulse wave 3 from the end of March.
Given the moderately bullish euro sentiment, EURUSD currency pair can be expected to rise to the next resistance level 1.1600 (target price for the completion of the active impulse wave 3).
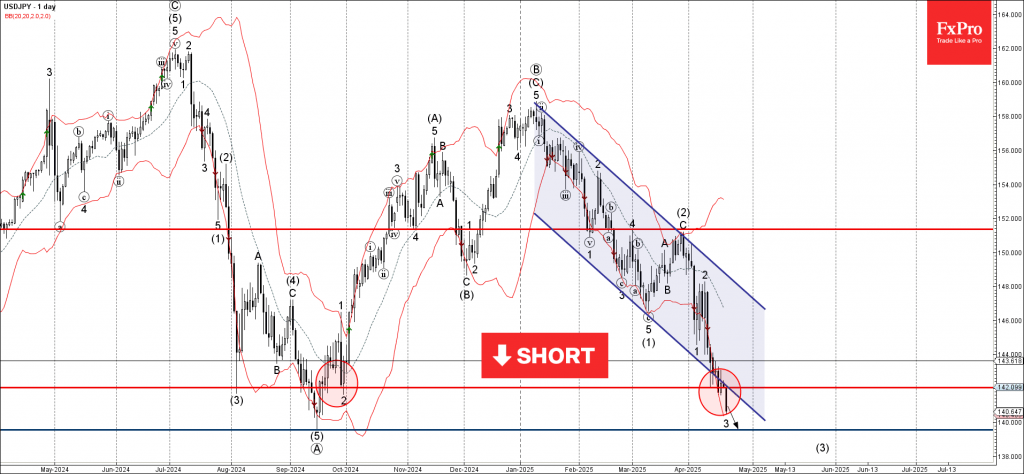
USDJPY Wave Analysis
USDJPY: ⬇️ Sell
- USDJPY broke support area
- Likely to fall to support level 139.55
The USDJPY currency pair recently broke the support area at the intersection of the support trendline of the daily down channel from January and the support level 142.00 (which started the daily uptrend in September).
The breakout of this support area should accelerate the active impulse wave 3, which belongs to the intermediate impulse wave (3) from March.
Given the strongly bearish US dollar sentiment, USDJPY currency pair can be expected to fall to the next support level 139.55 (the former multi-month support level from September).
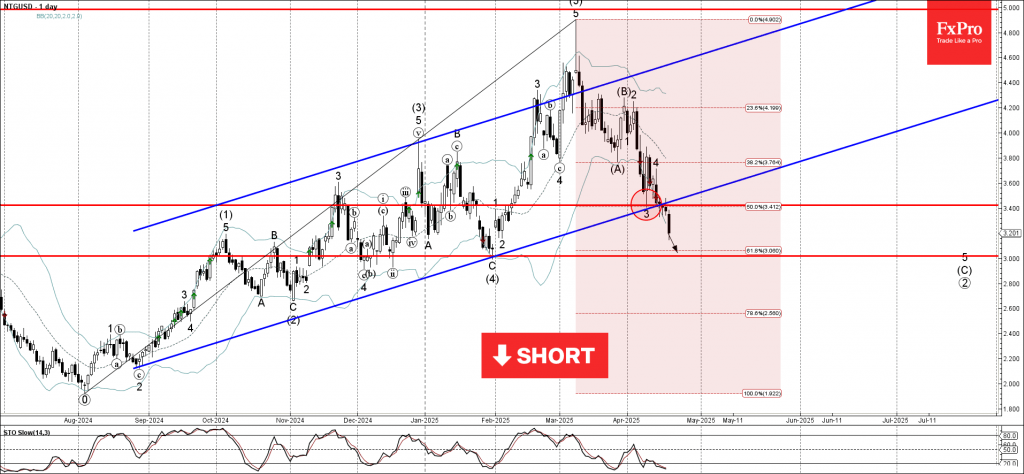
Natural Gas Wave Analysis
Natural gas: ⬇️ Sell
- Natural gas broke support area
- Likely to fall to support level 3.0000
Natural gas recently broke the support area between the support trendline of the weekly up-channel from last August, support level 3.4 and the 50% Fibonacci correction of the daily uptrend from August.
The breakout of this support area accelerated the active short-term impulse wave 5 of the intermediate impulse wave (C) from the end of March.
Natural gas can be expected to fall to the next round support level 3.0000 (target price for the completion of the active impulse wave (C)).
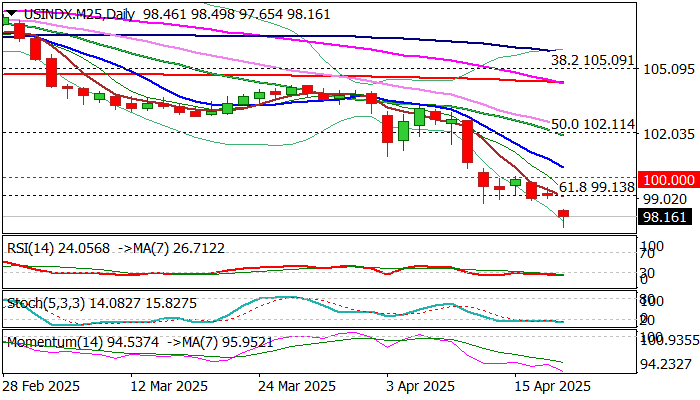
Dollar Index Falls to Three Year Low as Fundamentals Deteriorate
The dollar index remains under increased pressure and trading near new three-year low after it opened with gap-lower at the start of the week.
Turbulent situation on escalation of US-China trade war was fueled by President Trump’s latest criticism of Fed Chair Powel and signals that Powel could be replaced as the central bank does not comply with Trump’s demands to further cut interest rates that would boost economic growth.
Trump’s action produced a massive reaction of the markets, as investors further lost confidence in the US economy, on concerns that potential Powell’s replacement by the President would greatly threat the central bank’s independence.
The dollar remains in a steep downtrend since early February this year, with strong acceleration lower seen in April after Trump announced its latest tariff plan.
Loss of psychological 100 level and likely monthly close below for the first time in three years, contributes to bearish technical picture on all larger timeframes, contributing to negative outlook on deteriorating fundamentals.
Break below the floor of broader range (since 2023) and loss of important Fibo support at 99.13 (61.8% of 89.50/114.72) signals bearish continuation and unmask targets at 97.70 (today’s low / March 2022 higher base) and 95.45 (Fibo 76.4% retracement).
Immediate bias to remain firmly with bears while today’s gap is unfilled, while broken supports at 99.13 and 100 reverted to solid barriers and should cap extended upticks.
Res: 98.77; 99.13; 100.00; 100.45
Sup: 97.70; 95.96; 95.45; 94.60
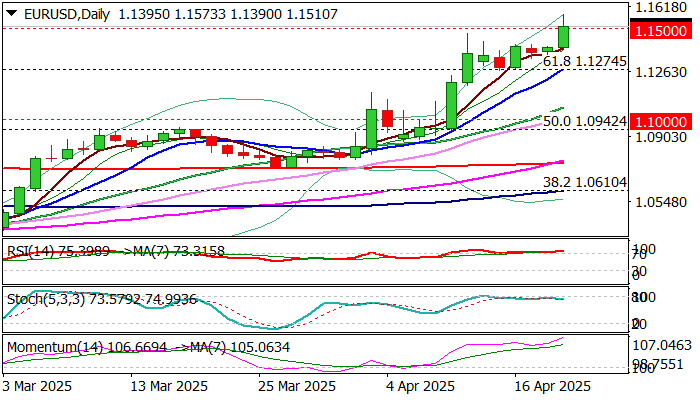
EUR/USD Hits the Highest Levels Since Late 2021 on Fresh Wave of Risk Aversion
EURUSD surged through 1.15 barrier and hit new multi-year high as effect from worsening fundamentals was boosted by a holiday-thinned market on Easter Monday.
The latest escalation of trade war further deflated dollar and provided more support to the single currency, which became replacement to the US currency in growing migration into safety.
Bulls eye round-figure barrier at 1.1600, November 2021 peak at 1.1616 and Fibo 76.4% of 1.2349/0.9535 downtrend at 1.1685, as technical picture remains bullish and deteriorating fundamentals continue to fuel advance.
The EURUSD is in strong bullish acceleration for the third consecutive month and on track for the biggest monthly gain in April since September 2010.
Res: 1.1573; 1.1600; 1.1616; 1.1685.
Sup: 1.1473; 1.1412; 1.1390; 1.1275.
Goolsbee defends Fed independence, warns against political interference
Chicago Fed President Austan Goolsbee strongly defended the central bank’s independence in remarks to CNBC, warning that undermining the Fed’s autonomy could have serious long-term economic consequences.
He emphasized that maintaining credibility around the Fed’s 2% inflation target depends on its ability to act free from political pressure.
“When there is interference over the long run,” Goolsbee said, “it’s going to mean higher inflation, worse growth, and higher unemployment, because there’s just going to be "a little less willingness to step up and do the hard things when the moment is tough".
Goolsbee, who joined the Fed over two years ago, stressed that the economic consensus is overwhelmingly in favor of central bank independence. He pointed to global examples where the lack of such independence has led to significantly worse outcomes—higher inflation, weaker growth, and elevated unemployment.
His remarks come amid heightened concerns over potential political pressure from the White House, as reports circulate about President Trump exploring legal avenues to remove Fed Chair Jerome Powell.
Dollar Repeats Bearish Pattern of the 1980s and 2000s
After four consecutive weeks of decline, the dollar index started the new Monday by continuing its move into the territory of three-year lows. Once again, a worrying sign is that this dollar weakness is not translating into buying in stocks or bonds — their indices are also losing ground.
From a technical standpoint, the dollar index has broken through the 161.8% level of the initial impulse from the highs at the start of the year to a significant pause in early March. The DXY received little to no support around the 99–100 area, which had triggered reversals over the past two years.
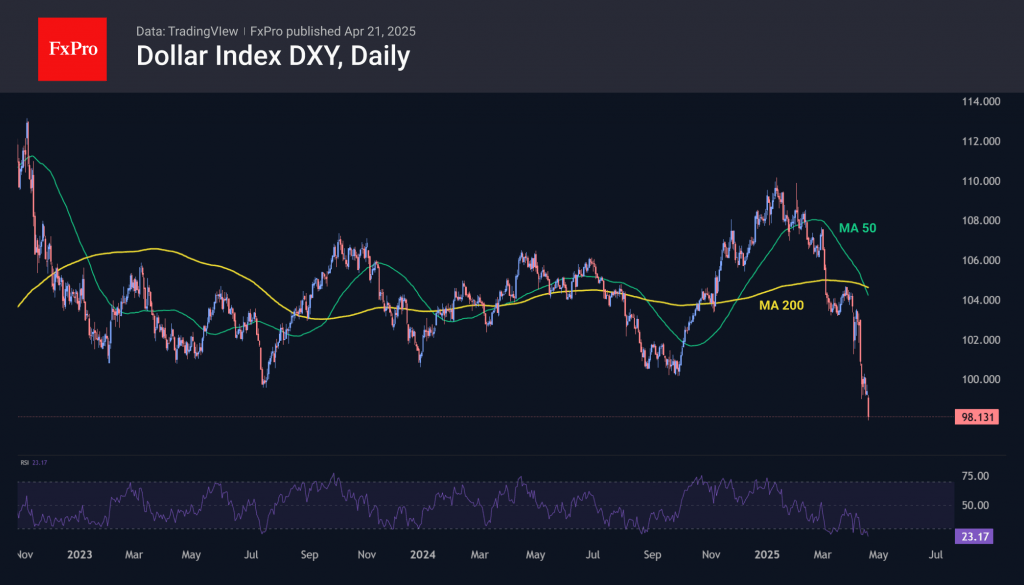
The dollar index is now trading around the same levels it held during the second half of Trump’s previous presidential term, from 2018 to the first half of 2020. On the daily timeframes, the RSI is showing the deepest oversold conditions since July 2020, and on the weekly chart — since 2017.
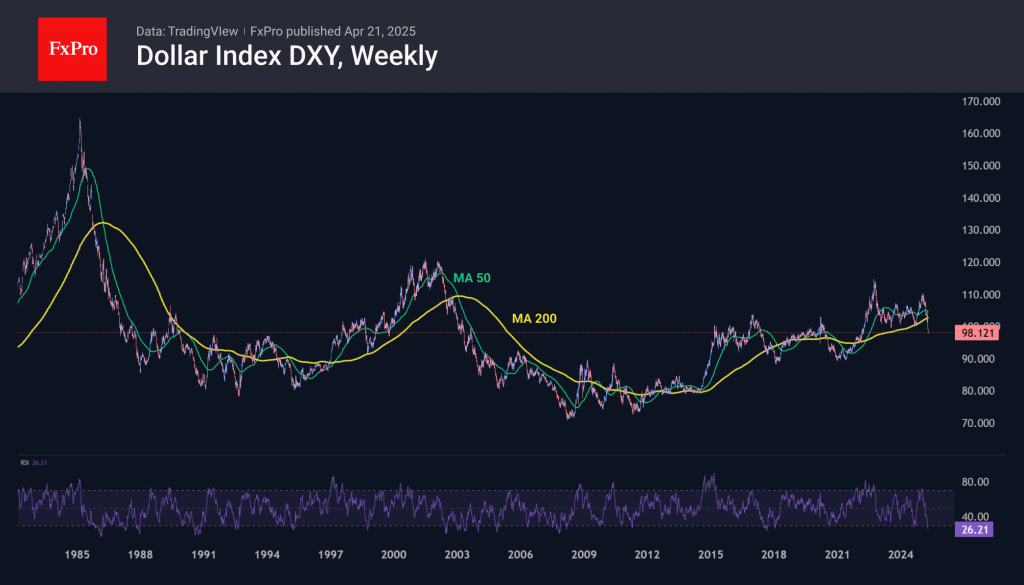
Although this setup creates favourable conditions for a rebound, previous instances have led not to a full reversal but to consolidation and further decline. A confident break below the 200-week moving average underlines the strength of the current sell-off.
In the history of free-floating forex markets — roughly the past half-century — the current situation on the long-term charts could be only the third similar case, following the episodes of the mid-1980s and early 2000s. In those cases, peaks in the dollar were followed by two and six years of decline, shaving off 45% and 40% respectively. In both instances, the dollar went on to update its historical lows, while a major side effect was global recession and a serious downturn in financial markets.
Focusing solely on the implications for the US currency, a repeat of the 1980s and 2000s patterns suggests a potential move below 70, although this could take years. A more immediate and realistic target for bears is a pullback towards the 90 area on the index, where reversals took shape in 2018 and 2020. A gradual decline, akin to the 2002–2008 period, appears more likely than a near-vertical collapse reminiscent of the 1980s. Along the way, prolonged consolidations and even substantial rebounds are possible.