Sample Category Title
Elliott Wave Analysis Indicates EURUSD Extending Higher in Impulsive Structure
The EURUSD currency pair is showing strong signs of continuing its upward trend, based on Elliott Wave analysis. Since its low on September 26, 2022, the pair has been climbing. However, it hasn’t yet hit its projected target of 1.19. This suggests more room to grow in the long term. For now, the pair remains a good opportunity for buyers as long as it doesn’t drop below the key support level of 1.0876.
Looking at a shorter time frame, starting from March 27, 2025, EURUSD is moving in a classic five-step upward pattern. The first step peaked at 1.1146, followed by a brief dip to 1.087. The pair then surged to 1.147, and pulled back slightly to 1.126. It is now expected to push higher to complete this short-term cycle. After that, a temporary dip is likely before the upward trend resumes.
In simple terms, as long as the pair stays above 1.0876 and hasn’t reached 1.19, any short-term declines should attract buyers in 3, 7, or 11 swing looking for more gains. Traders can watch for these dips as opportunities to join the bullish trend, with the next significant moves likely to unfold soon.
EURUSD 60 Minute Elliott Wave Chart

EURUSD Video
https://www.youtube.com/watch?v=k8nrXauq-BQ
USD/JPY Bears Take Control—Further Decline Possible
Key Highlights
- USD/JPY started a fresh decline below the 145.00 level.
- A short-term contracting triangle is forming with resistance at 143.10 on the 4-hour chart.
- EUR/USD could aim for a move above the 1.1420 resistance zone.
- Gold prices traded to a new record high above $3,350 and started a consolidation phase.
USD/JPY Technical Analysis
The US Dollar failed to start a recovery wave and extended losses against the Japanese Yen. USD/JPY traded below the 145.00 support to enter a bearish zone.
Looking at the 4-hour chart, the pair settled well below the 144.20 support, the 100 simple moving average (red, 4-hour), and the 200 simple moving average (green, 4-hour). The pair even declined below the 142.50 support.
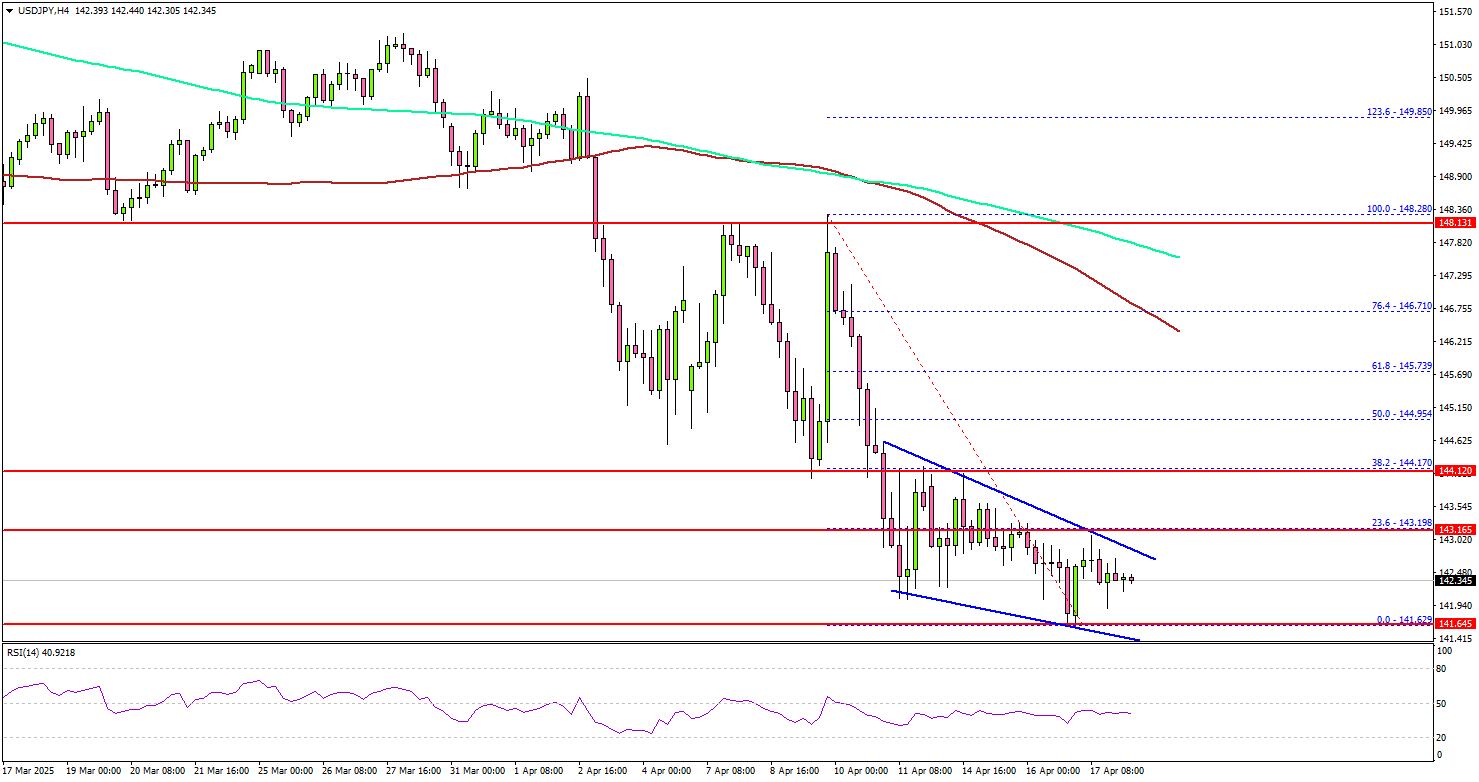
A low was formed at 141.62 and the pair is now consolidating losses. If there is a fresh increase, the pair could face resistance near the 143.10 level. There is also a short-term contracting triangle forming with resistance at 143.10 on the same chart.
The next major resistance is near the 143.50 level. The main resistance is now forming near the 144.20 zone. A close above the 144.20 level could set the tone for another increase. In the stated case, the pair could even clear the 145.00 resistance.
On the downside, immediate support sits near the 141.50 level. The next key support sits near the 140.80 level. Any more losses could send the pair toward the 140.00 level.
Looking at Gold, the price rallied to a new record high above $3,350 and now the bulls might soon aim for a move toward the $3,400 level.
Upcoming Economic Events:
- Fed's Daly speech.
Japan’s CPI core rises to 3.2% yoy, rice prices surge at another record
Japan’s CPI core (excluding fresh food) accelerated from 3.0% yoy to 3.2% yoy in March, matching expectations, and marking the third consecutive year it has remained above BoJ’s 2% target. CPI core-core, which strips out both food and energy, climbed more sharply from 2.6% yoy to 2.9% yoy. While the headline CPI eased slightly from 3.7% yoy to 3.6%yoy , the data overall suggest inflation remains stubbornly elevated.
A standout in the inflation breakdown was the extraordinary surge in rice prices, which soared 92.5% yoy, the fastest pace since records began in 1971. The spike is being driven by a confluence of factors including poor harvests caused by extreme heat in 2023 and consumer panic-buying following earthquake warnings last year. This is the sixth consecutive month that rice inflation has hit record levels.
In response, the Japanese government has intervened by releasing over 210k tonnes from its rice stockpile and plans to auction an additional 100k tonnes this month to stabilize supply.
Beyond food, prices for household durable goods rose by 6.5% yoy, accelerating from 5.4% yoy in February. Energy prices, though still high, eased slightly from 6.9% yoy to 6.6% yoy.
The Weekly Bottom Line: Tariffs Create A “Challenging Scenario” For The Fed
Canadian Highlights
- The Bank of Canada held the policy rate at 2.75% and, in a break from tradition, refrained from publishing its usual forecast.
- The Monetary Policy Report outlined two illustrative scenarios depending on different U.S. tariff policy paths. Both marked a downgrade from January’s projections.
- Economic data released this week showed that the housing market continues to crack, while inflation edged lower.
U.S. Highlights
- News on the trade front this week included the U.S. administration tightening rules on chips exports to China and promising tariffs on imports on electronics in the near future.
- Retail sales report showed that the prospect of tariff-driven price hikes spurred consumers to go on a pre-emptive shopping spree in March to replace aging vehicles and stock up on materials for home renovations.
- Fed Chair Jerome Powell acknowledged the trade conflict presents a “challenging scenario” for the central bank, but re-iterated that the central bank was “well positioned to wait for greater clarity”.
Canada – Monetary Policy Can’t Fix a Trade War, All Eyes on Fiscal Policy
For a short Easter week, there was no shortage of eggs to crack open, but the biggest one was the Bank of Canada’s decision and the accompanying Monetary Policy Report (MPR). After cutting interest rates for the past seven consecutive announcements, the Bank chose to hold the policy rate steady at 2.75%. The Bank pointed out that it had already reduced interest rates 25 basis points in both January and March in the face of tariff uncertainty, but with the path ahead no clearer decided to leave the policy rate unchanged “as we gain more information about both the path forward for US tariffs and their impacts”. The Loonie edged higher on the news, while both bonds and equities posted modest gains.
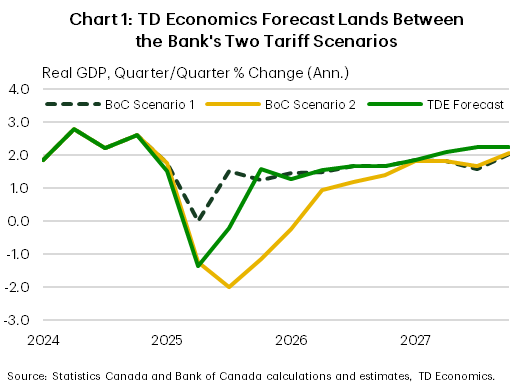
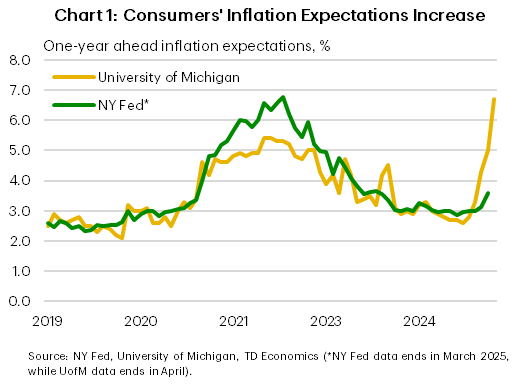
In a break from tradition, the Bank didn’t lay its usual forecast egg. Instead, it offered two illustrative scenarios that explore different paths for U.S. tariff policy. This isn’t the first time the Bank has skipped publishing point forecasts. Five years ago, during the early days of the pandemic, it omitted its usual projection tables and instead offered illustrative scenarios, with outcomes tied to how quickly the virus would recede. This time, the outlook hinges on trade policy. Scenario 1 assumes limited tariffs, weaker growth, and inflation sticking close to 2%. Scenario 2 involves a full-blown year-long trade war, resulting in a recession in both Canada and the U.S. and inflation rising to 3% by 2026. Our own forecast, which assumes tariffs remain in place for six months, lands roughly in the middle (Chart 1).
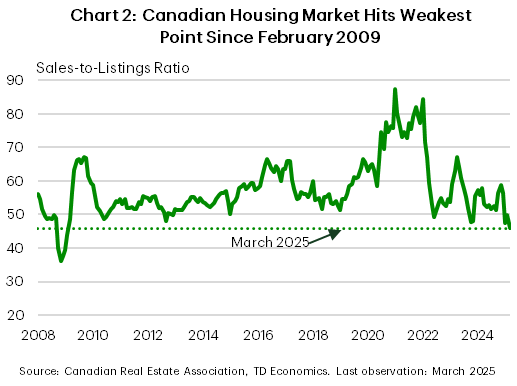
Either way, both scenarios mark a downgrade from January’s MPR. And the Bank acknowledged that the real economy is already softening. The labour market has weakened, and consumer and business recession expectations have risen. Now the housing market has cracked: a combination of weaker sales and rising listings pushed the national sales-to-new listings ratio down to 45.9% in March — a buyer’s market and the lowest level since February 2009 (Chart 2).
On the inflation front, the Bank expects “tariffs and supply chain disruptions to push up some prices”, but this will depend on the evolution of tariffs and how quick businesses are to pass on costs. March CPI offered some relief, with cheaper gas and travel tour prices easing year-over-year inflation, despite upward pressure from the full reinstatement of the GST/HST. The Bank now expects inflation to dip further in Q2, due to the elimination of the consumer carbon tax and lower global oil prices. In both scenarios, tariff-related inflation is expected to peak next year. From an inflation risk perspective, the Bank sees a fairly balanced outlook, with potential supply chain disruptions and higher inflation expectations on the upside, and a weaker-than-expected economy and financial stress on the downside.
Still, it’s fair to ask: why pause rate cuts now, when inflation is relatively under control and its risks balanced, while growth clearly tilting lower? We think the answer lies in policy uncertainty. The Bank is waiting for more clarity on what tariffs look like and the fiscal policy response—something that won’t arrive until after the election on April 28th. As the Bank has pointed out, monetary policy cannot offset the impacts of a trade war, nor can it resolve policy uncertainty. The Bank doesn’t want to count its chickens before they hatch and for now, caution is the name of the game.
U.S. – Tariffs Create A “Challenging Scenario” For The Fed
Trade policy developments remained in sharp focus during this holiday-shortened week. Markets continued to be whipsawed by what have become near-daily updates on the trade front. Investors breathed a sigh of relief after news broke that some electronics imports from China would be exempt from the 145% tariff, and instead only face the smaller 20% IEEPA tariffs. However, the relief was short lived as both President Trump and Commerce Secretary Lutnick noted that these products will fall in scope under the broader Section 232 review of semiconductors, which is likely to be announced over the coming weeks/months. In blow to the tech industry and advanced manufacturing, the U.S. tightened the rules on exports of chips to China, produced by Nvidia and ADM.
The market selloff intensified following comments from Fed Chair Jerome Powell, who acknowledged the trade conflict presents a “challenging scenario” for the central bank. With tariffs likely to push prices higher while slowing economic growth, the Fed faces a tough choice: maintain elevated interest rates to support price stability or cut rates to support the labor market. Powell offered no clear guidance. However, recent communications from Fed officials suggest rising inflation expectations and steeper-than-expected tariffs have the FOMC more concerned about long-term inflation risks and willing to tolerate some economic softening (Chart 1).
Anticipation of higher prices may already be influencing consumer behavior. Wednesday’s retail sales report showed that the prospect of tariff-driven price hikes spurred a pre-emptive shopping spree in March. Retail sales jumped 1.4%, as consumers rushed to dealerships and stores to replace aging vehicles and stock up on home renovation materials. Sales of vehicles and auto parts, as well as building materials and equipment, saw strong gains. A pull-forward in demand was also evident in electronics and sporting goods.
Some of this behavior may carry over into April, spurred by the intensifying trade dispute with China. However, we expect it to mark a final burst before consumers begin tightening their purse strings as the price impacts from tariffs are passed onto the consumer and erode household purchasing power. Based on the rates announced to date, we estimate the average household will face an increase in living costs of approximately $3,600 per year. Tax cuts could provide some offset. If President Trump’s promised tax cuts are fully implemented, we estimate that it would lift household’s income by around $2,700. This is $900 short of offsetting the tax hike from tariffs, leaving the average household worse off.
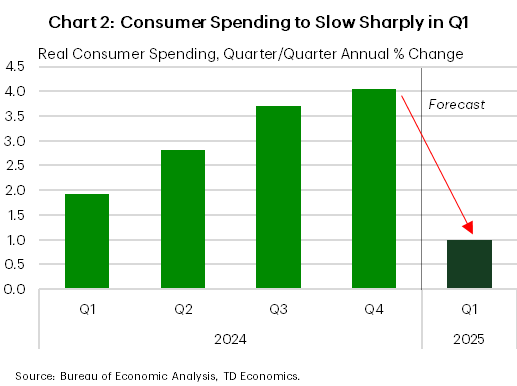
A hit to household wealth, higher goods prices and rising unemployment down the road rate will put the brakes on spending. A notable slowdown is likely to show up in Q1, with consumer spending expected to expand by just 1% (annualized) – down sharply from 4.0% in Q4 of 2024. A further softening in Q2 is looking increasingly likely (Chart 2). Without the backing of strong consumer spending, the U.S. economic engine could sputter this year. While we still believe a recession can be avoided, risks to the outlook are increasingly tilted to the downside.
Weekly Economic & Financial Commentary: Economic Growth Holding On, for Now
Summary
United States: Economic Growth Holding On, for Now
- Real GDP growth is slowing but still holding on before an expected drag from tariffs kicks in. In March, retail sales rose solidly. Total industrial production fell during the month; however, manufacturing output gained. Housing starts pulled back sharply, though building permits increased.
- Next week: New Home Sales (Wed.), Existing Home Sales (Thu.), Durable Goods (Thu.)
International: Foreign Central Bank Policy Decisions Come Amid Heightened Uncertainty
- This week saw a couple of significant announcements from G10 central banks. The European Central Bank lowered its Deposit Rate by 25 bps to 2.25%, and in our view, the accompanying statement leaned slightly dovish overall. The Bank of Canada held its policy rate steady at 2.75% and offered limited future guidance on policy. Elsewhere, data from China showed the economy enjoyed a reasonably solid start to the year, but recently-racheted-up U.S. tariffs on China suggest this momentum may not be sustainable.
- Next week: Japan CPI (Fri.), Eurozone PMIs (Wed.)
Credit Market Insights: Household Debt Coming into Focus
- Recently released data from the Federal Reserve Bank of New York's Household Debt and Credit Report provides some clarity on where households ended last year. While nominal debt has continued to edge higher, the rate at which households are borrowing has continued to taper.
Topic of the Week: Tariff Hikes to Exert Pressure on Construction Costs
- Another week, another tariff story. Broad-based tariffs stand to pressure the construction industry, where still-elevated input costs and interest rates have crimped activity.
March Data to Give Early Clues About Canada’s Economy Under Tariffs
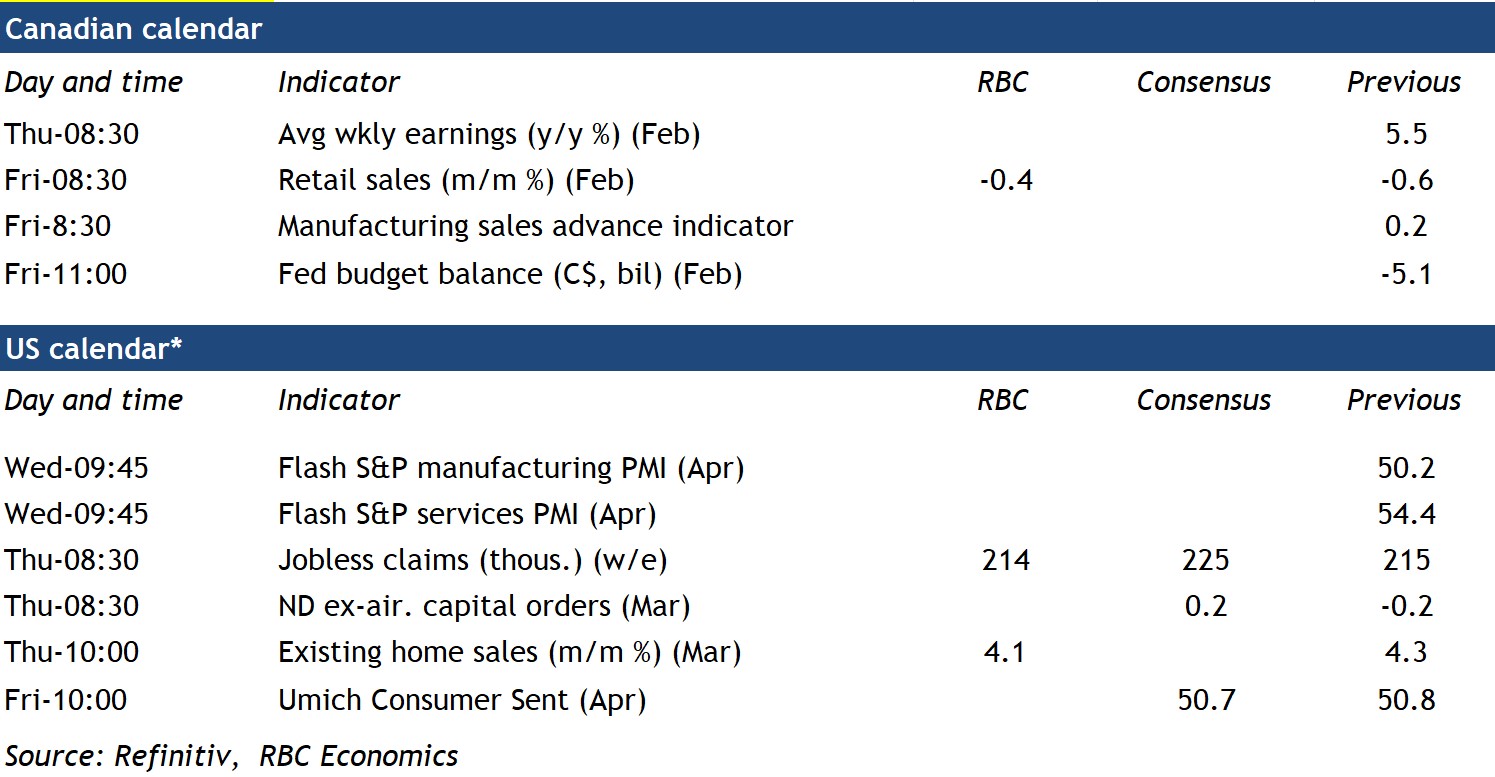
Preliminary retail and manufacturing sales for March next week Friday will offer early, but important clues on how the Canadian economy has fared under U.S. tariffs.
Measures in place included 25% blanket tariffs on U.S. imports from Canada briefly in effect on March 4th before being rolled back to just non-USMCA compliant trade days later, and an additional 25% tariffs on Canadian steel and aluminum products from March 12. Canada retaliated with 25% tariffs on $60 billion worth of U.S. imports as well. Tariffs and counter tariffs on finished autos were added in April.
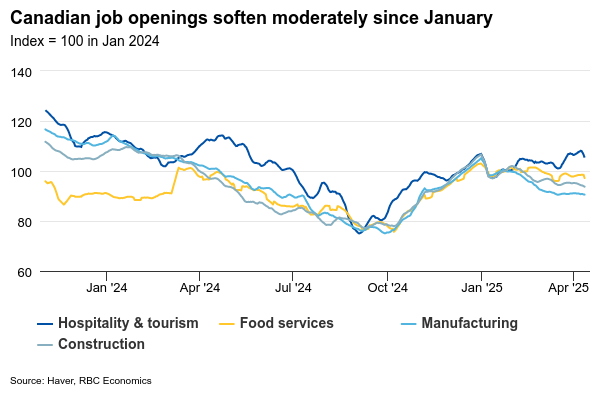
March is also when tariff-related uncertainty pushed consumer sentiment to its lowest level in history. However, early “hard” data into April has been more resilient. Restaurant bookings were still running 20% above year-ago levels, according to OpenTable. Job losses in March reversed some earlier gains, but data on job openings from indeed.com are still well above lows in late last year including in the heavily trade-sensitive manufacturing sector.
On Friday’s Canadian retail sales data, RBC’s tracking of consumer spending has suggested a more gradual softening so far in line with Statistics Canada’s preliminary estimates that February retail sales edged 0.4% lower. But, the advance estimate for sales in March could look stronger. Auto sales surged by 8% on a seasonally adjusted basis from February to March by our count, likely due to tariff front-loading and our own tracking of card transactions remained relatively resilient.
We still don’t see current tariffs on Canada from the U.S. (with an average 3.6% tariff rate) as severe enough to plunge the economy into a recession. The tariff hike on Canada is now the lowest among countries after the U.S. imposed minimum 10% tariffs on all countries and exempted CUSMA-compliant trade from Canada and Mexico this month.
Downside risks that a much softer U.S. outlook this year could spill over to Canada are growing. But, Bank of Canada interest rate cuts over the last year are still filtering through to support the economy with a lag. And, there is room for fiscal policy to ramp up to support the economy should it soften more significantly than we expect. For now, we expect current tariffs on Canada remain, driving gross domestic product growth slower and unemployment higher in Canada this year.
Week ahead data watch
Job openings in Canadian SEPH data out on Thursday will be watched closely for further evidence that hiring demand was slowing in February. Earlier-reported labour market data already showed employment growth stalling in February and declining outright by 30k in March. Job postings on indeed.com softened in February and March, but showed some signs of stabilizing at levels still well above the lows of late last year early in April.
.
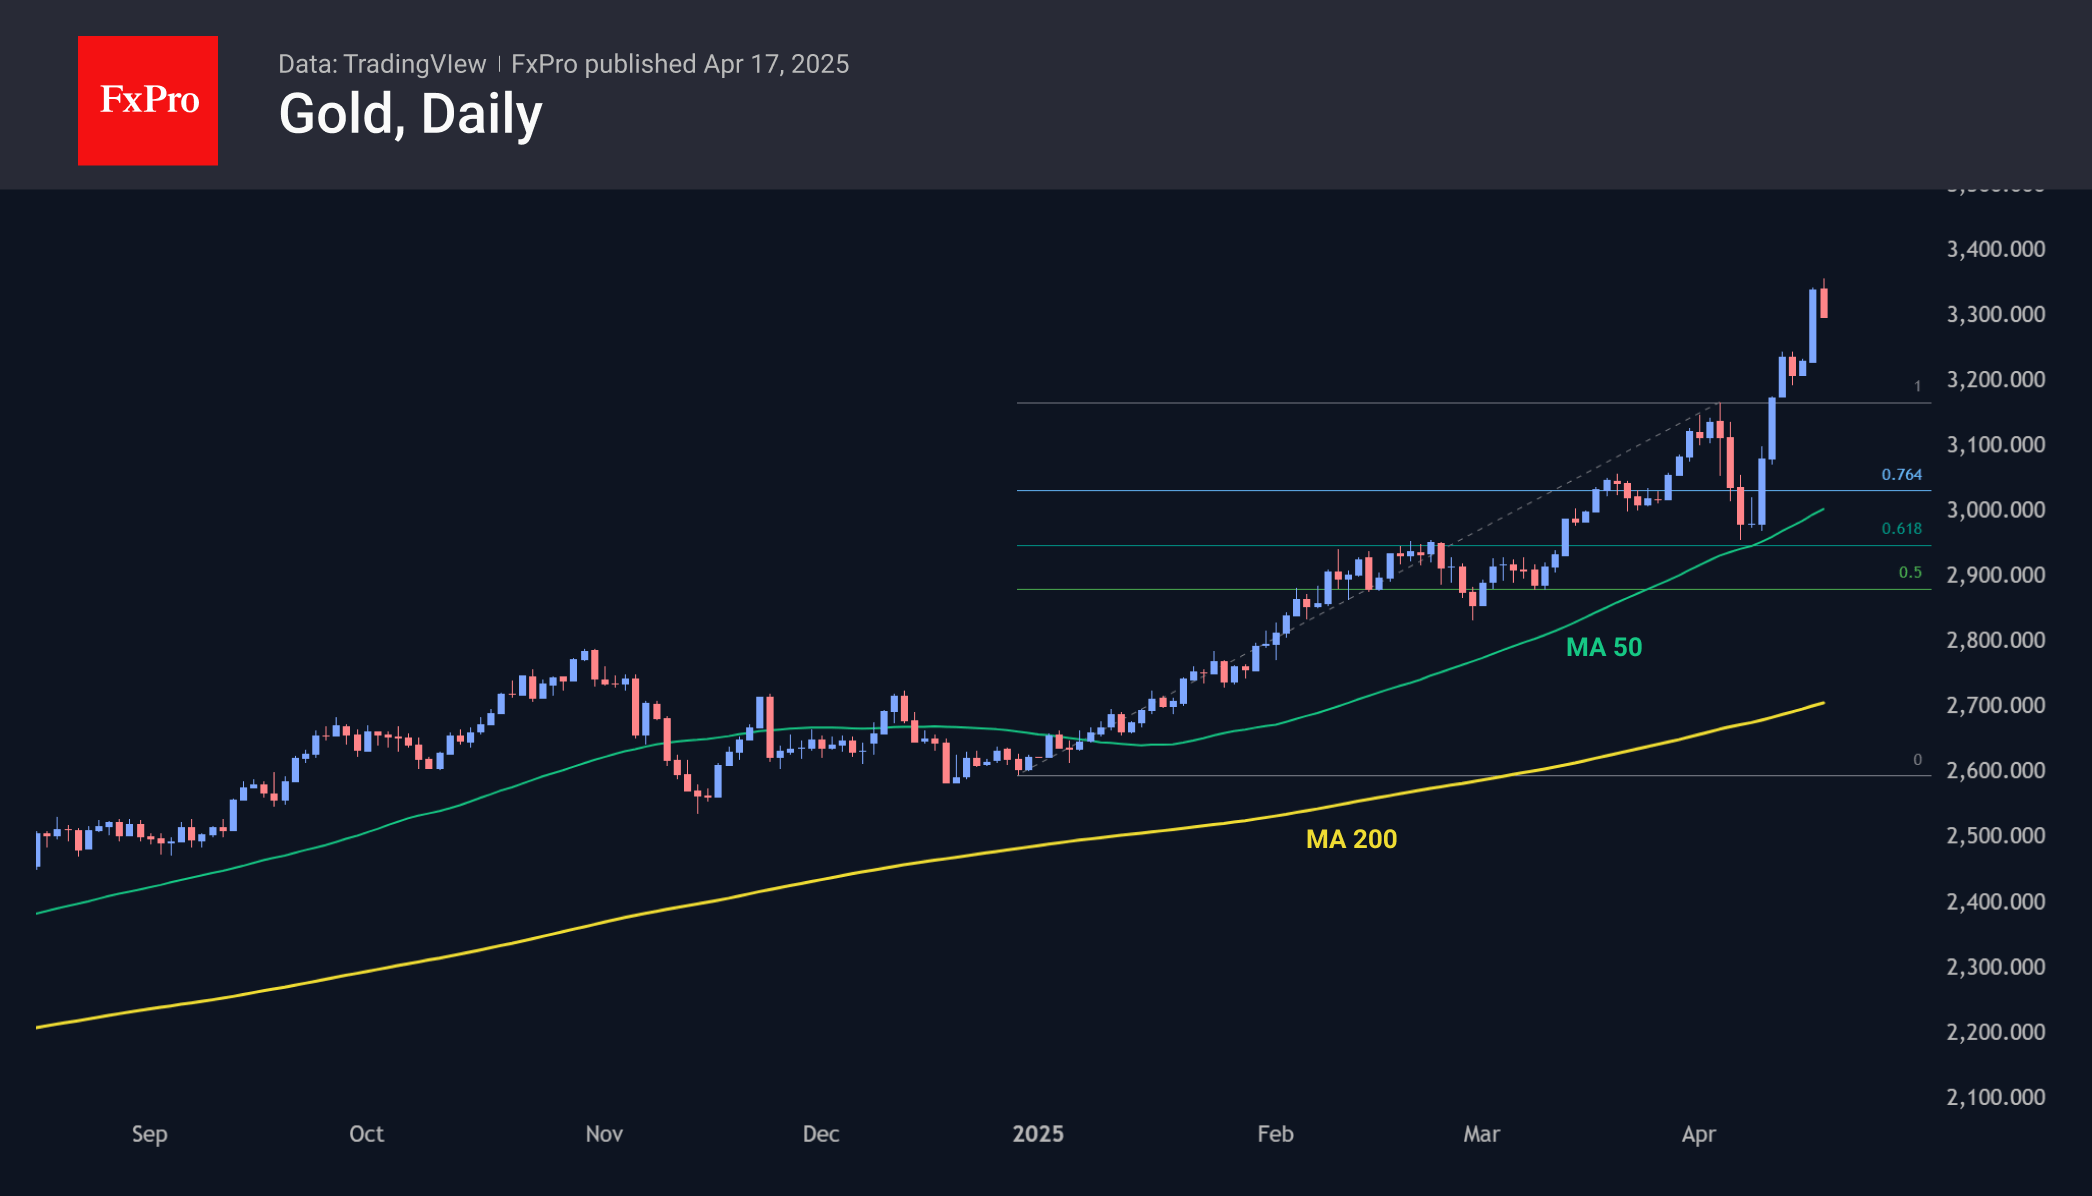
Gold: Epic Rally
Gold delved deeper into the territory of all-time highs during the week, reaching a local top above $3350 per troy ounce on the spot market, representing a more than 4% gain from the start of the week. The price later retreated to the $3300 area.
Gold has been on the offensive since touching the 50-day moving average early last week. We view the latest rally as the completion of the correction from the late December spike. The upside potential, in our opinion, allows us to expect quotes above $3500.
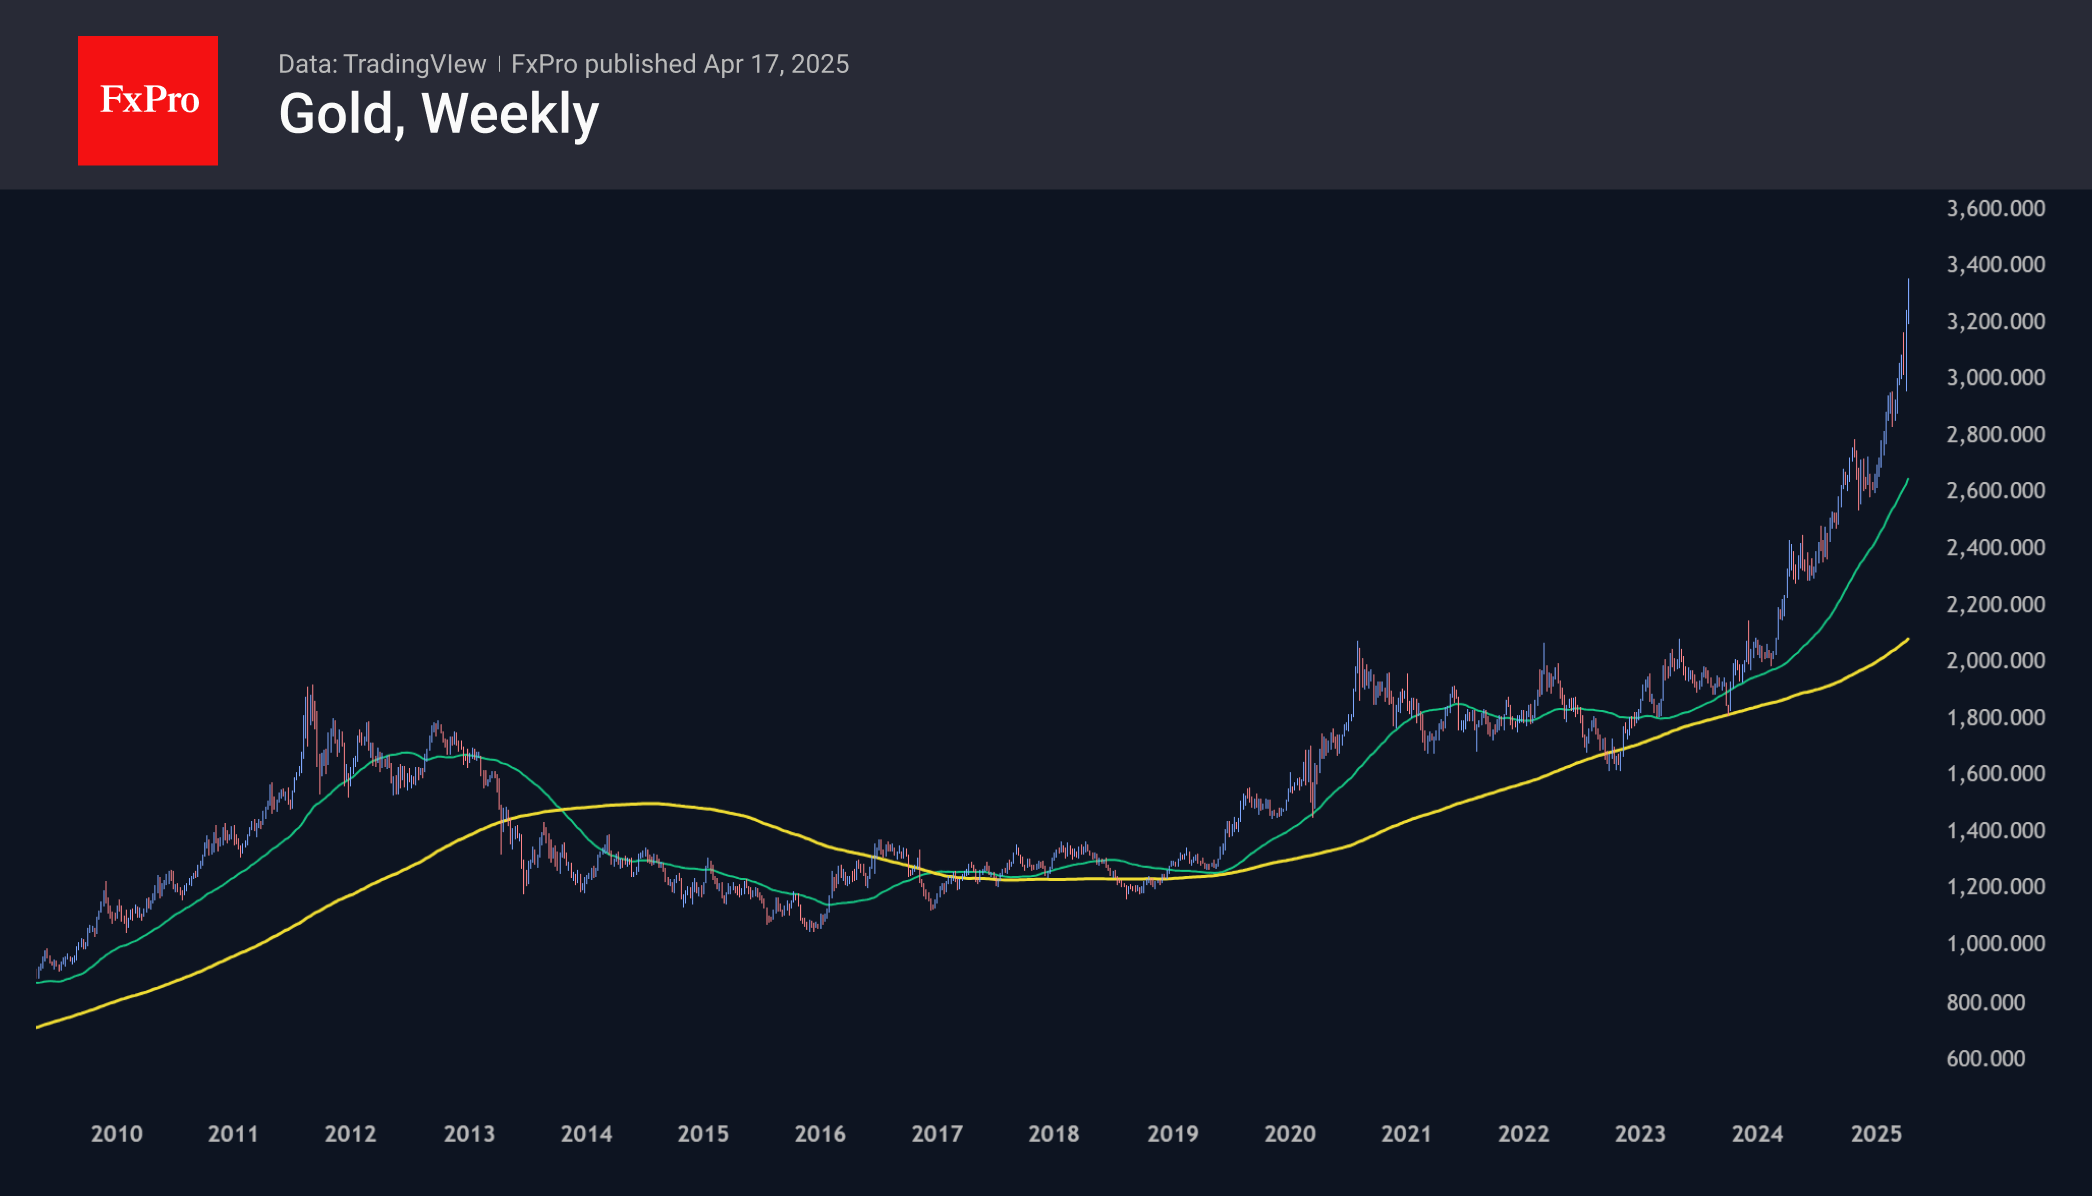
The price is currently above its 200-week moving average by 60%. By comparison, in 2020, with a gap of just over 50%, the price stalled, then corrected, and went sideways for two years. The last time a higher gap-up was recorded was in 2011 at around 70%, which was accompanied by a prolonged bear market. In the current situation, the 70% breakaway can be achieved when the $3540 level is reached.
EURCAD Wave Analysis
EURCAD: ⬇️ Sell
- EURCAD reversed from long-term resistance level 1.5840
- Likely to fall to support level 1.5400
EURCAD currency pair recently reversed down from the long-term resistance level 1.5840 (which has been reversing the price from the start of 2020) standing close to the upper daily Bollinger Band and the resistance trendline of the weekly up channel from 2022.
This is the 3rd consecutive failure to break above the major resistance level 1.5840 by this currency pair from the start of this year.
Given the strength of the resistance level 1.5840, overbought weekly Stochastic and the bullish Canadian dollar sentiment seen today, EURCAD currency pair can be expected to fall to the next support level 1.5400.

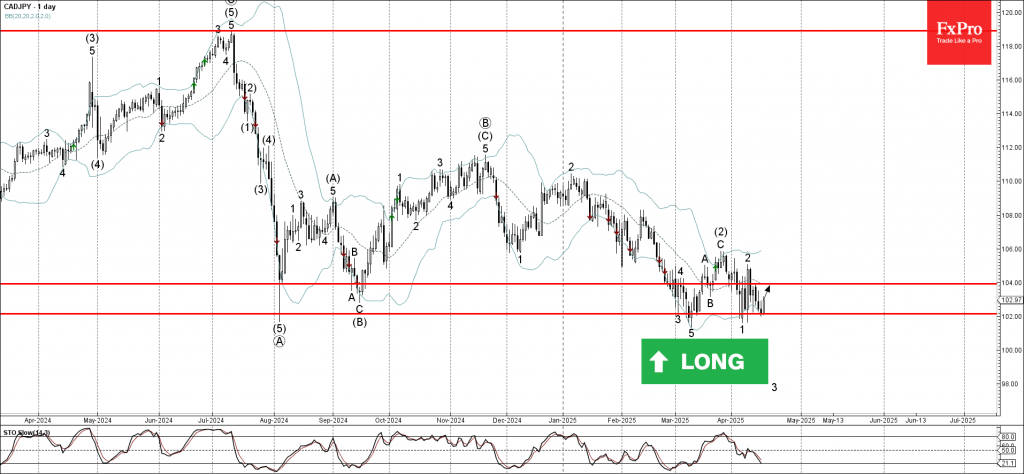
CADJPY Wave Analysis
CADJPY: ⬆️ Buy
- CADJPY reversed from key support level 102.00
- Likely to rise to the resistance level 104.00
CADJPY currency pair recently reversed up from the key support level 102.00 (which has been reversing the price since August of 2024) standing close to the lower daily Bollinger Band.
The upward reversal from this support level is likely to form the weekly daily candlesticks reversal pattern Morning Star – a strong buy signal for CADJPY.
Given the strength of the support level 102.00, the CADJPY currency pair can be expected to rise to the next resistance level 104.00.