Sample Category Title
European Central Bank Still Moving Steadily Along Rate Cut Path
Summary
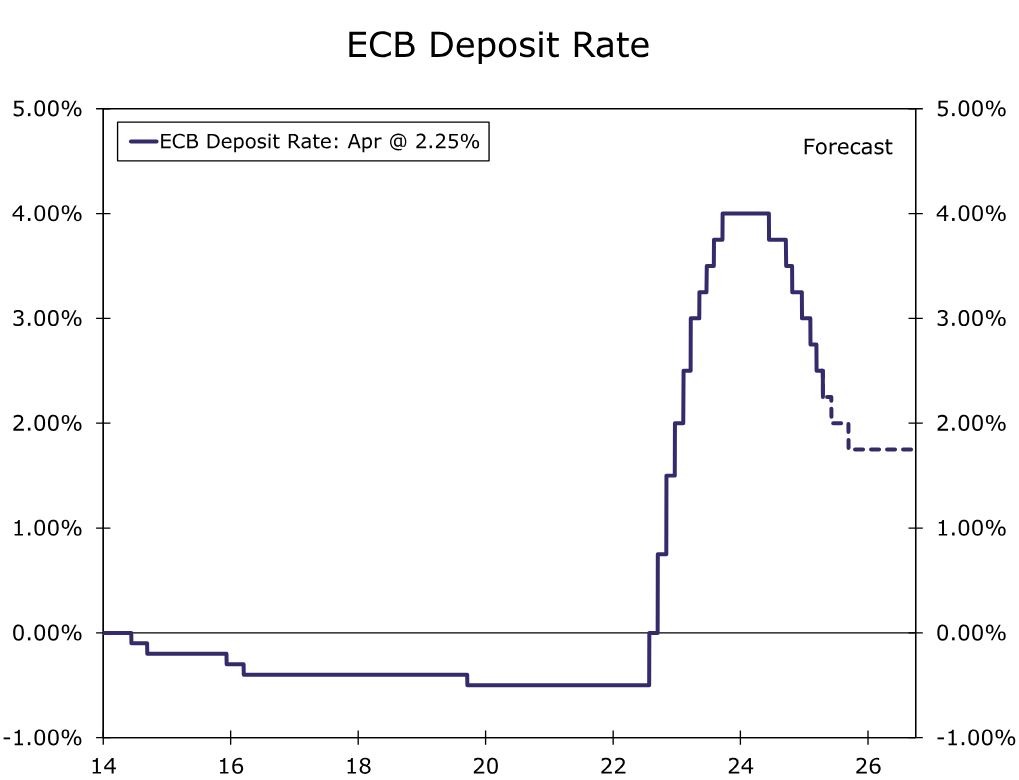
- The European Central Bank (ECB), in a widely expected decision, lowered its Deposit Rate by 25 bps to 2.25% at today's announcement, while its accompanying statement was dovish overall in tone.
- In one significant change, the ECB no longer described its policy stance as restrictive. At the same time, however, it refrained from explicitly describing its policy stance as neutral, and moreover said the neutral rate concept only works in a "shock-free" world. Overall, we view these comments as providing scope for further easing.
- Among the more dovish elements of the announcement, the ECB said the growth outlook had deteriorated, and noted slowing in headline and underlying inflation measures in March.
- Given the dovish overall tone, we remain comfortable with our view for the next 25 bps rate cut coming in June, and a final 25 bps rate cut in September, for a policy rate low of 1.75%. That said, we see the risks around this outlook as tilted toward faster and more pronounced easing. A rate cut at each and every meeting through September, for a policy rate low of 1.50%, is certainly a plausible scenario.
European Central Bank Cuts Rates, Maintains Dovish Outlook
The European Central Bank (ECB) cut its Deposit Rate by 25 bps to 2.25% at today's monetary policy announcement in a widely expected decision, bringing the cumulative easing during the current cycle to 175 bps. Meanwhile, the accompanying announcement and post-meeting press conference leaned dovish on balance, keeping the path open for further rate cuts at upcoming meetings.
In one significant change, the ECB no longer described its monetary policy stance as “restrictive,” an adjustment that in isolation would be on the less-dovish end of the spectrum. In the same breath, however, the central bank did not explicitly describe the policy stance as “neutral,” and in the post-meeting press conference, ECB President Lagarde said the neutral rate concept only works in a "shock-free" world. We believe the central bank's approach to characterizing its policy stance provides leeway for further rate cuts.
Among the more dovish elements of the announcement, the ECB downgraded its growth assessment, with ECB President Lagarde saying downside risks to growth had increased. More broadly in its assessment of the economy, the ECB's announcement said:
“The euro area economy has been building up some resilience against global shocks, but the outlook for growth has deteriorated owing to rising trade tensions. Increased uncertainty is likely to reduce confidence among households and firms, and the adverse and volatile market response to the trade tensions is likely to have a tightening impact on financing conditions. These factors may further weigh on the economic outlook for the euro area.”
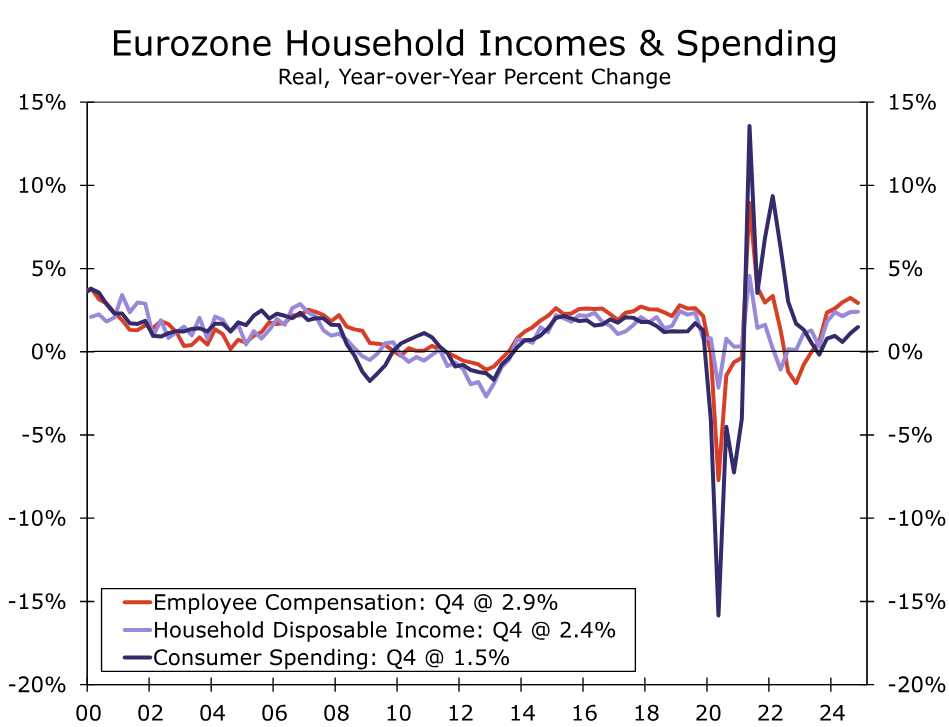
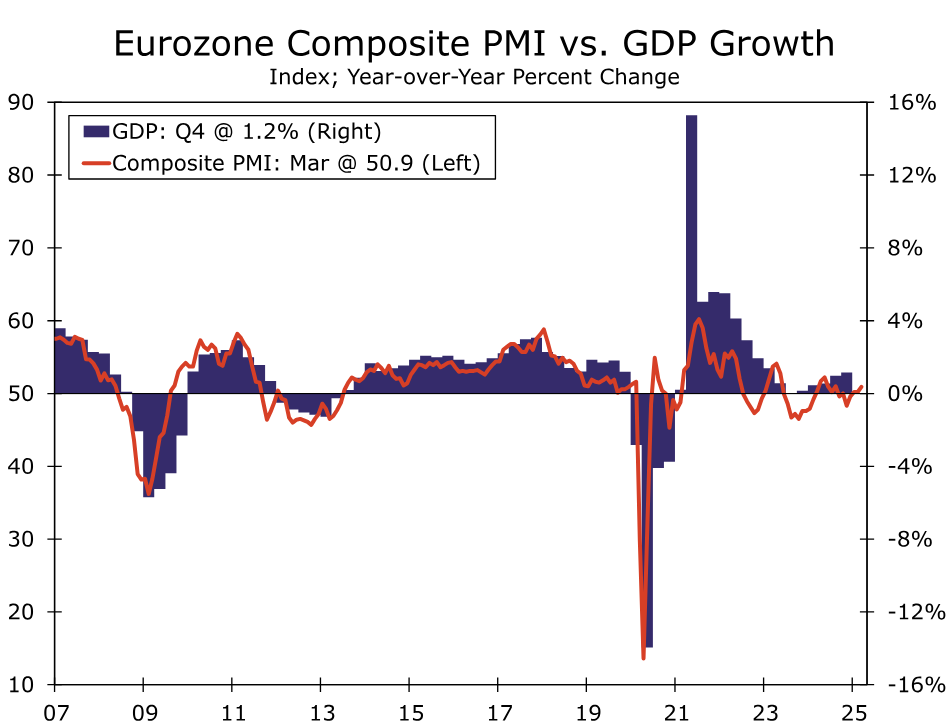
In terms of resilience, growth in real household disposable incomes continues to outpace consumer spending, while the housing saving rate remains elevated at 15.3%. However, today's announcement suggests the central bank is placing limited weight on those factors and focusing instead on cyclical trends. On that front, sentiment surveys remain subdued. The Eurozone manufacturing and service sector PMIs were barely in growth territory in March, and the consensus forecast is for some further softening in April. That is consistent with our own outlook, as we recently revised our Eurozone GDP growth outlook lower to 0.6% for 2025 and 1.3% for 2026. The underwhelming Eurozone growth outlook and continued downside risks firmly argue for further easing.
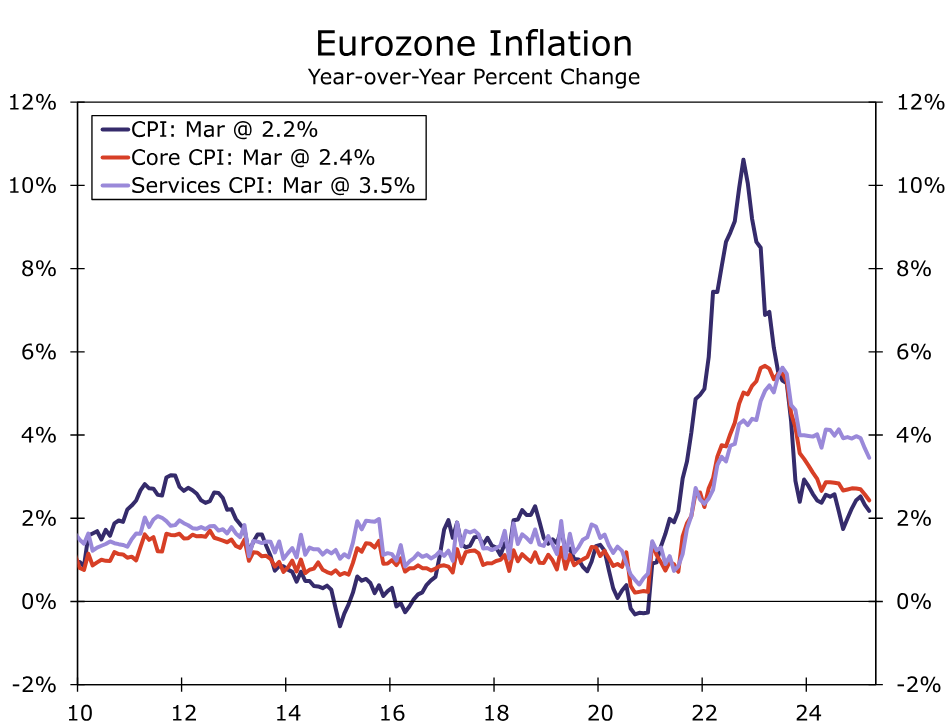
Meanwhile, the ECB's view on inflation was relatively sanguine. The central bank noted a slowing in headline and core inflation in March, and said services inflation has eased markedly over recent months. The ECB said wage growth is moderating, and Lagarde once again said that the ECB's Wage Tracker pointed to slower wage growth ahead. To be sure, higher tariffs imposed by European governments could add to prices, although Lagarde said the impact on inflation was not clear yet.
Looking forward, the ECB was careful to offer limited guidance, saying "especially in current conditions of exceptional uncertainty, it will follow a data-dependent and meeting-by-meeting approach to determining the appropriate monetary policy stance." However, in the context of overall dovish comments we remain comfortable with our view of the next 25 bps ECB policy rate cut, to 2.00%, occurring at the June meeting. Beyond that we currently expect a pause in July and a final 25 bps rate cut to 1.75% in September. We acknowledge, however, that growth and inflation trends also mean the risks to our ECB rate outlook are tilted to the downside. Should Eurozone growth begin to show a much weaker trend and inflation remain benign, one can certainly envisage rate reductions at each and every meeting through September, for a policy rate low of 1.50%.
Week Ahead – Eyes on Flash PMIs as Tariff Uncertainty Persists
- Tariff headlines remain at the top of investors’ agendas.
- But flash S&P Global PMIs could attract special attention.
- Auctions to reveal information about demand for Treasuries.
- Tokyo CPI data and Canada’s retail sales also on tap.
Trump’s back and forth tariff game
Since the beginning of the month, the spotlight has been locked on headlines surrounding Trump’s tariff policies and the response of the US trading partners, with economic data taking second place.
After announcing reciprocal tariffs, the US President decided to declare a 90-day pause and keep only a 10% baseline tariff. But China received different treatment. The tit-for-tat tariff game between the world’s two largest economies led to a 145% levy on Chinese imports to the US and China retaliated with a 125% duty on US imports.
Last Friday, the White House granted exclusions for certain electronics imported from China, though Trump said that the exemption will be short-lived. A few days later, he said that he is considering tariffs on semiconductors and pharmaceuticals.
The back-and-forth strategy of the US President has left investors scratching their heads about his next steps, with many remaining fearful about a recession later this year. This is evident by the fact that despite the three-month delay and the tech-related exclusions, the stock market has turned south again this week, while the dollar extended its tumble, raising questions about its sustainability as the world’s reserve currency. Although they stabilized during the last few days, US Treasuries were also abandoned massively last week, with gold and the Swiss franc acting as the ultimate safe havens.
Recession fears remain elevated
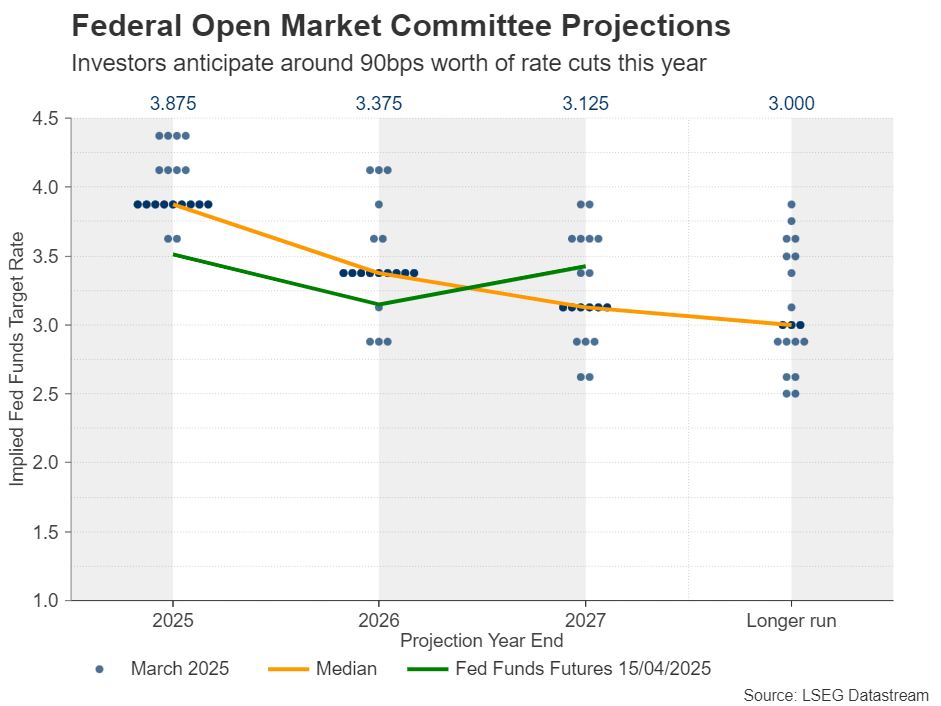
As for the Fed, Boston Fed President Susan Collins said on Friday that the Committee stands ready to stabilize the market if needed, while investors are pencilling in around 90bps worth of rate cuts this year.
Having said all that, although investors remain extremely nervous about a potential recession, such a scenario has not been fully priced in yet. Even JPMorgan, which is considered one of the most pessimistic commercial banks, is assigning a 60% probability of a recession. Goldman Sachs sees a 45% recession chance.
Therefore, with the agenda appearing very light in terms of economic releases and data next week, investors will keep their gaze locked on news surrounding tariffs and there may be more to digest should the trade landscape worsen. Not only could US-Sino tensions intensify, but Trump could withdraw the three-month delay adding pressure on US allies to deal with a new reality.
Flash PMI data in the spotlight
In terms of data, the highlight may be the preliminary S&P Global PMIs for the month of April from the Eurozone, the UK and the US.
In the Eurozone, business activity grew at its fastest pace in seven months in March and could gain more traction in the coming months due to optimism that massive spending for infrastructure and defence in Germany, Euro area’s powerhouse, could turn Europe’s economic fortunes around.
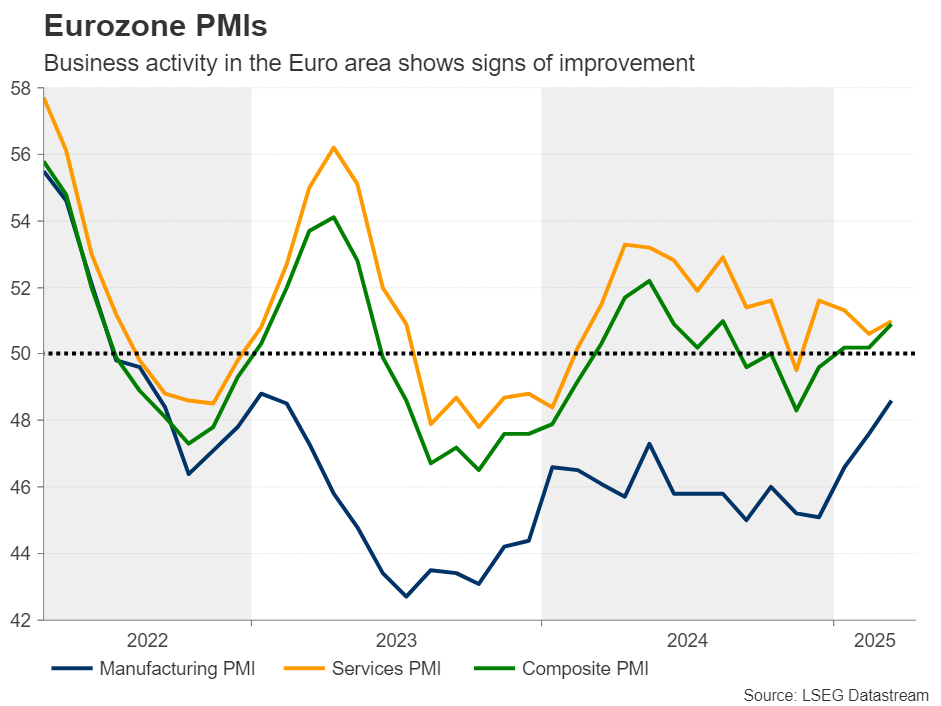
Having said that though, April was also faced with increasing uncertainty and volatility due to the changing tariff dynamics. This poses some downside risks as businesses may have turned a bit more cautious this month.
Ergo, weaker-than-expected numbers could result in a pullback in the euro, but whether this will signal the end of the prevailing rally remains doubtful. Investors are already pencilling in 85bps worth of rate cuts by the ECB this year, which makes it very difficult for the ECB to turn even more dovish. What’s more, the Eurozone holds a decent percentage of foreign owned US assets and, thus, when investors around the globe are dumping US assets, some of them are converted back to euros.
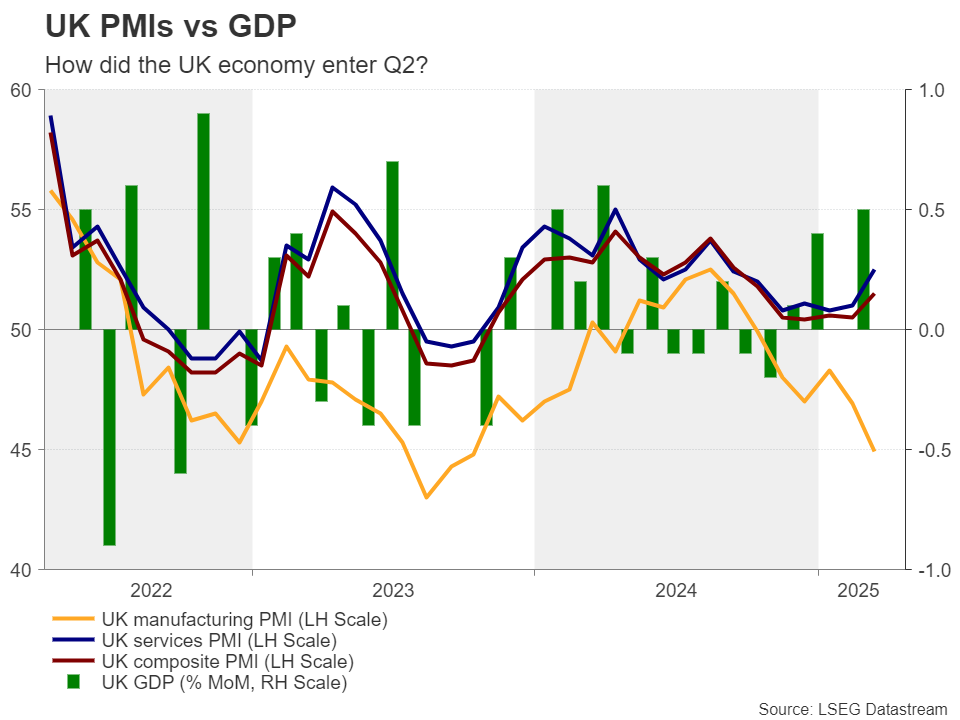
In the UK, following the slowdown in the CPI numbers for March, investors are assigning a strong 85% probability of a 25bps reduction at the May BoE decision, while by the end of the year, they are pencilling in 85bps worth of cuts. A set of improving PMIs is unlikely to alter expectations of a rate cut at the upcoming gathering, but it could prompt investors to scale back their bets for the remainder of the year. The UK retail sales report is scheduled to be released on Friday.
The US PMIs may also attract special attention as, with the Atlanta Fed GDPNow model pointing to a 2.4% contraction for the first quarter of 2025, market participants will be eager to find out how business activity entered the second quarter. Next week, the agenda includes several Treasury auctions. Following last week’s massive selloff, it will be interesting to see whether demand remained subdued or showed some sort of improvement.
Tokyo CPI data, Canada’s retail sales, Earnings results
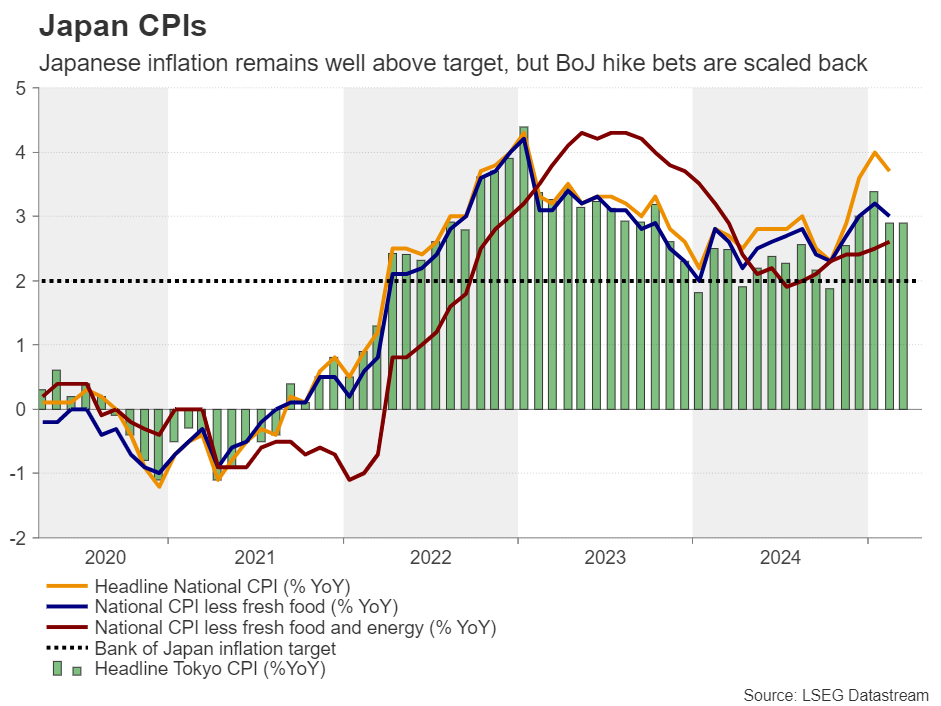
Elsewhere, from Japan, the Tokyo CPI numbers for April are due to be released during the Asian session on Friday, while later in the day, Canadian retail sales for March will be released.
Bets that the BoJ will proceed with at least another 25bps rate hike this year have been scaled back due to the tariff-related market turbulence, with traders now pencilling only 10bps worth or rate increases by December. Even if the CPI data reveals some acceleration, it is very doubtful that the market will return to its pre-tariff state, when there was an 80% chance of a quarter-point hike in June. Yet, the yen seems to be enjoying some safe-haven inflows, with dollar/yen dropping to its lowest level since September.
As for Canada, the Bank of Canada kept interest rates unchanged this week, with the forward guidance leaning towards the hawkish side. The statement emphasized that “Monetary policy cannot resolve trade uncertainty or offset the impacts of a trade war. What it can and must do is maintain price stability for Canadians.” Investors are now expecting less than two quarter-point cuts by the end of the year, and a decent set of retail sales could prompt them to further scale back those bets. This could help the loonie drift higher.
On the earnings front, Tesla and Google’s parent Alphabet are scheduled to report their results on Tuesday and Thursday, respectively.
ECB Review – Dovish Bias in Troubled Waters
- As expected, the ECB cut policy rates by 25bp today, bringing the deposit rate to 2.25%.
- The guidance struck a dovish tone, noting downside risks to growth and downplaying topside risks to inflation. Markets reacted by sending EUR/USD and European yields lower.
- We continue to expect the ECB to deliver 25bp cuts at the upcoming meetings, bringing the deposit rate to 1.50% by September 2025.
As widely expected, the ECB cut all policy rates by 25bp today, bringing the deposit rate to 2.25%. There were no new staff projections at this meeting, and given the 'Liberation Day' disruption of global trade, the previous version from March is naturally outdated, which was evident from today's rather vague assessment of the outlook.
In line with our expectations, the ECB struck a dovish tone, noting the downside risks to growth and downplaying topside risks to inflation. This was further highlighted by Lagarde during the press conference saying that "we are facing a negative demand shock" from Trump's trade war, and hence that consensus within the Governing Council sess tariffs as dampening for the medium-term inflation outlook. The ECB removed its characterisation of the monetary policy stance "becoming meaningfully less restrictive", with Lagarde referring to the previous wording as being meaningless given the current uncertainty on the neutral rate and the persistence of recent drivers of financial conditions (real rates, FX, credit premia). Incoming data will guide the ECB in its assessment on how to navigate the current environment on a meeting-by-meeting approach; but based on the communication from Lagarde today, we find that the easing bias remains in place.
Lagarde alluded to discussions of delivering a 50bp cut today, although she was vocal that no members were in favour of this option at today's meeting. However, given the dovish assessment of the current balance of risk for growth/inflation, we do not rule out the risk that a couple of dire PMIs in April/May could build a case for a more pronounced easing of the policy stance at one of the next meetings.
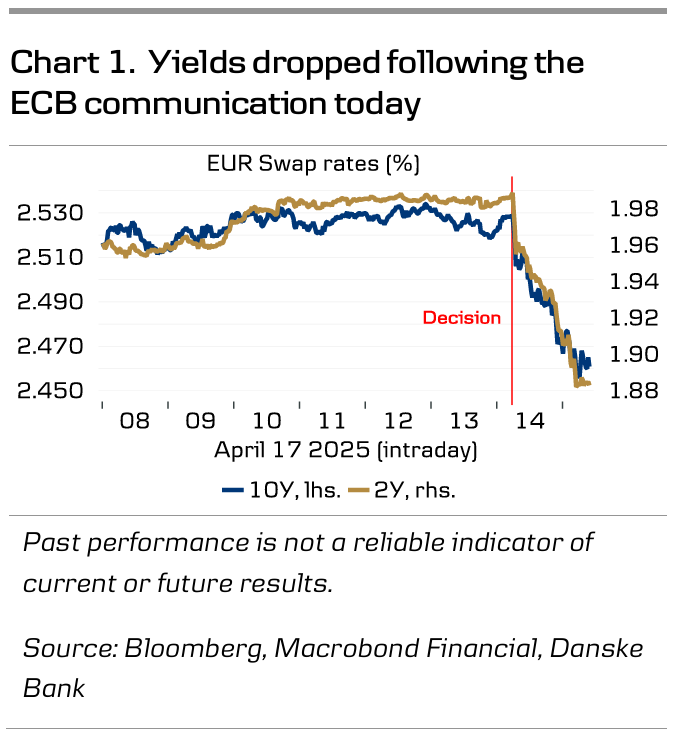
Market reaction. Markets reacted by sending European yields lower on the statement, with a further decline during the press conference. The 2Y swap rate dropped 10bp to below 1.90%, with the 10Y swap rate breaking below 2.50%. EUR/USD initially moved lower on the statement, but weak US data from the Philly Fed provided some support for the cross during the afternoon.
Our ECB call. We continue to expect the ECB to deliver 25bp cuts at the upcoming meetings, bringing the deposit rate to 1.50% by September 2025. Following trade war escalations, markets have recently converged with our view. We see risks to growth, inflation and rates, all to the downside in the medium term. Markets are pricing 22bp for June and 66bp for the remainder of the year.
Sunset Market Commentary
Markets
The ECB cut the main policy rate by 25 bps to 2.25% and indicated the current stance is no longer weighing down on the economy. The decision was unanimous with no one tabling a bigger cut but no one pushing for a skip either (something which Lagarde said some governors would have done so until a few weeks ago). The statement removed the March reference that “monetary policy was meaningfully less restrictive” (so still slightly restrictive) and no longer saw monetary headwinds coming from the past interest rate hikes. The ECB said the disinflation process is well on track and inflation has continued to develop as expected. Most measures of underlying inflation suggest that inflation will settle at around the 2% target. The economy has been building up some resilience but rising trade tensions have deteriorated an “exceptionally uncertain” outlook and are likely to reduce confidence among households and firms. Downside risks to economic growth have increased, Lagarde said, a headline that grabbed market attention and triggered a kneejerk extension to an intraday drop in European/German yields. Risks (plural, indeed) for inflation are more double sided. She mentioned the possible rerouting of exports to the EU from countries with overcapacity and the strong euro vs fragmentation of supply chains and the impact of massive infrastructure and defence spending. Regarding future steps, Lagarde would no longer confirm that the direction of travel was clear though. She stuck with the mantra of going meeting by meeting and be data dependent. But neither would the ECB chair formally label the policy stance as a neutral one. The concept of a neutral rate is only useful in a world free of shocks. Instead, the destination of the ECB and the policy rate will be determined by readiness (for potential shocks) and agility without rushing to a particular stance.
ECB’s Lagarde mentioned the long list of risks multiple times up until the point she wouldn’t want to repeat them all over once again. She also flagged the immense uncertainty and unpredictability that muddy the view whether and which of these risks will eventually materialize. This in our opinion is a strong argument for the central bank to adopt a more cautious and waiting stance, especially after already having delivered a cumulative 175 bps of monetary easing. Euro area money markets beg to differ in a copycat move with those in the US post-Powell yesterday. They basically added to their easing bets with another one for June priced in for 85% with a terminal rate now even below 1.5%. Such a growth supporting rate in our view is unnecessary and in any case very premature to assume. Euro area yields drop up to 7 bps with the short end of the curve outperforming. The 2-y swap yield risks losing the lower bound of the downward trend channel. The euro is holding steady though, not adding to the minor early morning losses. EUR/USD trades around 1.136. Other markets including European equities trade with losses of around 0.6% in technically insignificant trading. Wall Street is going mixed into the long weekend (Good Friday tomorrow).
News & Views
The Turkish central bank (CBRT) unexpectedly raised its key one-week repo rate from 42.5% to 46% today. However, since the Turkish market rout triggered by the jailing of president Erdogan’s most important and popular rival, Ekrem Imamoglu, the CBRT in an emergency meeting suspended the repo window as a funding source. It since then instead offered funding through the overnight lending window, which back then was hiked to 46% and once again today to 49%. Therefore, only if the one-week repo facility remains shut, today’s decision implies a 300 bps monetary tightening move. The move nevertheless signals a readiness by the central bank to act if necessary and vows to keep the tight monetary stance until price stability is achieved via a sustained decline in inflation to the 5% target in the medium term. The Turkish lira strengthens against the dollar and slightly against the euro. In a broader perspective, though, both USD/TRY (38.07) and EUR/TRY (43.48) trade at historically high (TRY weak) levels.
Fed’s Williams: No urgency for rate change, expects sub-1% growth without recession
In an interview with Fox Business New York Fed President John Williams said monetary policy is "well positioned". "I don't see any need to change the setting of the fed funds rate anytime soon," he added.
He expected US growth to dip below 1% this year, accompanied by a rise in the unemployment rate to between 4.5% and 5%, as the impact of President Trump’s import tax hikes filters through the economy.
Williams emphasized that this slower pace of expansion should not be mistaken for a recession. "That's just a slower outlook, slower growth than you've seen in the past couple years," he noted.
He stressed the importance of ensuring that these one-off cost increases from tariffs do not become embedded in broader inflation trends.
Dollar at the Bottom: Tariffs Ruin ‘Exorbitant Privilege’
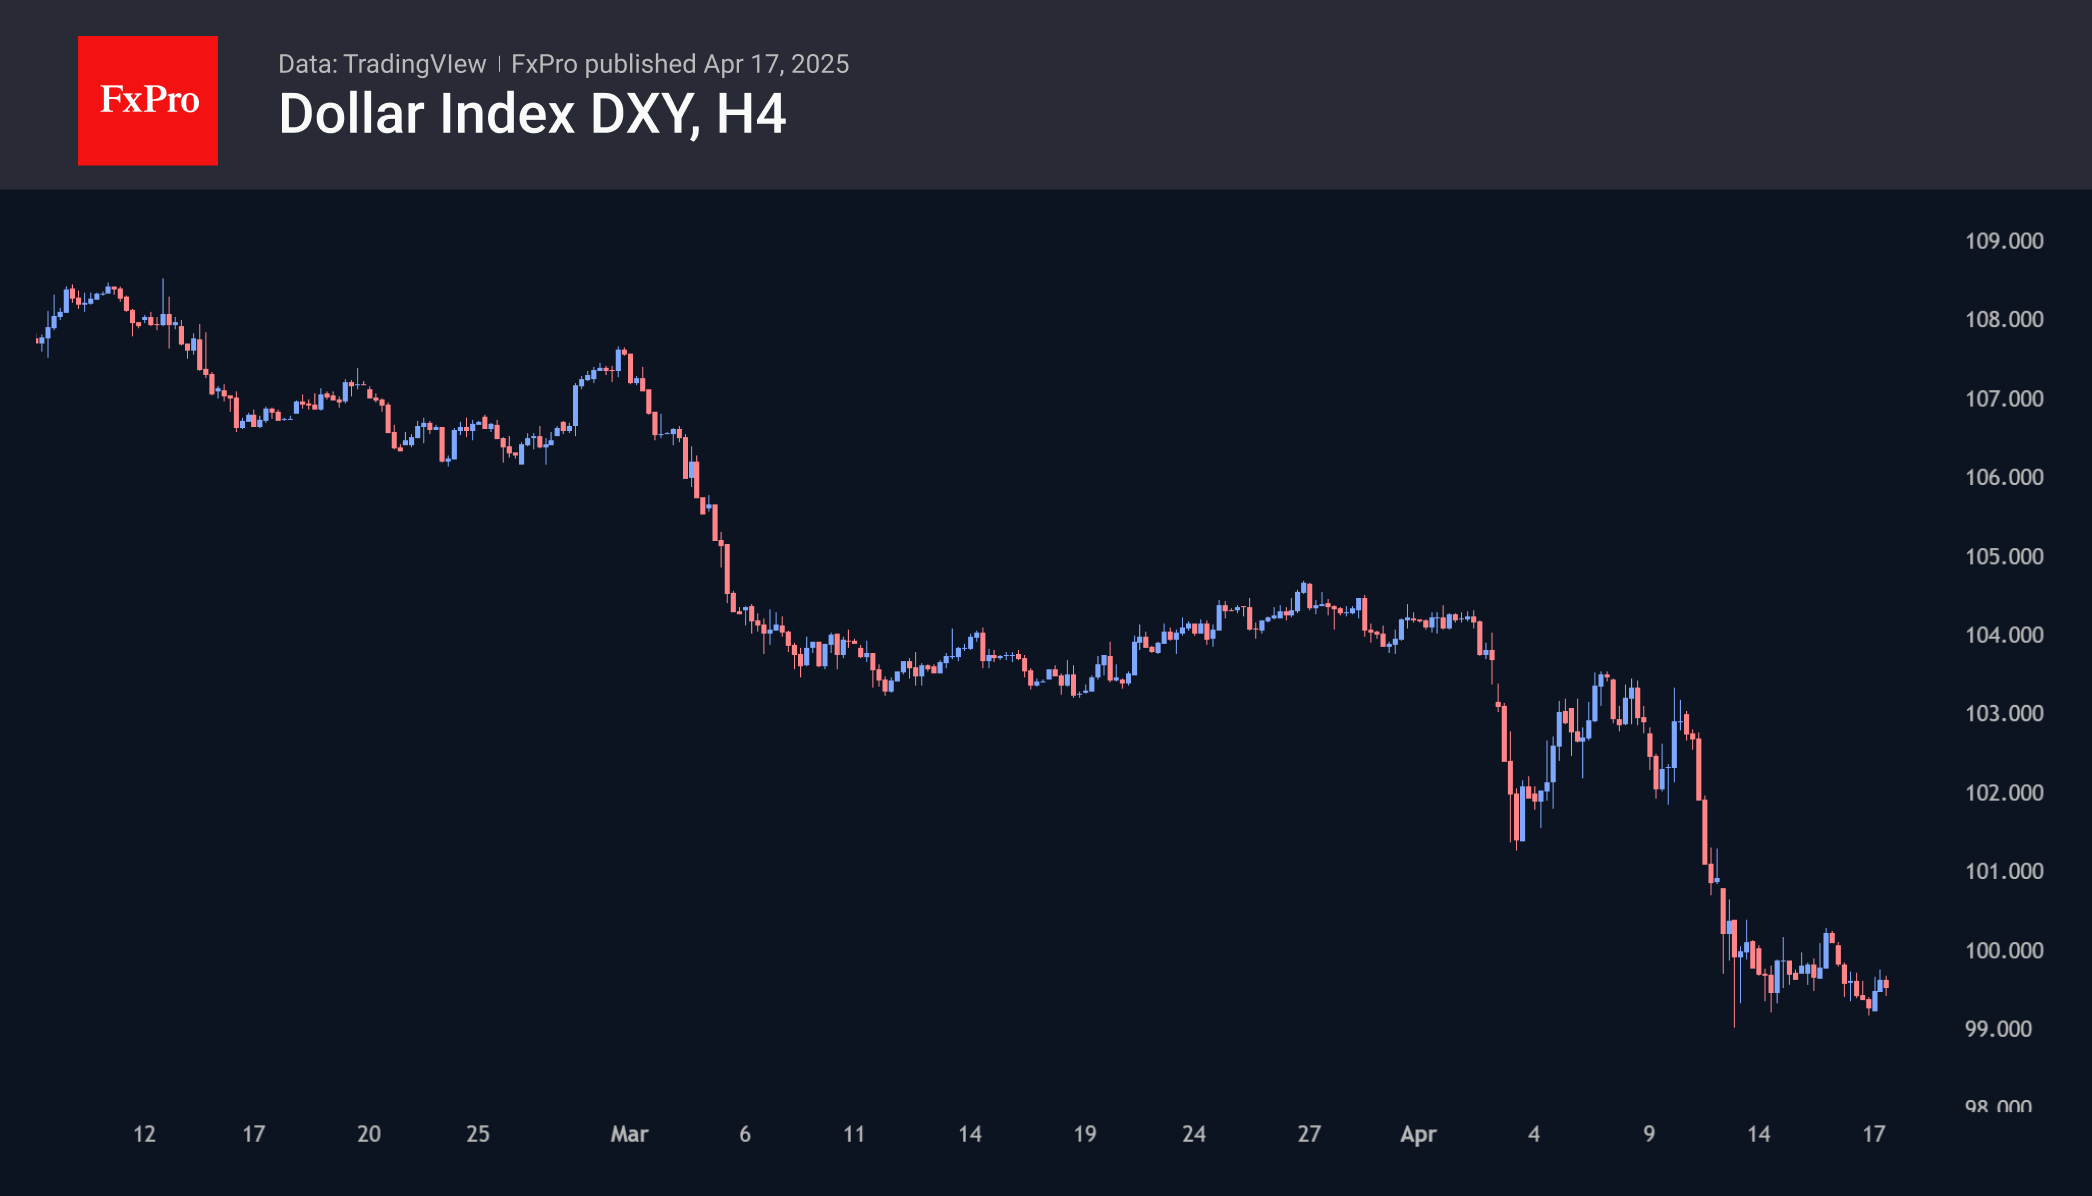
This week turned out to be relatively quiet for the dollar. The dip at the end of last week was replaced by hovering near the bottom, i.e. around the 99 level on DXY, which corresponds to the lows of the last three years and slightly below the reversal area of the last two years. This situation suggests that we are only seeing a pause before further downside, not a reversal.
Since the beginning of April, an inverse correlation between the dollar dynamics and the value of promised tariffs has been evident. Rising trade barriers lead to a sharp sell-off in the US currency. Particularly disturbing is that both US stocks and bonds fall during these periods—a phenomenon common in emerging markets but rare in developed markets and almost never in America. This is an unambiguous signal from traders that trade wars are sharply curtailing the ‘exorbitant privilege’ the US has enjoyed for the past half-century.
Nevertheless, the Fed appeared to stand up for the dollar on Wednesday. Powell warned in his latest speech that the current situation justifies keeping rates high and even hinted at the possibility of a rate hike. These comments have helped the dollar index stabilise, but there are no clear signs of a rebound yet.
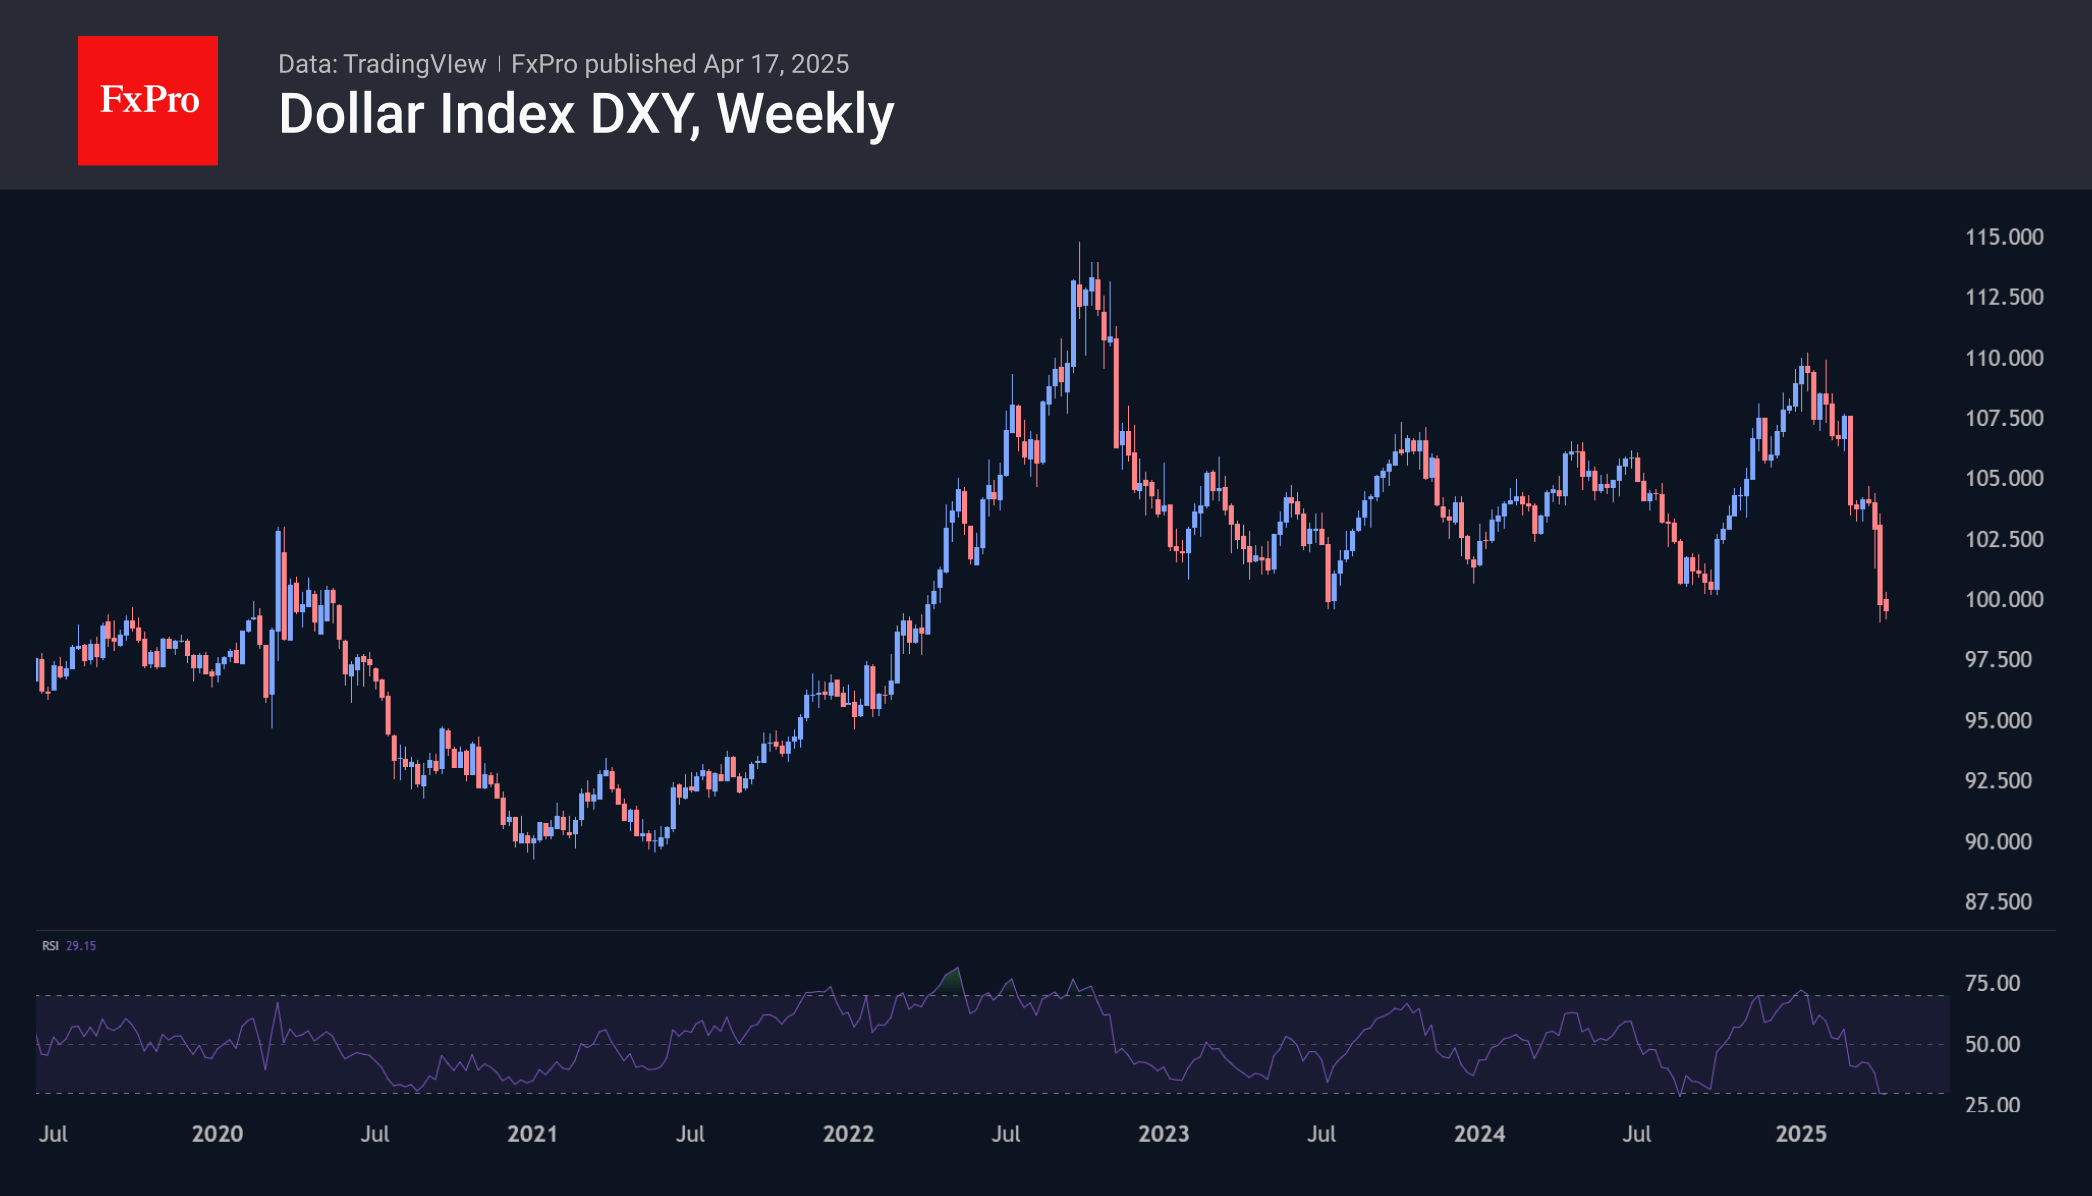
On the weekly charts, the RSI has reached oversold levels, which were last seen in August of last year and previously in early 2018. However, it took more than a month in the former case and about four months in the latter before a rebound occurred.
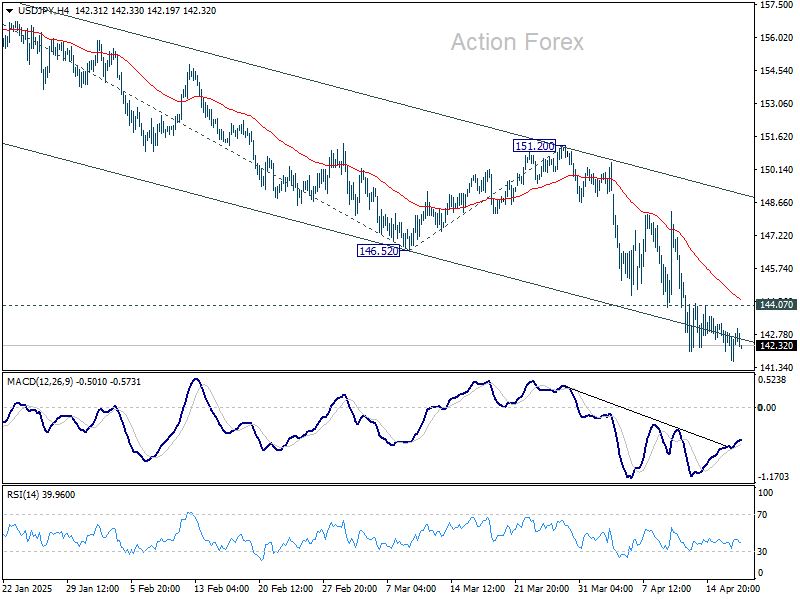
USD/JPY Mid-Day Outlook
Daily Pivots: (S1) 141.25; (P) 142.30; (R1) 142.95; More...
Intraday bias in USD/JPY remains mildly on the downside for the moment. Current fall from 158.86 should extend to 139.57 support. On the upside, above 144.07 minor resistance will turn intraday bias neutral again. But overall outlook will stay bearish as long as 151.20 resistance holds.
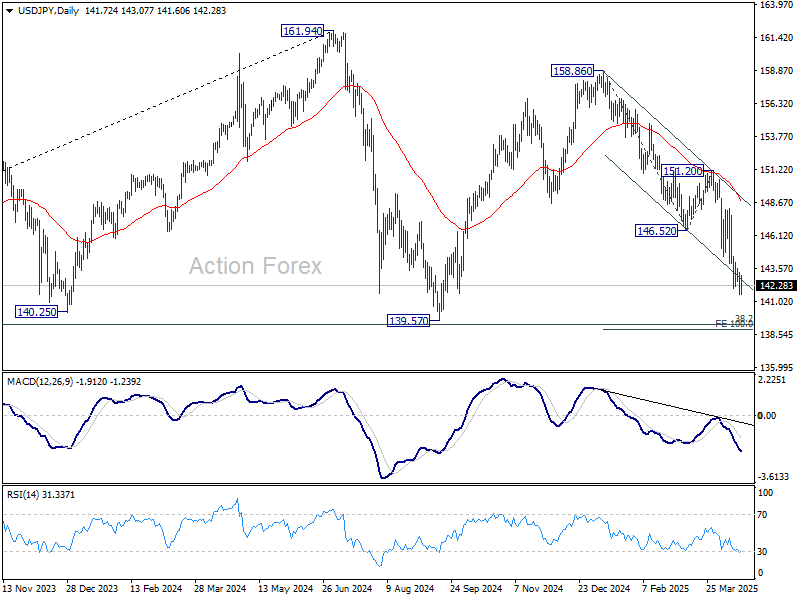
In the bigger picture, price actions from 161.94 are seen as a corrective pattern to rise from 102.58 (2021 low), with fall from 158.86 as the third leg. Strong support should be seen from 38.2% retracement of 102.58 to 161.94 at 139.26 to bring rebound. However, sustained break of 139.26 would open up deeper medium term decline to 61.8% retracement at 125.25.
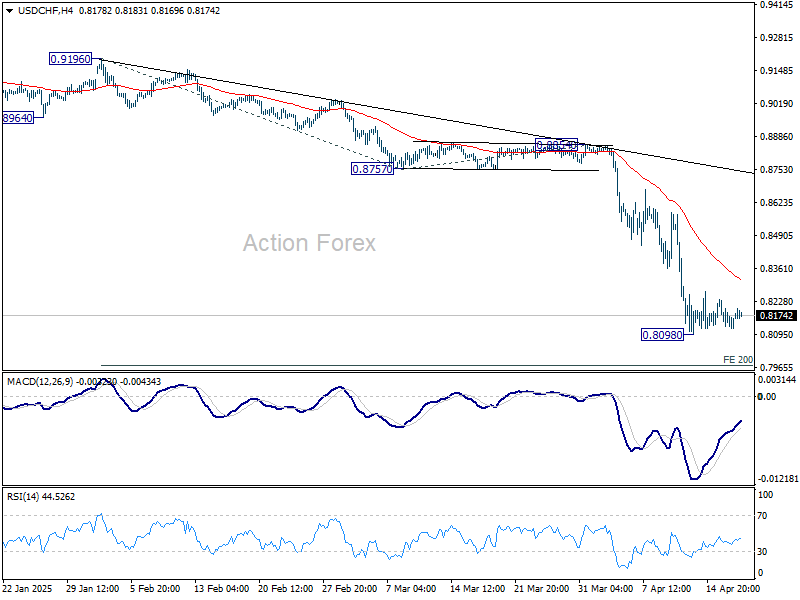
USD/CHF Mid-Day Outlook
Daily Pivots: (S1) 0.8092; (P) 0.8163; (R1) 0.8206; More…
Intraday bias in USD/CHF stays neutral for consolidations above 0.8098. While stronger recovery might be seen, upside should be limited by 55 4H EMA (now at 0.8313) to bring another fall. On the downside, break of 0.8098 will resume recent down trend to 200% projection of 0.9196 to 0.8757 from 0.8854 at 0.7976 next. Nevertheless, sustained break of 55 4H EMA will confirm short term bottoming, and turn bias back to the upside for stronger rebound.
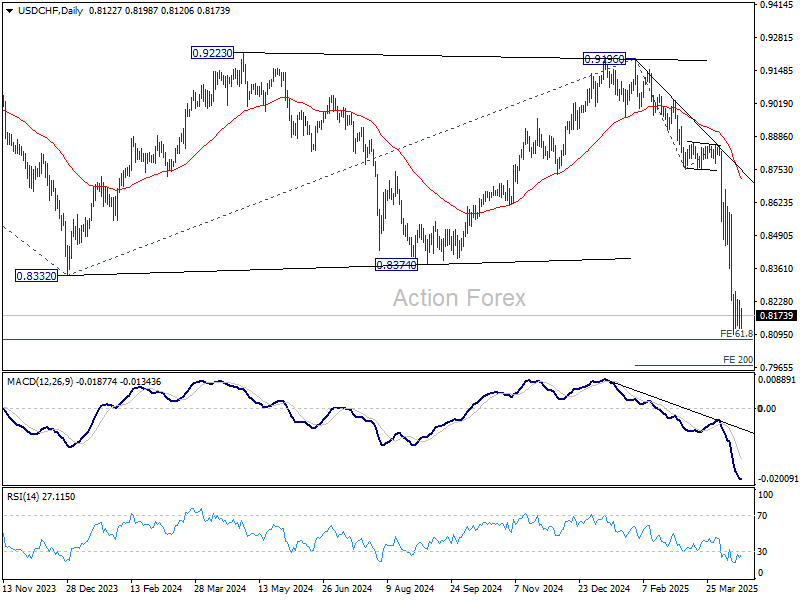
In the bigger picture, the break of 0.8332 (2023 low) confirms resumption of long term down trend from 1.0342 (2017 high). Next target is 61.8% projection of 1.0146 (2022 high) to 0.8332 from 0.9196 at 0.8075. Firm break there will target 100% projection at 0.7382. In any case, outlook will now stay bearish as long as 55 W EMA (now at 0.8821) holds.
GBP/USD Mid-Day Outlook
Daily Pivots: (S1) 1.3205; (P) 1.3249; (R1) 1.3285; More...
Intraday bias in GBP/USD stays neutral for consolidations below 1.3291 temporary top. Further rally is expected as long as 55 4H EMA (now at 1.3085) holds. Above 1.3291 will resume the rise from 1.2099 to 61.8% projection of 1.2099 to 1.3206 from 1.2706 at 1.3390, and possibly further to 1.3433 high. However, sustained break of 55 4H EMA will turn bias back to the downside for deeper pullback.
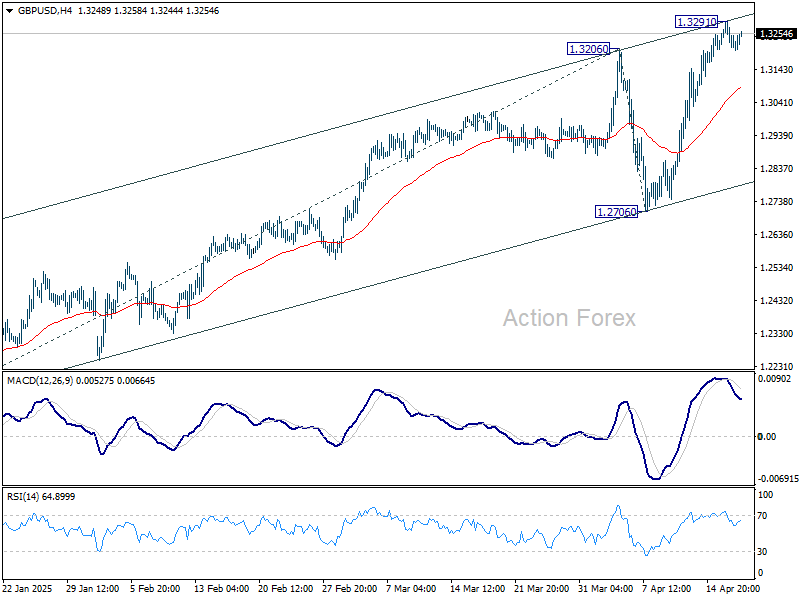
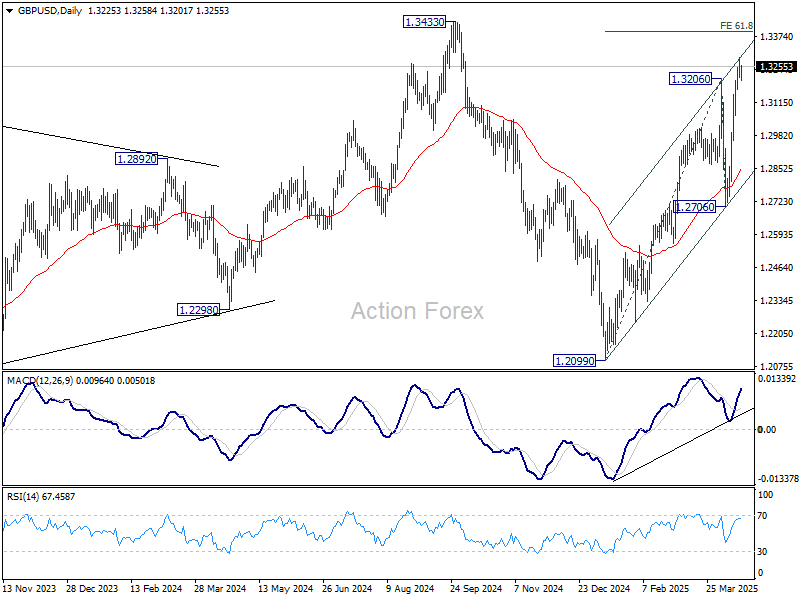
In the bigger picture, price actions from 1.3433 are seen as a corrective pattern to the up trend from 1.3051 (2022 low). Rise from 1.2099 could be the second leg. Overall, GBP/USD should target 1.4248 key resistance (2021 high) on break of 1.3433 at a later stage.
No Reaction to ECB Cut as Markets Drift in Pre-Holiday Lull
Trading in the forex markets remain calm, with little reaction to ECB’s widely anticipated 25bps rate cut. The move to lower its deposit rate to 2.25% was fully priced in. The central bank acknowledged that Eurozone growth prospects have deteriorated due to escalating global trade tensions, but this has long been embedded in market expectations. The absence of any forward guidance or new policy direction helped reinforce the market’s muted tone.
Indeed, the primary focus for investors remains the intensifying US trade war and its ripple effects on global economic sentiment. As markets break for the Easter weekend, investors are bracing for trade policy to return to center stage next week. The lack of clarity surrounding tariff policy and broader US trade strategy is increasingly weighing on corporate confidence. U.S. firms, in particular, are becoming more hesitant to invest or expand amid the shifting policy environment.
A Reuters poll conducted between April 14–17 illustrates the rising unease. The probability of a US recession within the next 12 months surged to 45%, up sharply from 25% in March and marking the highest reading since December 2023. All 45 economists who responded to a related question said that tariffs have negatively affected business sentiment, with nearly half describing the impact as “very negative.”
At the same time, economists are scaling up their inflation forecasts. Expectations for headline CPI, core CPI, PCE, and core PCE have all been revised higher, with all measures now projected to remain above Fed’s 2% target through at least 2027. A majority of economists—62 out of 101 surveyed—expect the Fed to hold its benchmark interest rate steady at 4.25%-4.50% until at least July.
In terms of currency performance, Kiwi continues to lead the pack this week while Aussie and Sterling follow. At the other end, Swiss Franc is the weakest, trailed by the Euro and Loonie. Dollar and Yen are trading in the middle of the pack.
In Europe at the time of writing, FTSE is down -0.38%. DAX is down -0.44%. CAC is down -0.74%. UK 10-year yield is down -0.03 at 4.579. Germany 10-year yield is down -0.03 at 2.482. Earlier in Asia, Nikkei rose 1.35%. Hong Kong HSI rose 1.61%. China Shanghai SSE rose 0.13%. Singapore Strait Times rose 1.58%. Japan 10-year JGB yield rose 0.015 to 1.312.
US initial jobless claims fall to 215k, vs exp 224k
US initial jobless claims fell -9k to 215k in the week ending April 12, below expectation of 224k. Four-week moving average of initial claims fell -2.5k to 221k.
Continuing claims rose 41k to 1885k in the week ending April 5. Four-week moving average of continuing claims rose 1k to 1867k.
ECB cuts rates to 2.25%, drops “restrictive” language amid mounting uncertainty
ECB cut its deposit rate by 25 bps points to 2.25% as widely expected, but the more notable shift came in the tone of its accompanying statement. ECB completely removed the reference to its policy stance being “restrictive,” a phrase that had previously signaled a bias toward further monetary easing.
This change suggests policymakers believe the easing campaign has brought rates closer to neutral territory. The central bank emphasized that it will maintain a data-dependent, meeting-by-meeting approach and is "not pre-committing to a particular rate path" given the exceptional levels of uncertainty.
ECB noted that disinflation process remains “well on track,” with both headline and core inflation continuing to decline in line with forecasts. Importantly, services inflation—previously a key sticking point—has also “eased markedly” in recent months.
However, the central bank also highlighted growing downside risks to the economic outlook. ECB acknowledged that rising global trade tensions have begun to weigh on business and household confidence. The resulting volatility in financial markets is already tightening financing conditions and could further dampen activity in the Eurozone.
BoJ's Nakagawa and Ueda highlight US tariff risk, urge vigilance
BoJ board member Junko Nakagawa cited US trade policy as one of the most significant risks to Japan’s economic outlook. In a speech, she noted that higher US tariffs could directly damage Japanese corporate activity, pressuring exports, production, sales, capital expenditure, and profitability.
Nakagawa also noted the potential for broader spillover effects, including weakened business and consumer sentiment and volatility in commodity prices and financial markets.
Echoing these concerns, BoJ Governor Kazuo Ueda told the parliament that uncertainty surrounding US policy, especially tariffs, has “heightened sharply” in recent weeks. Ueda stressed that the central bank will assess trade-related developments at each policy meeting without any pre-conception.
While reaffirming BoJ’s intention to raise interest rates if economic and price conditions align with projections, Ueda emphasized, "we must be vigilant to the fact uncertainty surrounding each country's trade policy is heightening."
Japan's exports grow 3.9% yoy in March, imports up 2.0% yoy
Japan’s exports rose 3.9% yoy in March to JPY 9.85T, below the expected 4.5% yoy gain. Shipments to the US rose 3.1% yoy overall, boosted by strong gains in electronic parts (+35.8%), pharmaceuticals (+29.7%), and autos (+4.1%). However, this was offset by weakness in China, where exports fell -4.8% yoy.
On the import side, inbound shipments rose 2.0% yoy to JPY 9.30T , also falling short of the forecast 3.1% yoy. That resulted in trade surplus of JPY 544B.
In seasonally adjusted term, exports dropped -3.8% mom to JPY 9.31 trillion, while imports ticked up 0.6% mom, bringing the adjusted trade balance into a JPY -234B deficit.
Australia jobs rise 32.2k in March, misses expectations
Australia added 32.2k jobs in March, falling short of expectations for a 41.2k increase. The composition of gains was relatively balanced with 15k full-time and 17.2k part-time positions added.
Unemployment rate ticked up slightly to 4.1% from 4.0%, coming in better than the expected 4.2%. The modest rise in the jobless rate was largely due to a higher participation rate, which increased from 66.7 to 66.8%.
A potential sign of underlying weakness came from a -0.3% mom decline in total monthly hours worked, the second consecutive monthly drop. But that could be attributed partly to weather disruptions linked to ex-Tropical Cyclone Alfred.
NZ CPI surprises to the upside at 2.5% in Q1, domestic pressures driving
New Zealand’s consumer prices rose more than expected in the first quarter, with CPI climbing 0.9% qoq and accelerating from 2.2% yoy to 2.5% yoy, above forecasts of 0.7% qoq and 2.3% yoy.
Nevertheless, this still marks the third consecutive quarter that annual inflation has stayed within RBNZ’s 1–3% target band.
Tradeable inflation, reflecting imported price dynamics, rose 0.8% qoq and just 0.3% yoy, indicating limited external pricing pressure. In contrast, non-tradeable inflation, a proxy for domestic conditions, surged 1.1% qoq and 4.0% yoy.
The strength in non-tradeables points to robust local demand and ongoing cost pressures within the domestic economy.
EUR/USD Mid-Day Outlook
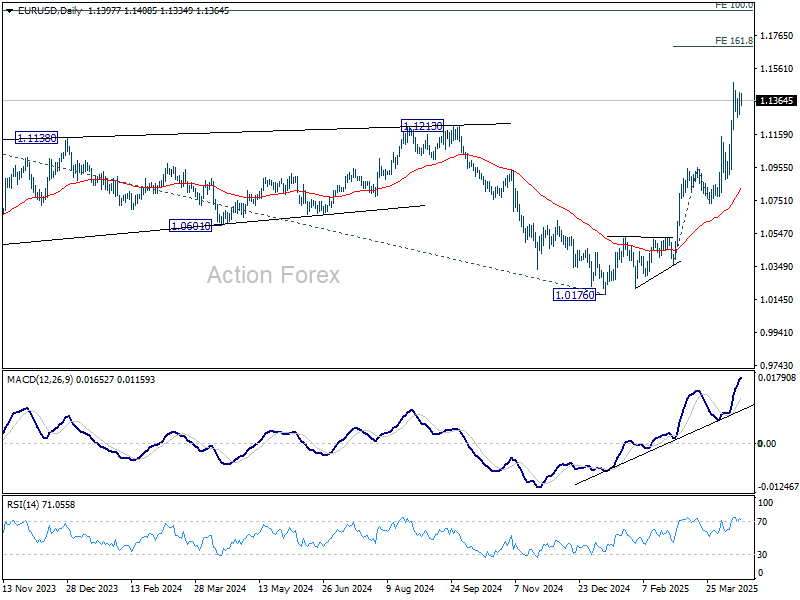
Daily Pivots: (S1) 1.1314; (P) 1.1363; (R1) 1.1449; More...
EUR/USD is still bounded in consolidation below 1.1472 and intraday bias remains neutral. Deeper retreat cannot be ruled out. But downside should be contained by 1.1145 resistance turned support to bring another rally. On the upside, break of 1.1472 will target 161.8% projection of 1.0358 to 1.0953 from 1.0731 at 1.1694.
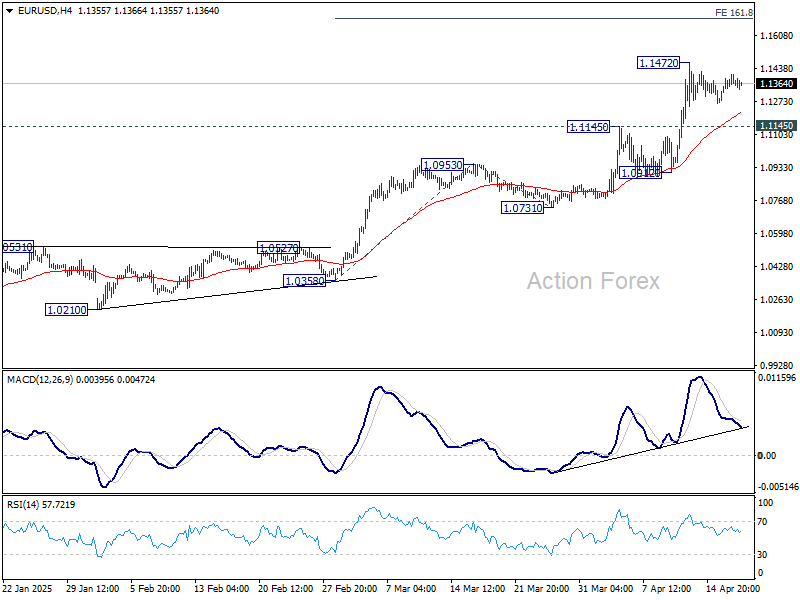
In the bigger picture, rise from 0.9534 long term bottom could be correcting the multi-decade downtrend or the start of a long term up trend. In either case, further rise should be seen to 100% projection of 0.9534 to 1.1274 from 1.0176 at 1.1916. This will now remain the favored case as long as 55 W EMA (now at 1.0745) holds.