
Sample Category Title
Powell Warns Against Higher and Stickier Inflation, ECB Decides
Yesterday was yet another ugly day of trading, especially for the US and the technology companies. Discouraging news started flowing since early hours of the European session: ASML announced a bigger fall in its orders in the Q1 and its CEO blamed the tariff uncertainty for the soft numbers. A few hours before that, Nvidia was told to need a licence to sell its H20 chips – made for the Chinese market – to China and announced the latter would lead to a $5.5bn writeoff in the current quarter. Then, we had a very slight optimism as China said that that the country could be open to negotiations IF Donald Trump and his administration showed respect to China (that’s probably harder to achieve than it sounds). And finally, the Federal Reserve (Fed) President warned that the tariffs were significantly higher than they thought, that they could soften employment and boost inflation, that inflation could stick around longer than they thought, that they don’t know how long the impacts will flow through the economy and how they will impact the long-term inflation expectations. He added that they can’t achieve long-term strong growth and employment if they don’t achieve price stability first. In simple words, Powell said inflation is their priority and that the best thing to do it to wait before cutting rates. Voila.
On the data front, the US retail sales jumped as households rushed to buy things – including cars - before the tariffs hit, industrial production slowed more than expected and the Chinese low-price retailers Temu and Shein said they are raising the prices of their products as they no longer benefit from the ‘de minimis’ exemption from tariffs. Volkswagen on the other hand said that they won’t immediately raise the prices of their cars.
Speaking of inflation... note that this time, the inflation expectations are rising for the US and not necessarily for elsewhere – at least not just yet. Historically, when the US inflation expectations rise, the Fed would be expected to tighten policy and that would lead to a stronger dollar and the strength of the dollar would spread inflation toward the rest of the world. But because the US dollar is weakening on waning US growth expectations, the rising inflationary pressures of the US are less threatening for the rest of the world. A potential supply chain crisis would be broadly harmful, but there is always a chance that the rest of the world reorganizes supply chains to limit the negative impact of the US policies on their own economies.
The European stocks were relatively stable despite a 7% slump in ASML post-earnings. The Stoxx 600 closed just 0.18% lower and above the 500 psychological mark and above the major 38.2% Fibonacci retracement on the March – April retreat. TSM announced better than expected income this morning but a part if that strength could be due to frontloading of demand before the tariffs hit. As such, sentiment remains fragile and any positive momentum could be hard to defend. Note however that the European defense names lead the rebound in European equities as the geopolitical tensions with the US don’t give signs of abating. As such, the euro and the European assets will likely continue to outperform their US peers. Today, the European Central Bank (ECB) is expected to announce a 25bp rate cut to provide relief to the European economies in the middle of a global turmoil. President Lagarde will probably refrain from making commitments to future rate cuts as the path of the monetary policy is highly dependent on the trade developments, the fiscal responses from the underlying EZ governments and the end result on the zone’s economy and price trends. The fact that the euro unexpectedly shined in the Q1, and the significant decline in energy prices are supportive of growth, and there is a chance that the EU and the US reach a trade deal in the coming weeks. That would be the best of both worlds. The EU would still spend big to strengthen military and infrastructure while not taking a hit on the trade front. As per the euro, the outlook remains positive, both against the US dollar and sterling, on rising reserve demand and the bets that the ample fiscal spending would accelerate growth in Europe.
Across the pond, the markets were shattered yesterday. Nvidia lost up to 10% but closed the session near 7% lower, AMD, which is facing the same Chinese pain, tanked more than 7.35%, the Magnificent 7 tanked nearly 4%, the S&P500 fell more than 2% while the US 10-year yield fell below 4.30% - that’s a good sign, it at least means that some safe heaven flows fed into the US 10-year papers instead of going directly into gold and franc. But gold remains bid and hit another record high this morning in Asia, while the franc remained strongly bid on the back of safety reasons. The franc’s strength is reviving bets on a potential Swiss National Bank (SNB) intervention around the 0.92 level against the euro. However, a direct currency move would be politically sensitive, as Switzerland is currently in critical negotiations with the US to lower tariffs below 30%. Now would be the wrong time to reignite Trump-era accusations of currency manipulation.
USD/CAD Daily Outlook
Daily Pivots: (S1) 1.3817; (P) 1.3896; (R1) 1.3936; More...
USD/CAD is still bounded in consolidations above 1.3827 and intraday bias remains neutral. While stronger recovery cannot be ruled out, outlook will stay bearish as long as 1.4150 support turned resistance holds. On the downside, break of 1.3827 will resume the fall from 1.4791 to 100% projection of 1.4791 to 1.4150 from 1.4414 at 1.3773.
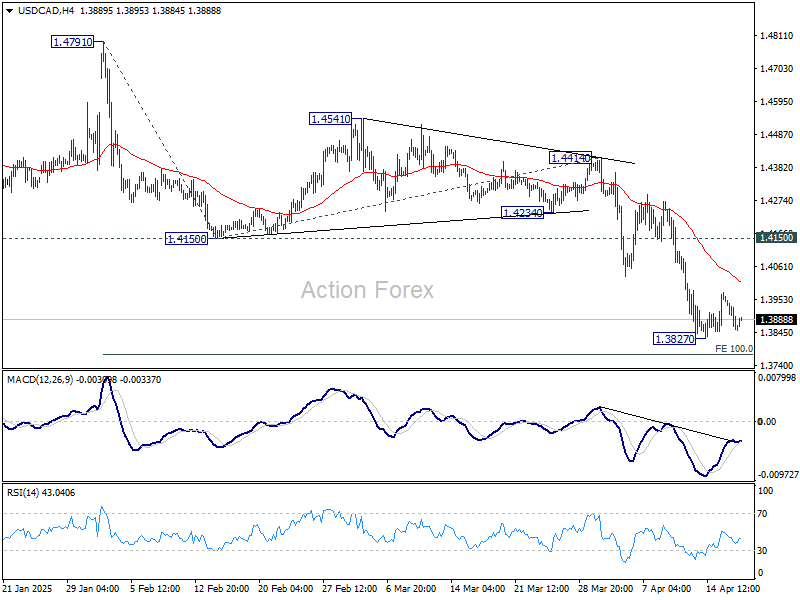
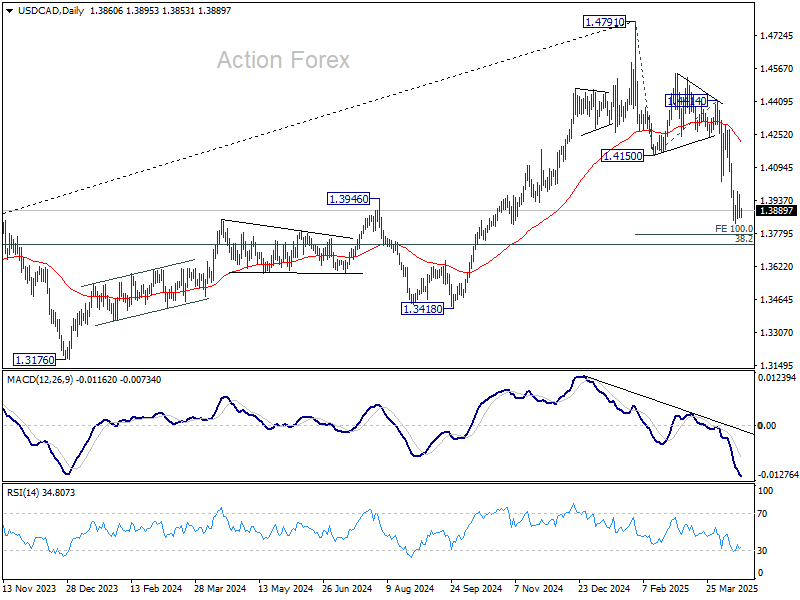
In the bigger picture, the break of 1.3976 resistance turned support (2022 high) and 55 W EMA (now at 1.3983) indicates that a medium term top is already in place at 1.4791. Fall from there would either be a correction to rise from 1.2005, or trend reversal. In either case, firm break of 38.2% retracement of 1.2005 (2021 low) to 1.4791 at 1.3727 will pave the way back to 61.8% retracement at 1.3069.
Muted Markets Await ECB Cut, While US-Japan Trade Talks Show Tentative Progress
The forex markets held steady in tight ranges during Asian session, with investors treading cautiously ahead of the Easter long weekend. Market mood has been mildly lifted by signs of progress in US-Japan trade negotiations. In a surprise move, US President Donald Trump joined preliminary talks and later declared “Big Progress!” via social media, injecting some optimism into an otherwise quiet session.
While Trump's gesture lifted sentiment briefly, Japanese Economy Minister Ryosei Akazawa remained measured, describing the meeting as a first step with a second round planned for later this month. He also confirmed that exchange rates were not part of the discussions, indicating Tokyo’s desire to keep talks focused on trade and investment.
Markets will now turn their attention to the ECB’s policy decision later today, where a 25bps cut in deposit rate to 2.25% is widely anticipated. The focus will be on ECB’s guidance and choice of language. In its last meeting, the Governing Council avoided declaring whether policy was still restrictive, and instead said it had become "meaningfully less restrictive". This strategy is expected to continue, particularly as internal divisions within the ECB remain over forward guidance amid elevated uncertainty.
While some may hope for clearer signals on the future rate path, ECB is unlikely to oblige. According to the minutes of the previous meeting, several members stressed the need to avoid committing to even any directional bias on future moves. That caution is likely to persist, especially as external risks, including US trade actions and global demand uncertainty, still loom large. As a result, markets should expect a rate cut accompanied by continued strategic ambiguity.
Currency performance this week so far see Kiwi leads after stronger-than-expected CPI figures. Sterling follows as second despite mixed UK employment and inflation miss. Aussie is also holding firm even after weak job data. On the other side, Loonie is the weakest, with the BoC hold overnight failing to inspire confidence. Swiss Franc and Dollar are also underperforming, while Euro and Yen are trading in the middle.
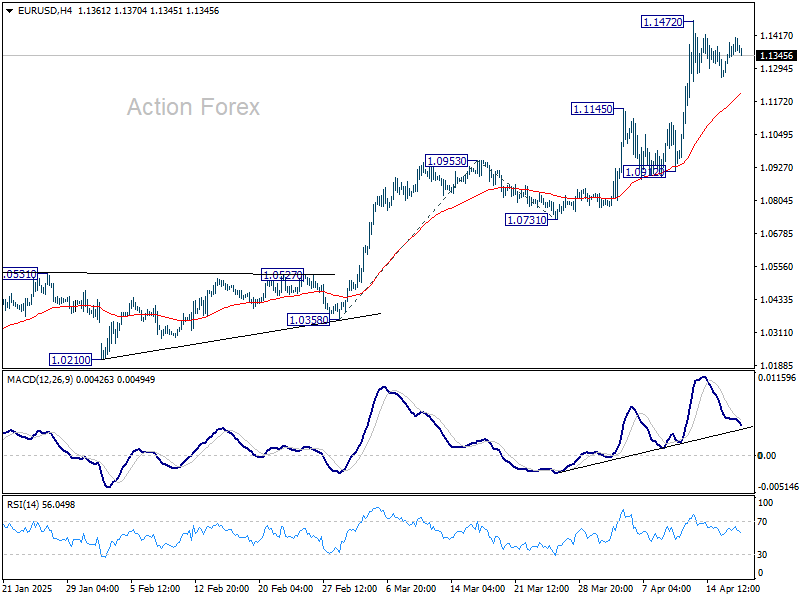
Technically, it looks like EUR/USD's consolidation from 1.1472 is going to extend with another downleg. A dovish ECB outlook today could fuel some selloff. But downside should be contained by 1.1145 resistance turned support to bring rebound. Break of 1.1472 resistance is expected, to resume the larger up trend, after current consolidation completes.
In Asia, at the time of writing, Nikkei is up 1.01%. Hong Kong HSI is up 1.38%. China Shanghai SSE is down -0.03%. Singapore Strait Times is up 0.93%. Japan 10-year JGB yield is up 0.02 at 1.318. Overnight, DOW fell -1.73%. S&P 500 fell -2.24%. NASDAQ fell -3.07%. 10-year yield fell -0.044 to 4.279.
Fed's Powell warns of dual-mandate tensions ahead
In a speech overnight, Fed Chair Jerome Powell pointed to substantial changes underway, by US administration, in trade, immigration, fiscal policy, and regulation—all of which are still “evolving” and difficult to assess in terms of economic impact.
In particular, Powell acknowledged that the scale of tariff increases already announced is “significantly larger than anticipated,” and warned that the resulting economic effects will likely include “higher inflation and slower growth.”
Powell noted a clear rise in near-term inflation expectations, with both market-based breakevens and survey indicators moving up in response to the new tariff regime. While long-term expectations remain largely anchored, he cautioned that the inflationary impulse from tariffs could prove “more persistent” than initially thought. In the near term, tariffs are highly likely to generate "at least a temporary rise in inflation" .
Importantly, Powell acknowledged that Fed could face a scenario where its "dual-mandate goals are in tension." In such a case, policymakers would need to carefully weigh how far the economy is from each objective, and over what time horizons those gaps might close.
BoJ's Nakagawa and Ueda highlight US tariff risk, urge vigilance
BoJ board member Junko Nakagawa cited US trade policy as one of the most significant risks to Japan’s economic outlook. In a speech, she noted that higher US tariffs could directly damage Japanese corporate activity, pressuring exports, production, sales, capital expenditure, and profitability.
Nakagawa also noted the potential for broader spillover effects, including weakened business and consumer sentiment and volatility in commodity prices and financial markets.
Echoing these concerns, BoJ Governor Kazuo Ueda told the parliament that uncertainty surrounding US policy, especially tariffs, has “heightened sharply” in recent weeks. Ueda stressed that the central bank will assess trade-related developments at each policy meeting without any pre-conception.
While reaffirming BoJ’s intention to raise interest rates if economic and price conditions align with projections, Ueda emphasized, "we must be vigilant to the fact uncertainty surrounding each country's trade policy is heightening."
Japan's exports grow 3.9% yoy in March, imports up 2.0% yoy
Japan’s exports rose 3.9% yoy in March to JPY 9.85T, below the expected 4.5% yoy gain. Shipments to the US rose 3.1% yoy overall, boosted by strong gains in electronic parts (+35.8%), pharmaceuticals (+29.7%), and autos (+4.1%). However, this was offset by weakness in China, where exports fell -4.8% yoy.
On the import side, inbound shipments rose 2.0% yoy to JPY 9.30T , also falling short of the forecast 3.1% yoy. That resulted in trade surplus of JPY 544B.
In seasonally adjusted term, exports dropped -3.8% mom to JPY 9.31 trillion, while imports ticked up 0.6% mom, bringing the adjusted trade balance into a JPY -234B deficit.
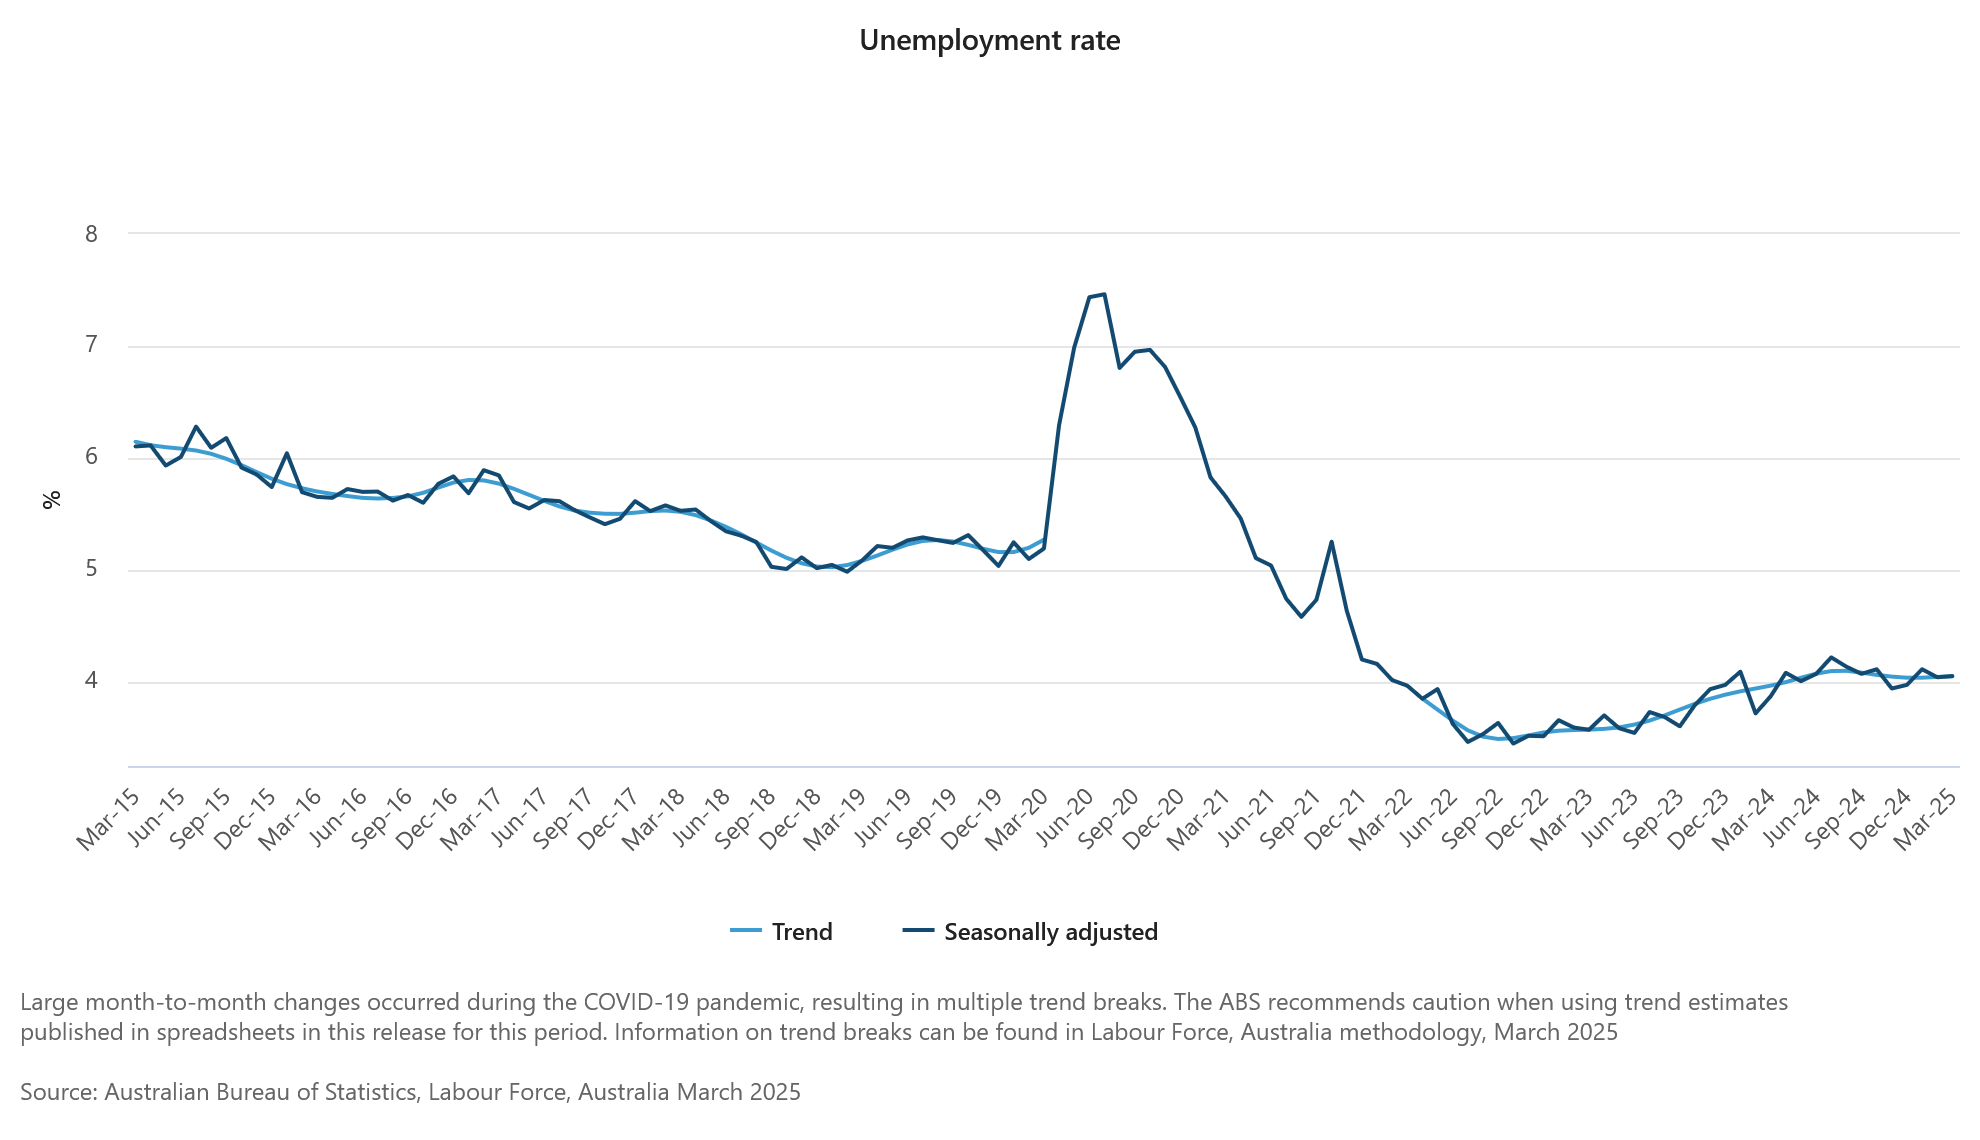
Australia jobs rise 32.2k in March, misses expectations
Australia added 32.2k jobs in March, falling short of expectations for a 41.2k increase. The composition of gains was relatively balanced with 15k full-time and 17.2k part-time positions added.
Unemployment rate ticked up slightly to 4.1% from 4.0%, coming in better than the expected 4.2%. The modest rise in the jobless rate was largely due to a higher participation rate, which increased from 66.7 to 66.8%.
A potential sign of underlying weakness came from a -0.3% mom decline in total monthly hours worked, the second consecutive monthly drop. But that could be attributed partly to weather disruptions linked to ex-Tropical Cyclone Alfred.
NZ CPI surprises to the upside at 2.5% in Q1, domestic pressures driving
New Zealand’s consumer prices rose more than expected in the first quarter, with CPI climbing 0.9% qoq and accelerating from 2.2% yoy to 2.5% yoy, above forecasts of 0.7% qoq and 2.3% yoy.
Nevertheless, this still marks the third consecutive quarter that annual inflation has stayed within RBNZ’s 1–3% target band.
Tradeable inflation, reflecting imported price dynamics, rose 0.8% qoq and just 0.3% yoy, indicating limited external pricing pressure. In contrast, non-tradeable inflation, a proxy for domestic conditions, surged 1.1% qoq and 4.0% yoy.
The strength in non-tradeables points to robust local demand and ongoing cost pressures within the domestic economy.
Looking ahead
ECB rate decision is the main focus in European session. Later in the day, US will release jobless claims, Philly Fed survey, housing starts and building permits.
USD/CAD Daily Outlook
Daily Pivots: (S1) 1.3817; (P) 1.3896; (R1) 1.3936; More...
USD/CAD is still bounded in consolidations above 1.3827 and intraday bias remains neutral. While stronger recovery cannot be ruled out, outlook will stay bearish as long as 1.4150 support turned resistance holds. On the downside, break of 1.3827 will resume the fall from 1.4791 to 100% projection of 1.4791 to 1.4150 from 1.4414 at 1.3773.
In the bigger picture, the break of 1.3976 resistance turned support (2022 high) and 55 W EMA (now at 1.3983) indicates that a medium term top is already in place at 1.4791. Fall from there would either be a correction to rise from 1.2005, or trend reversal. In either case, firm break of 38.2% retracement of 1.2005 (2021 low) to 1.4791 at 1.3727 will pave the way back to 61.8% retracement at 1.3069.
BoJ’s Nakagawa and Ueda highlight US tariff risk, urge vigilance
BoJ board member Junko Nakagawa cited US trade policy as one of the most significant risks to Japan’s economic outlook. In a speech, she noted that higher US tariffs could directly damage Japanese corporate activity, pressuring exports, production, sales, capital expenditure, and profitability.
Nakagawa also noted the potential for broader spillover effects, including weakened business and consumer sentiment and volatility in commodity prices and financial markets.
Echoing these concerns, BoJ Governor Kazuo Ueda told the parliament that uncertainty surrounding US policy, especially tariffs, has “heightened sharply” in recent weeks. Ueda stressed that the central bank will assess trade-related developments at each policy meeting without any pre-conception.
While reaffirming BoJ’s intention to raise interest rates if economic and price conditions align with projections, Ueda emphasized, "we must be vigilant to the fact uncertainty surrounding each country's trade policy is heightening."
Japan’s exports grow 3.9% yoy in March, imports up 2.0% yoy
Japan’s exports rose 3.9% yoy in March to JPY 9.85T, below the expected 4.5% yoy gain. Shipments to the US rose 3.1% yoy overall, boosted by strong gains in electronic parts (+35.8%), pharmaceuticals (+29.7%), and autos (+4.1%). However, this was offset by weakness in China, where exports fell -4.8% yoy.
On the import side, inbound shipments rose 2.0% yoy to JPY 9.30T , also falling short of the forecast 3.1% yoy. That resulted in trade surplus of JPY 544B.
In seasonally adjusted term, exports dropped -3.8% mom to JPY 9.31 trillion, while imports ticked up 0.6% mom, bringing the adjusted trade balance into a JPY -234B deficit.
Gold’s Record-Breaking Run—Trade Tensions Light the Fire
Key Highlights
- Gold started a fresh increase and traded to a new record high above $3,350.
- The current price on the 4-hour chart is still bullish above $3,250.
- EUR/USD is eyeing more gains above the 1.1420 resistance zone.
- WTI Crude Oil prices could start a recovery wave if there is a move above the $64.00 resistance.
Gold Price Technical Analysis
Gold prices started a fresh increase from the $3,120 support zone. The recent recession fears and trade war sparked more upsides above the $3,250 resistance.
The 4-hour chart of XAU/USD indicates that the price gained pace for a move above the $3,300 level. The price settled well above the 200 Simple Moving Average (green, 4 hours) and the 100 Simple Moving Average (red, 4 hours).
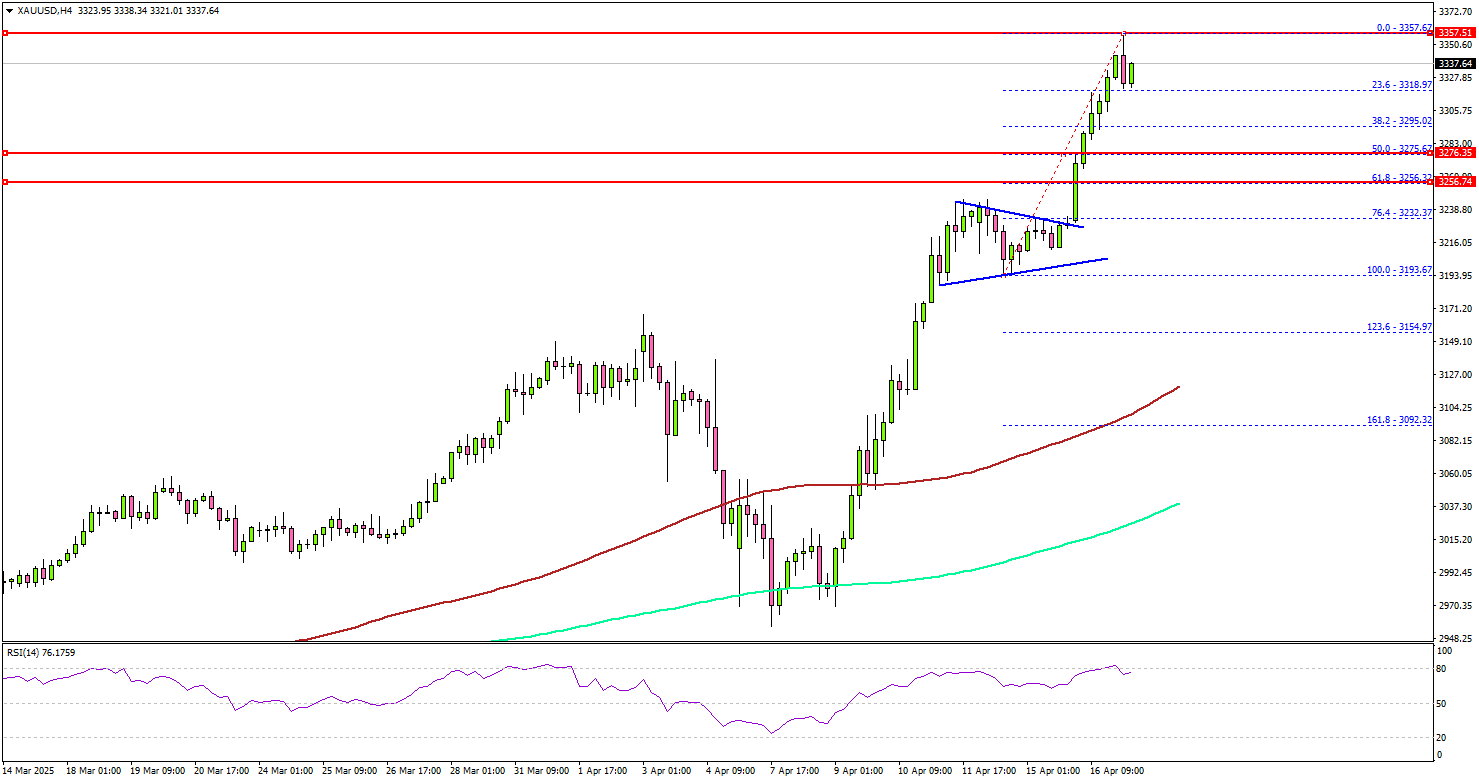
A new record high was formed near $3,357 and the price started a consolidation phase. The current price action is still bullish and the bulls could aim for a fresh increase.
On the upside, immediate resistance is near the $3,350 level. The next major resistance sits near the $3,365 level. A clear move above the $3,365 resistance could open the doors for more upsides. The next major resistance could be $3,380, above which the price could rally toward the milestone level of $3,420.
On the downside, initial support is near the $3,295 level. The first key support is near $3,255. The next major support is near the $3,240 level.
The main support is now $3,222. A downside break below the $3,222 support might call for more downsides. The next major support is near the $3,150 level.
Looking at EUR/USD, the pair started a short-term downside correction and might soon aim for a fresh increase if it clears the 1.1420 resistance.
Economic Releases to Watch Today
- ECB Interest Rate Decision - Forecast 2.25%, versus 2.5% previous.
- US Initial Jobless Claims - Forecast 225K, versus 223K previous.
Australia jobs rise 32.2k in March, misses expectations
Australia added 32.2k jobs in March, falling short of expectations for a 41.2k increase. The composition of gains was relatively balanced with 15k full-time and 17.2k part-time positions added.
Unemployment rate ticked up slightly to 4.1% from 4.0%, coming in better than the expected 4.2%. The modest rise in the jobless rate was largely due to a higher participation rate, which increased from 66.7 to 66.8%.
A potential sign of underlying weakness came from a -0.3% mom decline in total monthly hours worked, the second consecutive monthly drop. But that could be attributed partly to weather disruptions linked to ex-Tropical Cyclone Alfred.
NZ CPI surprises to the upside at 2.5% in Q1, domestic pressures driving
New Zealand’s consumer prices rose more than expected in the first quarter, with CPI climbing 0.9% qoq and accelerating from 2.2% yoy to 2.5% yoy, above forecasts of 0.7% qoq and 2.3% yoy.
Nevertheless, this still marks the third consecutive quarter that annual inflation has stayed within RBNZ’s 1–3% target band.
Tradeable inflation, reflecting imported price dynamics, rose 0.8% qoq and just 0.3% yoy, indicating limited external pricing pressure. In contrast, non-tradeable inflation, a proxy for domestic conditions, surged 1.1% qoq and 4.0% yoy.
The strength in non-tradeables points to robust local demand and ongoing cost pressures within the domestic economy.
Fed’s Powell warns of dual-mandate tensions ahead
In a speech overnight, Fed Chair Jerome Powell pointed to substantial changes underway, by US administration, in trade, immigration, fiscal policy, and regulation—all of which are still “evolving” and difficult to assess in terms of economic impact.
In particular, Powell acknowledged that the scale of tariff increases already announced is “significantly larger than anticipated,” and warned that the resulting economic effects will likely include “higher inflation and slower growth.”
Powell noted a clear rise in near-term inflation expectations, with both market-based breakevens and survey indicators moving up in response to the new tariff regime. While long-term expectations remain largely anchored, he cautioned that the inflationary impulse from tariffs could prove “more persistent” than initially thought. In the near term, tariffs are highly likely to generate "at least a temporary rise in inflation" .
Importantly, Powell acknowledged that Fed could face a scenario where its "dual-mandate goals are in tension." In such a case, policymakers would need to carefully weigh how far the economy is from each objective, and over what time horizons those gaps might close.
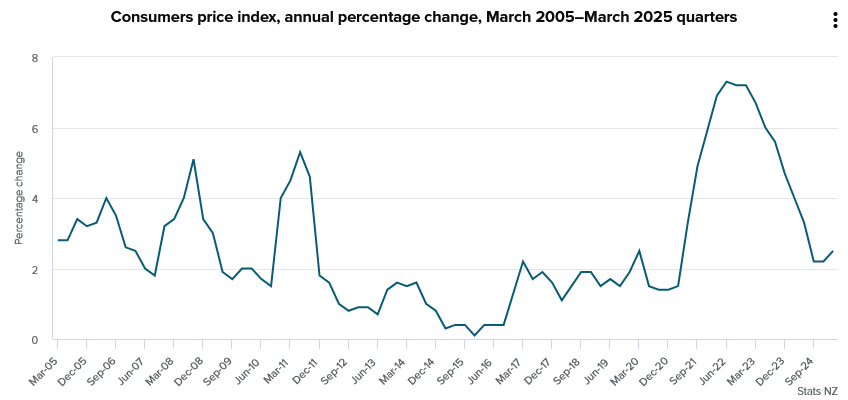
First Impressions: NZ Consumers Price Index, March Quarter 2025
Inflation was slightly stronger than expected in the March quarter. Prices were up 0.9% over the quarter and 2.5% over the past year. However, underlying inflation pressures remain well contained.
Consumers Price Index, March quarter 2025 – key stats
Headline inflation
- Quarterly change: +0.9% (prev: +0.5%)
- Westpac forecast: +0.8%, RBNZ (February MPS): +0.8%
- Market median: +0.8%, range +0.3% to. +0.9%
- Annual change: +2.5% (prev: +2.2%)
- Westpac forecast: +2.4%, RBNZ (February MPS): +2.4%, Market: +2.4%
Non-tradables
- Quarterly change: +1.1% (prev: +0.7%)
- Westpac forecast: +0.9%, RBNZ (February MPS): +0.9%
- Annual change: +4.0% (prev: +4.5%)
Tradables
- Quarterly change: +0.8% (prev: +0.3%)
- Westpac forecast: +0.7%, RBNZ (February MPS): +0.7%
- Annual change: +0.3% (prev: -1.1%)
Consumer prices rose 0.9% in the March quarter. That saw the annual inflation rate rising to 2.5%, up from 2.2% in the year to December.
The March quarter inflation result was a little above the 0.8% rise that we and the RBNZ were expecting.
However, the RBNZ’s forecast was finalised back in February. Since that time, we’ve seen large increases in the prices of volatile items like food and overseas holiday costs, which are not the key focus for monetary policy. In addition, today’s result was boosted by a change in how tertiary education costs are measured.
More generally, the underlying trend in inflation is looking well contained, with measures of core inflation trending back to levels consistent with the RBNZ’s target band.
What underpinned inflation in the March quarter?
Much of the rise in consumer prices in the March quarter was related to large price movements in a few specific areas:
- Petrol prices (3.5%) of the CPI were the largest contributor to quarterly inflation, rising 4.6%.
- Food prices (18% of the CPI) were up 1.8% over the quarter. That was mainly due to a large 3% rise in grocery food prices, with higher prices for items like milk and cheese as dairy prices have risen.
- There have also been increases in the cost of chocolate and other snack foods (just in time for the Easter holidays).
- The March quarter also saw the annual increase in the tobacco excise tax, with cigarette and tobacco prices up 3.8%.
Balanced against those price rises, the March quarter saw an 8% fall in international airfares, which typically decline at this time of year.
There were a couple of other notable price movements:
- There was a 23% increase in tertiary education costs. This was due to a measurement change related to how fee-free programs are measured. If not for this change, tertiary education costs would have been up 5%. This very large surprise accounts for the bulk of the upside surprise to our non-tradables forecast.
- Average housing rents were up 0.7% over the past three months. Rents are the largest component of the CPI and we typically see larger increases at this time of year. However, this year’s increase was the lowest March quarter result since 2019.
- The cost of purchasing a newly built home was up 0.6% in March quarter and is up just 1.9% over the past year. That’s the smallest annual increase since 2010 and reflects the protracted downturn in building activity over the past year. We’re forecasting homebuilding activity will remain subdued over the year ahead.
- We also saw further solid increases in insurance premiums over the past three months. However, after very large increases over the past year, the pace of those rises is now easing off as many insurance policies have rolled on to higher premiums.
Annual and core inflation – Contained, despite quarterly volatility.
Annual inflation rose to 2.5% in the March quarter. That’s up from 2.2% in the year to December, but still well within the RBNZ’s 1% to 3% target band.
The recent uptick in annual inflation is due to a turn-around in tradable prices (mainly imported goods).
- Tradable prices rose 0.8% in the March quarter, leaving them up 0.3% over the past year. Looking at the longer-term trend, tradables inflation remains low, but prices aren’t dropping like they did last year when the combination of lower import costs and soft domestic spending resulted in prices falling for many consumer goods, like furnishings and apparel.
- Looking ahead, we don’t expect a return to the high rates of tradables inflation that we saw in the wake of the pandemic. However, with the drop in the NZ dollar since late last year and prices already picking up, tradables inflation is expected to continue pushing higher over the coming months. That’s important as it will limit the downside for overall inflation over the remainder of this year.
Domestic prices (aka. non-tradables) were also stronger than we or the RBNZ expected, with prices rising by 1.1% in the March quarter. In annual terms, non-tradables inflation has cooled, but by less than expected, slowing to 4.0%, down from 4.5% in the year to December.
- As noted above, the stronger than expected non-tradables inflation in the March quarter was mainly due to the large increase in education costs, rather than increases in the more cyclical components of domestic prices.
- Looking at non-tradable prices more generally, we are seeing pressures easing, consistent with the softness in domestic activity which has seen muted growth in wages and service sector prices. We’ve also seen an easing in rents and subdued increases in the cost of new housing. Price changes on this front will be a key focus for the RBNZ.
Looking at the longer-term trend in consumer prices, inflation pressures are looking well contained. That was evident in the various measures of core inflation which have continued to trend down and are now back inside the RBNZ’s target band. (Core inflation measures smooth through volatile quarter-to-quarter movements and instead track the underlying trend in prices. They are a key focus for the RBNZ when assessing the strength of inflation pressures.)
In terms of specifics:
- Inflation excluding food, fuel and energy costs fell to 2.6% from 3.0% previously.
- Trimmed mean inflation fell to 2.3% from 2.4% previously.
- Weighted median inflation fell to 2.2% from 2.6%.
Outlook
Inflation is comfortably inside the 1% to 3% target band, and we expect that it will remain there over the year ahead. Even so, it’s likely to linger above 2%. While domestic price pressures are gradually easing, there are still some pockets of pressure (like local council rates). In addition, imported price pressures won’t be the large drag that they were last year.
We’re now watching to see how the domestic economy responds to the sharp easing in borrowing costs which is working its way through the economy. And of course, we’re keeping a close eye on global conditions and the New Zealand dollar which are clouding the longer-term outlook for imported inflation.