
Sample Category Title
EURUSD Outlook: Why the Dollar Keeps Falling?
Fundamental Analysis
On Tuesday, April 15, 2025, the US dollar extended its weakness against the euro due to several key factors. President Trump’s unpredictable trade policies, including new tariffs on Chinese tech products, created uncertainty in global markets and weakened confidence in the dollar as a haven. Additionally, European rating agency Scope warned of a potential downgrade of the US credit rating if trade tensions continue, which could further erode global trust in the dollar. At the same time, falling US Treasury yields and volatility in the bond market reflected growing risk aversion among investors, who are seeking shelter in assets like gold, which reached new all-time highs.
What Does the COT Report Tell Us?
The COT (Commitments of Traders) report is a weekly publication by the CFTC that shows the net positions of major players in the futures markets. Retail traders focus particularly on the positions of non-commercial traders (institutions and large funds), as they tend to drive market direction. Last week, speculators became aggressive net sellers of the US dollar, reducing long positions and increasing short positions, marking the most bearish stance on the dollar in the past six months. At the same time, net speculative long positions on the euro increased, signalling bullish sentiment. This divergence suggests that institutional traders expect further appreciation of the euro against the dollar, which supports long strategies on EURUSD.
Technical Analysis | EURUSD, H4
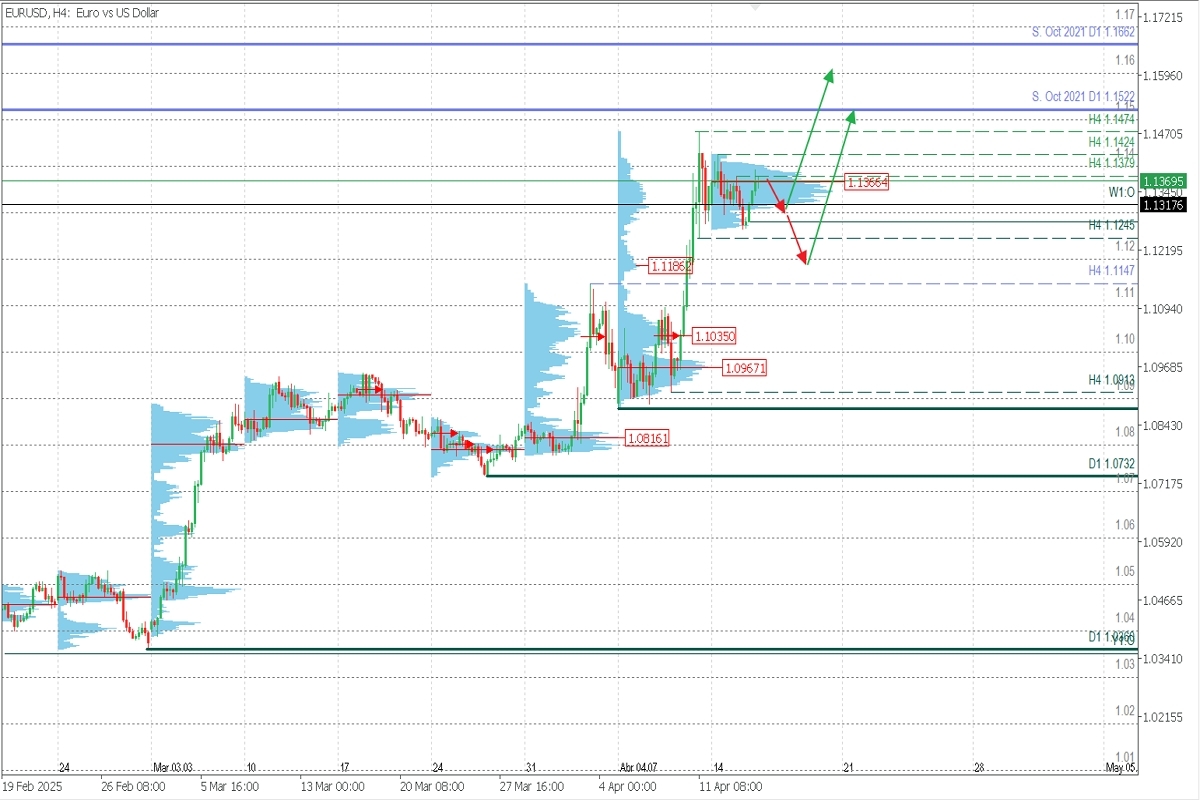
- Supply Zone (Sell): 1.1522
- Demand Zones (Buy): 1.1186 | 1.1035 | 1.0967
Price Action
The technical structure remains bullish, with the last validated support on H4 at 1.0913. This is the most recent key level confirming the trend’s continuation.
Volume Profile
Weekly volume profiles show the latest demand zone around 1.0967, while smaller buy volume nodes at 1.1035 and 1.1186 also act as important support levels. Based on three full trading days, the current week’s volume POC (Point of Control) can begin to be considered from Wednesday and is forming around 1.1366.
Technical Setup
Price is currently breaking above the last resistance of the correction at 1.1379 — a first sign of bullish continuation. A retracement of about 1/3 or 50% toward 1.1320 would offer a favourable entry for new long positions targeting 1.14 and beyond. However, this breakout may become a trap (false breakout) if the price drops sharply below 1.1366 and extends lower toward 1.1245. That would indicate a broader bearish correction, possibly seeking liquidity at nearby demand zones like 1.12 and 1.1147, where new buyers could step in to prevent further decline.
Technical Summary
- Main bullish scenario: Buy from 1.1320 with targets at 1.1424, 1.1474, and 1.1522 (October’s broken support now acting as resistance).
- Bearish scenario: Sell below 1.1366, targeting 1.1317 and extending toward 1.13 and 1.1245. A confirmed break of 1.1245 would open deeper downside toward 1.12 and 1.1186.
Trading Tips
Exhaustion/Reversal Pattern (PAR):
Before entering any position at key zones, always wait for confirmation of a PER (Pattern of Exhaustion or Reversal) on the M5 chart. Learn how to identify it here.
POC (Point of Control):
The POC is the level with the highest volume concentration. If a bearish move started from that area, it acts as resistance. If a bullish impulse came from it, the zone acts as support.
US100: Bearish Continuation Scenario
Key Developments
- Nvidia warned of a $5.5B charge due to U.S. export restrictions on its H20 GPUs to China. The U.S. now requires special licenses to export advanced chips.
- This triggered a global tech sell-off:
- Nvidia -5%, AMD -6%, Micron -3.5%, ASML -4.3%
- Broader tech names like Meta, Alphabet, Microsoft, and Tesla also declined.
- U.S.-China trade tensions are escalating, with tariffs still active on Chinese goods while exemptions for smartphones and PCs appear temporary.
- Major U.S. indices are down >4% since Trump's tariff announcement on April 2nd.
Forex Impact Analysis
- Investors await U.S. retail sales (expected +1.2%) and industrial production data, which could potentially trigger USD volatility.
- Fed remains in the spotlight amid sticky inflation and rising trade uncertainty.
- El-Erian warns of rising volatility ahead, citing political and central bank uncertainty.
Tech-driven risk aversion is positive for USD, especially against risk-linked currencies (AUD, NZD, GBP) and EM FX. Keep an eye on U.S.-China headlines, as further escalation may drag on global sentiment — with JPY and USD safe-haven pairs likely to benefit.
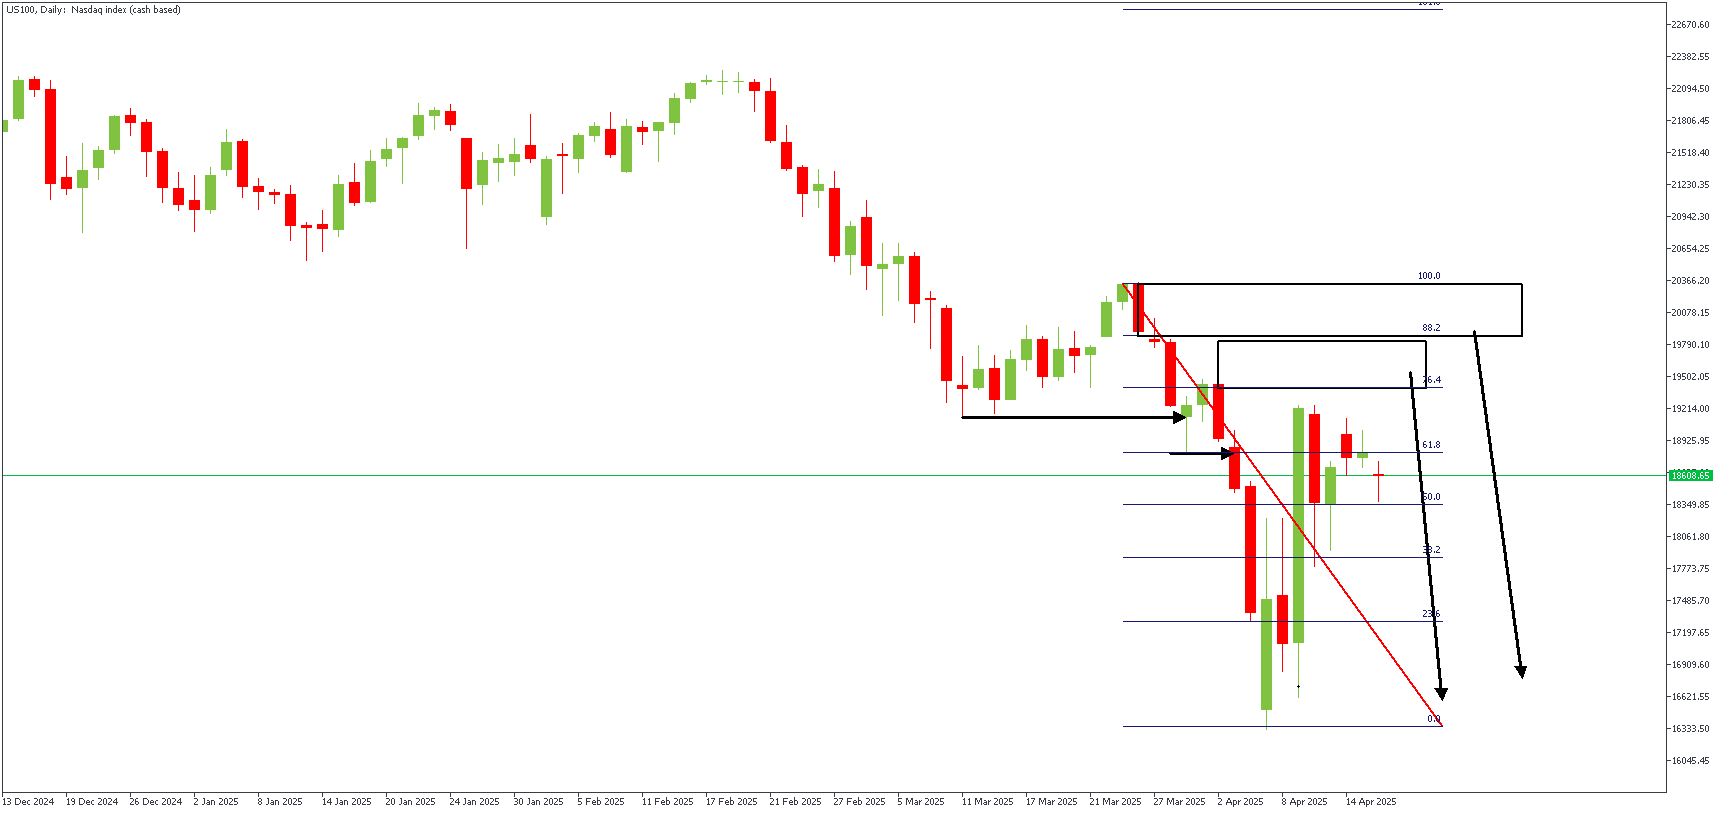
US100 – D1 Timeframe
The recent bearish break of structure on the daily timeframe chart of US100 set the tone for a bearish continuation of the original bearish impulse. The ongoing bullish retracement is inching closer to the rally-base-drop supply region, which sits within the key zone of the Fibonacci retracement tool.
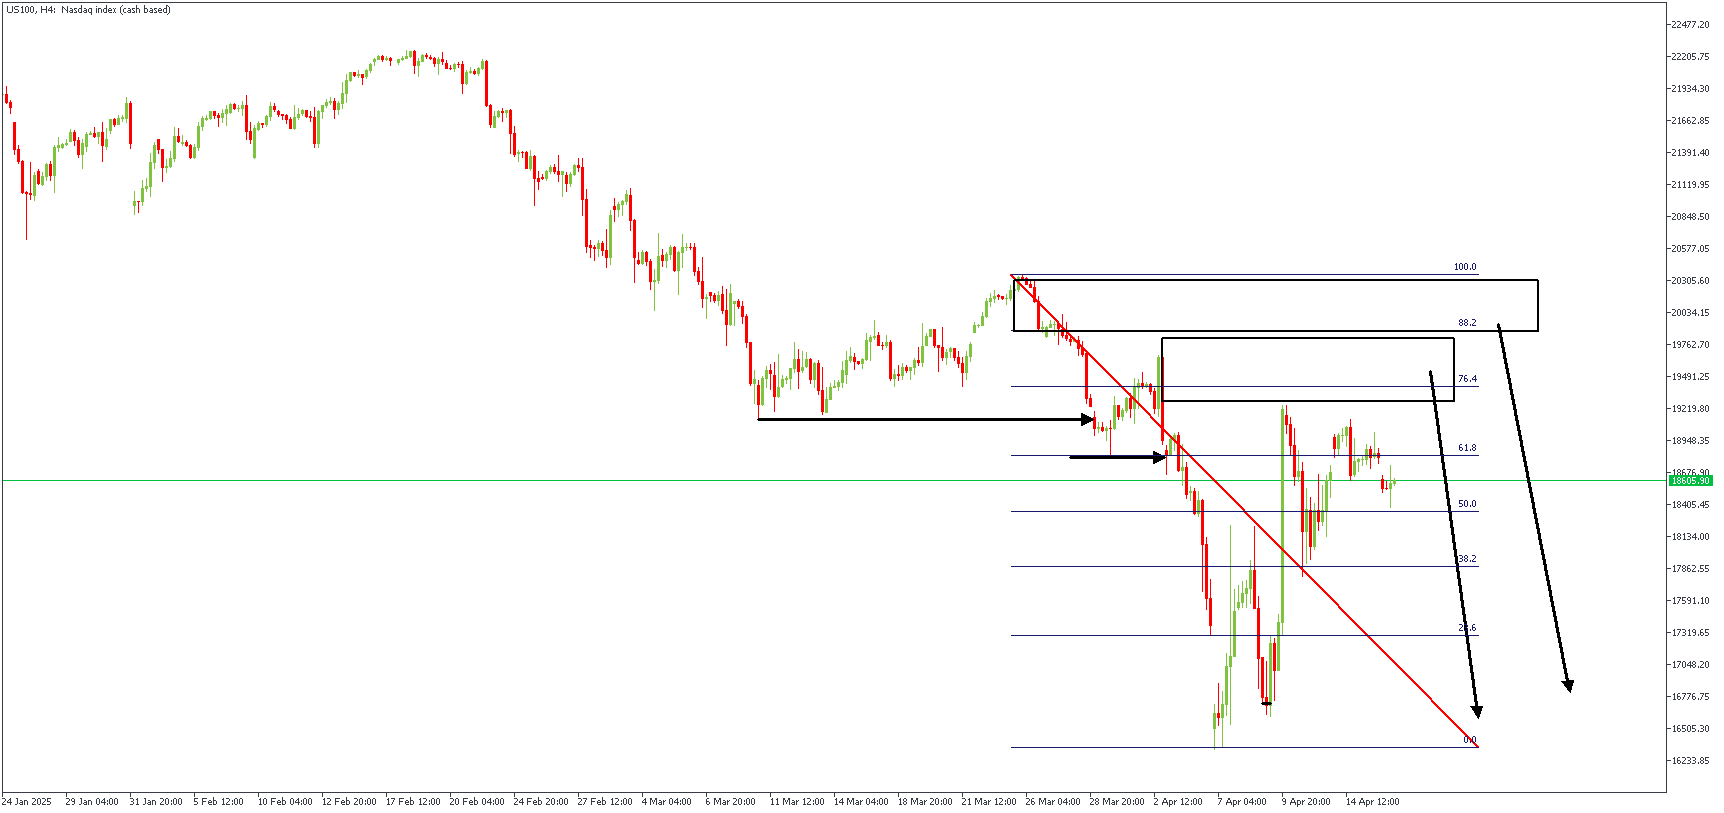
US100 – H4 Timeframe
On the 4-hour timeframe chart of US100, there is a hidden SBR pattern, with the supply zone at the pattern's peak fitting well into the 76% Fibonacci retracement area. The expectation here is the continuation of the bearish momentum following the rejection from the supply zone.
Analyst's Expectations:
- Direction: Bearish
- Target- 16301.67
- Invalidation- 20389.89
AUDCAD Wave Analysis
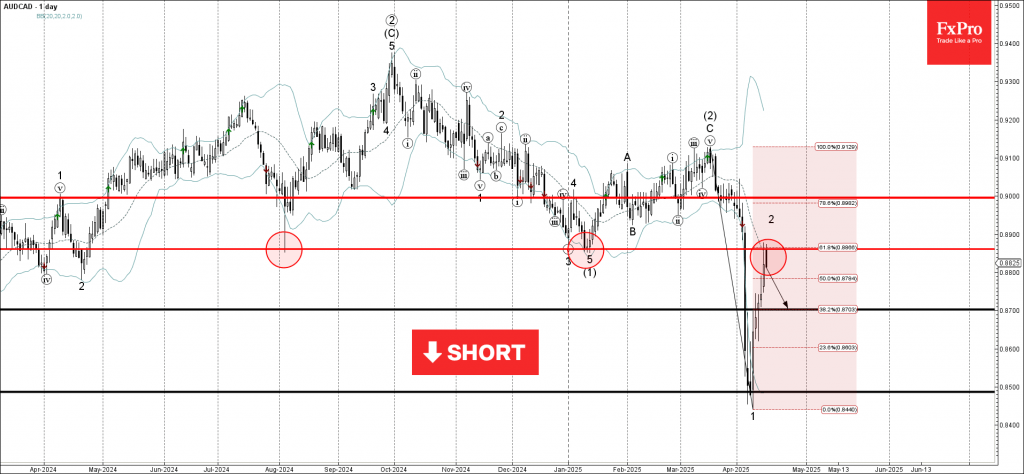
AUDCAD: ⬇️ Sell
- AUDCAD reversed from resistance zone
- Likely to fall to support level 0.8700
AUDCAD recently reversed down from the resistance zone between the resistance level 0.8860 (former support from August and January), 20-day moving average and the 61.8% Fibonacci correction of the downward impulse 1 from March.
The downward reversal from this resistance zone stopped the previous short-term correction 2 from the start of April.
Given the clear daily downtrend and the bearish Australian dollar sentiment, AUDCAD can be expected to fall to the next support level 0.8700.
GBPUSD Wave Analysis
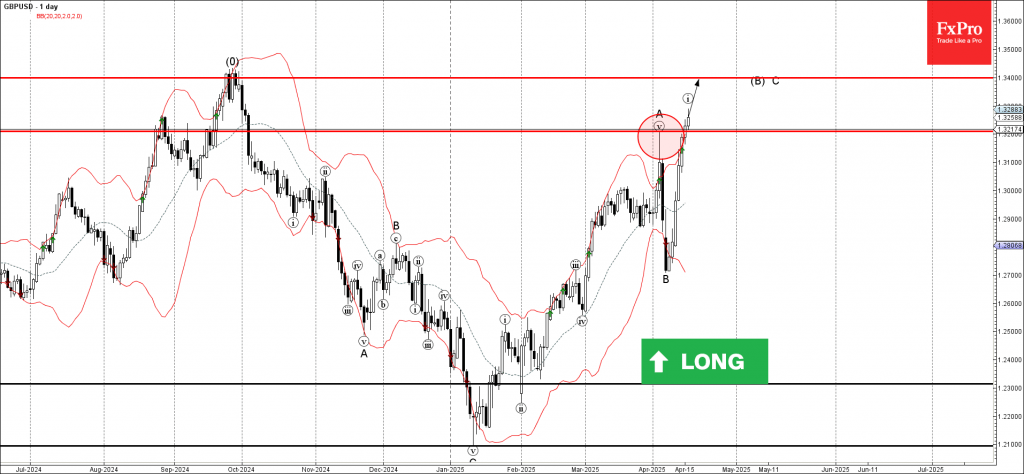
GBPUSD: ⬆️ Buy
- GBPUSD broke key resistance level 1.3200
- Likely to rise to the resistance level 1.3400
GBPUSD currency pair is rising sharply after the recent breakout of the key resistance level 1.3200, which stopped the previous minor impulse wave A at the start of April.
The breakout of the resistance level 1.3200 accelerated the active impulse waves i and C – which belong to wave (B) from January.
Given the bearish US dollar sentiment seen today coupled with sterling optimism, GBPUSD currency pair can be expected to rise to the next resistance level 1.3400 (target price for the completion of the active wave C).
Gold Wave Analysis
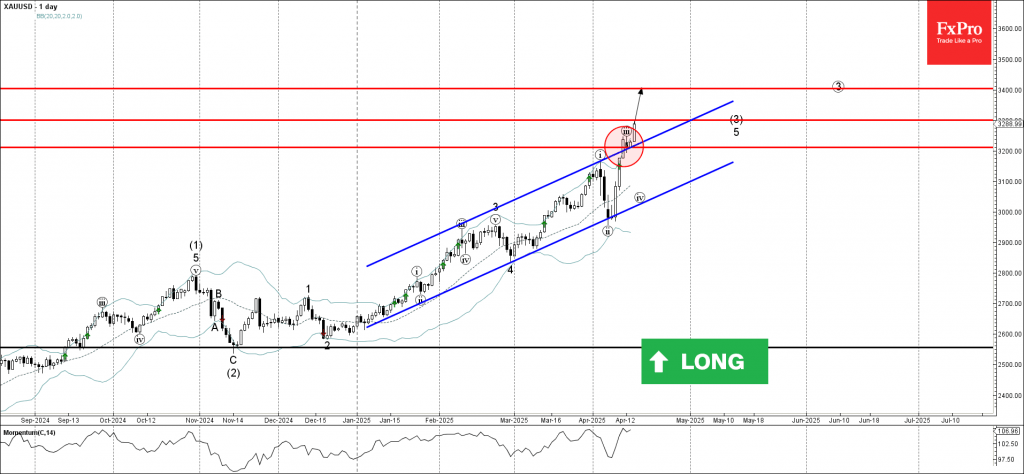
Gold: ⬆️ Buy
- Gold broke resistance zone
- Likely to rise to the resistance level 3300.00
Gold recently broke the resistance zone between the resistance level 3200.00 and the resistance trendline of the daily up channel from January.
The breakout of this resistance zone accelerated the active short-term impulse wave 3, which belongs to the intermediate impulse wave (3) from November.
Given the clear daily uptrend, Gold can be expected to rise to the next resistance level 3300.00, the breakout of which can lead to further gains toward 3400.00.
US Sales Jump Gives USD Relief, But Driven by Fears
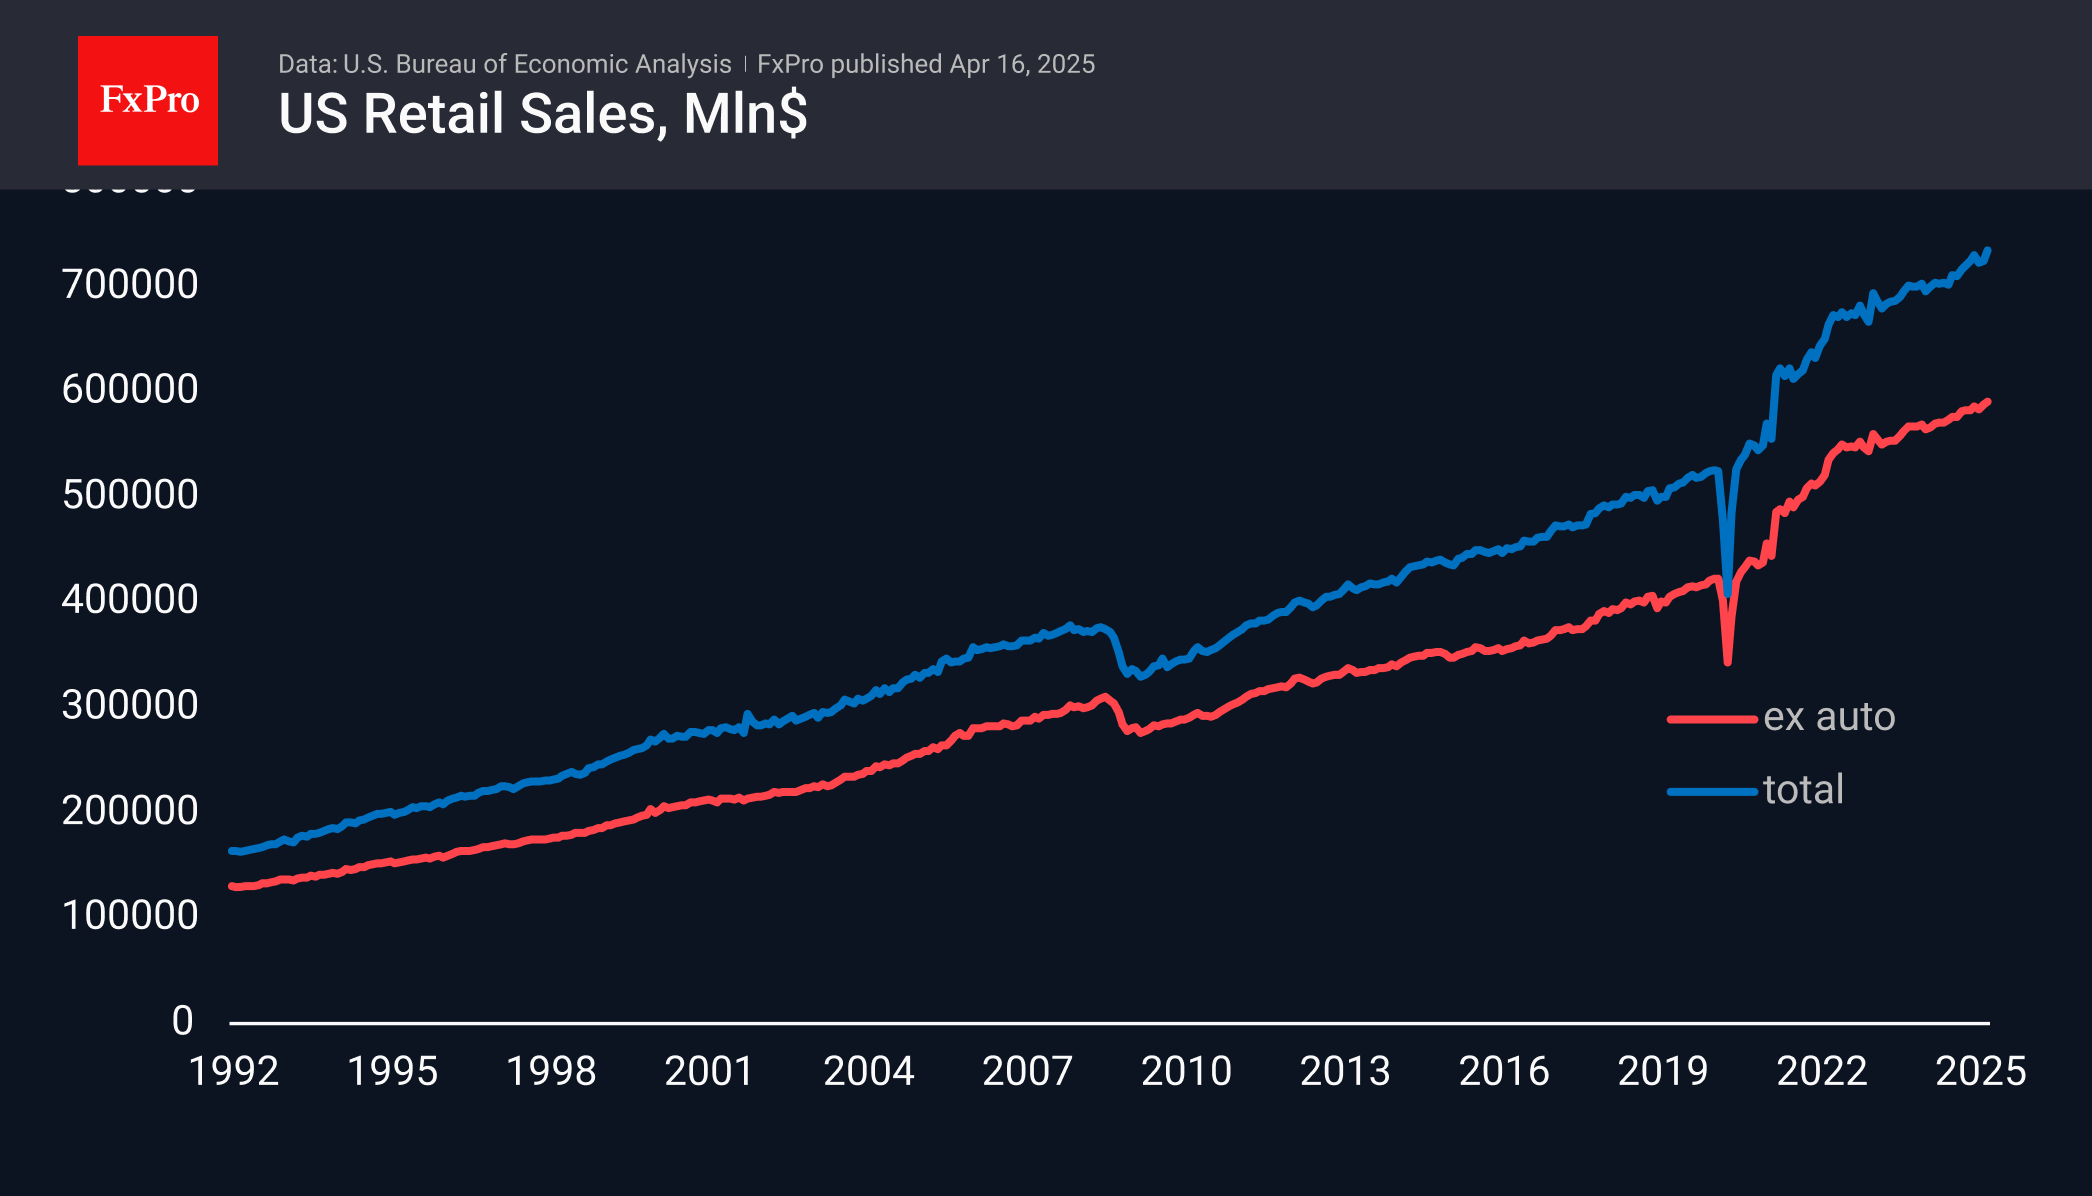
US total retail sales rose 1.4% in March, beating the expected 1.3% after rising 0.2% a month earlier. On an annualised basis, sales rose 4.4%, the fastest pace since December 2023, which contrasted with the slowdown in inflation to 2.4% y/y.
The acceleration in American spending can be attributed to a desire to stock up on goods ahead of a possible price hike triggered by the tariffs announced by Trump last month.
Fears of tariffs have fuelled inflation expectations and a frenzy of demand that could turn into a subsequent slump. The contribution of the automotive sector is particularly notable, where sales growth remains more modest at 0.5% and 0.7% in the previous two months.
While this news is unlikely to cause dramatic changes in markets and policy, it strengthens the position of the hawks at the Fed, who prefer to focus on inflation risks rather than threats to economic growth in the moment. This situation favours the dollar, which buyers could support as it slumps towards the lows of the past three years, giving it a respite after a 9% decline over the past nine weeks. However, the prospect of tighter monetary policy will be a negative factor for the stock market.
Bank of Canada Holds Rates Even as Tariffs Threaten the Economy
The Bank of Canada (BoC) held its policy rate at 2.75%, following seven straight announcements where the bank cut rates.
The bank's outlook recognized that the "economy is slowing as tariff announcements and uncertainty pull down consumer and business confidence. Consumption, residential investment and business spending all look to have weakened in the first quarter. Trade tensions are also disrupting recovery in the labour market."
The BoC also published its Monetary Policy Report (MPR), which instead of outlining its forecast, showed two scenarios for the economy depending on how tariff tensions unfold. One is a temporary shock that effectively flatlines the economy, but allows it to return to growth in the second half of 2025, and inflation remains around the 2% target. The other scenario is a prolonged trade war that sends the economy into a recession through the remainder of 2025, and inflation temporarily rises to 3%.
Regarding the future path of its policy rate, the bank stated that it will "proceed carefully, with particular attention to the risks and uncertainties facing the Canadian economy." The evolution of the trade war with the U.S. will determine if the BoC will resume cutting rates in the coming months.
Key Implications
In reading the interest rate announcement and MPR, one would have thought the BoC decided to cut rates today. It highlighted the downside risks to the economy, with both scenarios showing a level of weakness that is deserving of further rate cuts. And it's not just hypotheticals and sentiment surveys showing fragility. The real estate market has rolled over as Canadians grow more hesitant. This is also coming through in retail sales, while the March jobs report showed that firms are already trimming their workforce. Inflation also eased last month, which opened the door for rate cuts today, but the BoC decided not to walk through it.
Looking forward, the BoC is expected to cut further. Market pricing for a cut in June jumped today, with about 50 bps in cuts expected over the remainder of 2025. This makes sense to us. Canada may have received a lower effective tariff rate than other countries, but the damage has already been done. Canada's economy has started to show signs of weakness, which we think will continue over the coming months. This means the BoC should resume cutting rates at its next meeting on June 4th.
Tariff News and Resistance Zone Put Pressure on Crypto
Market Picture
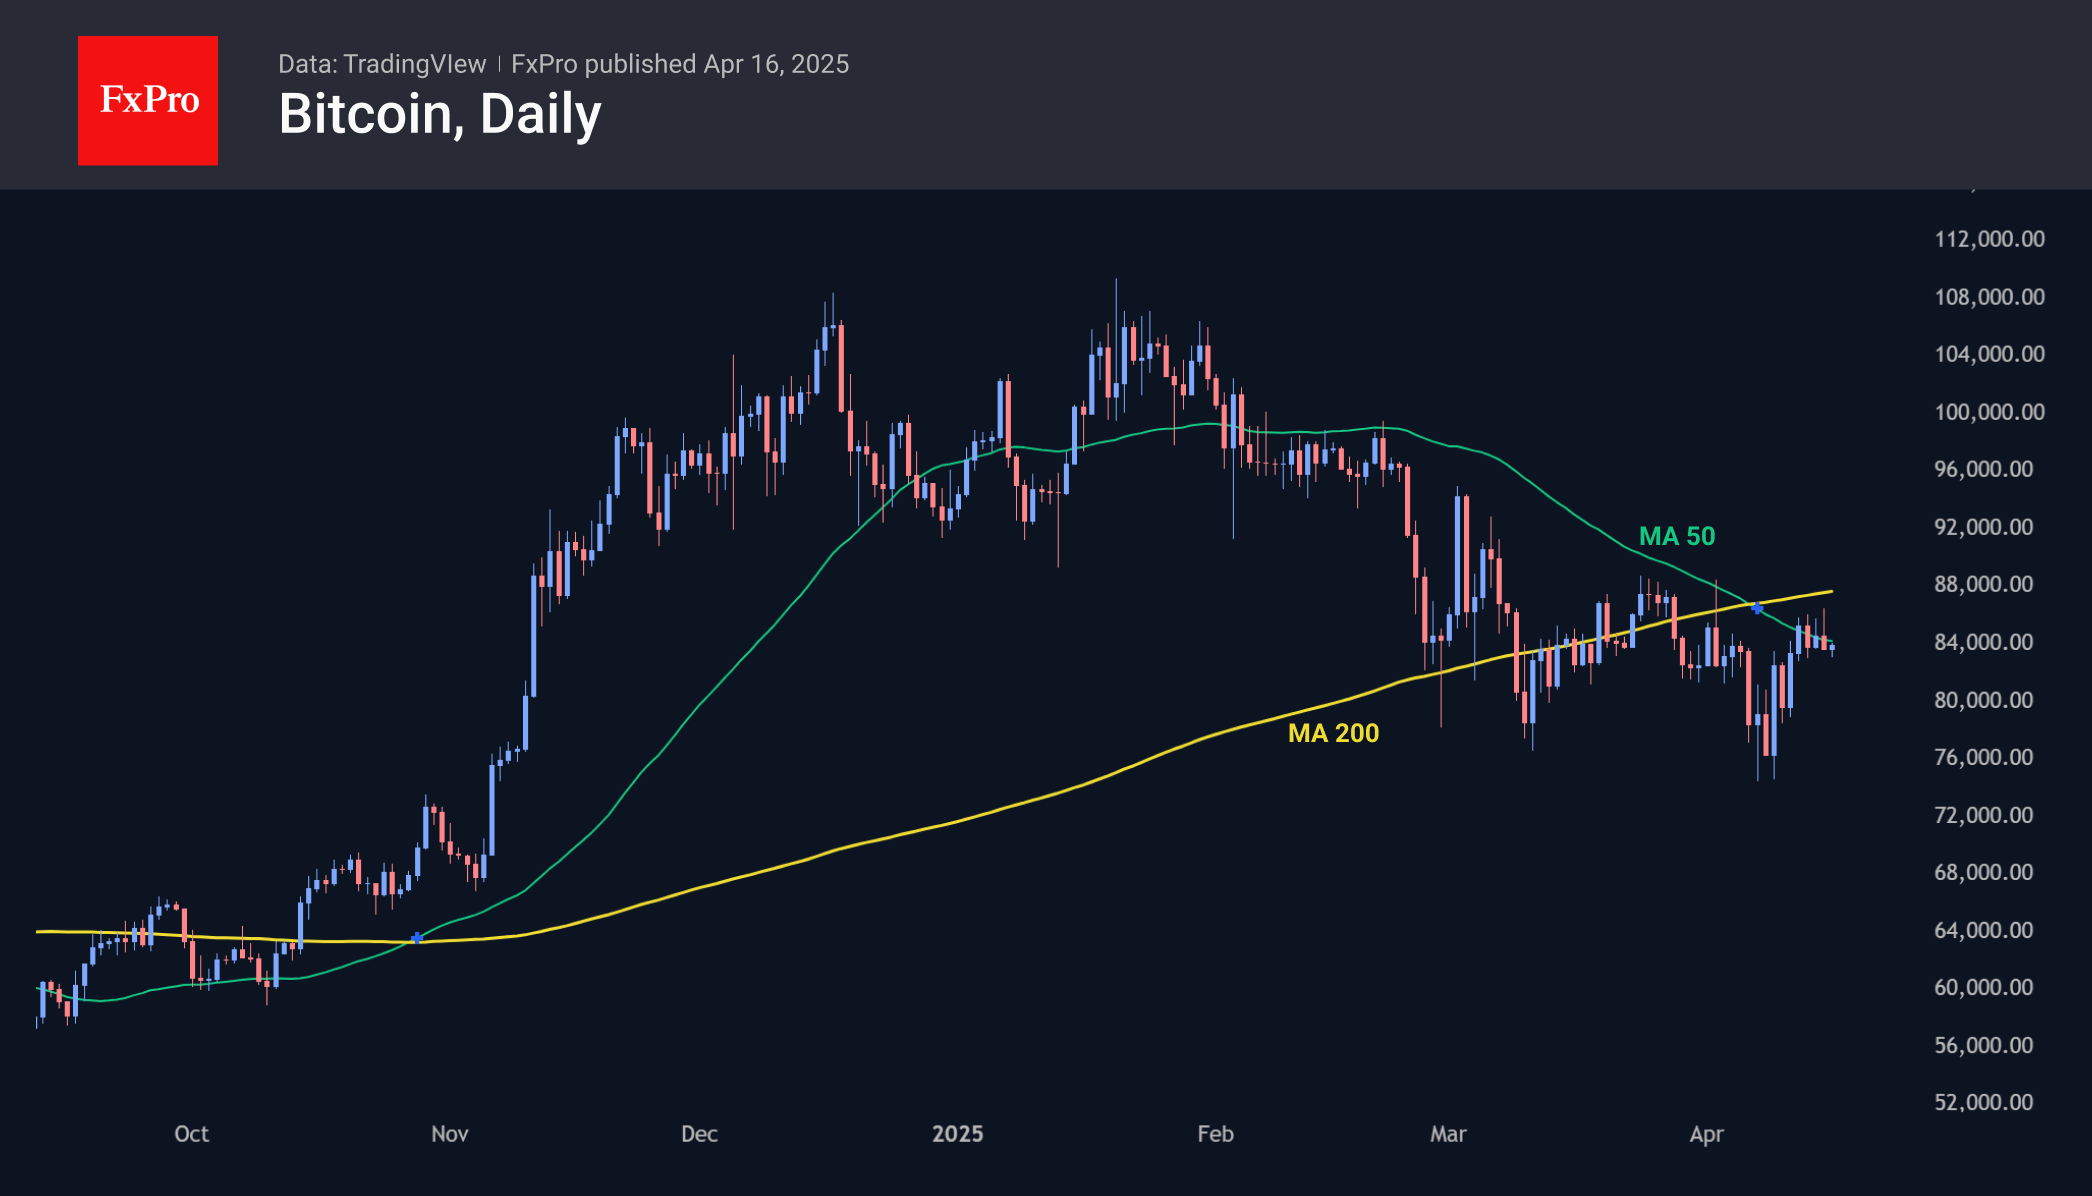
The crypto market capitalisation fell by 2.6% in the last 24 hours, dropping to $2.63 trillion. The selling pressure intensified amid announcements that the US may raise duties on Chinese goods to 245%. This news hit fertile ground as the market had already reached the levels of the last consolidation, and after the recent rebound, a correction was looming.
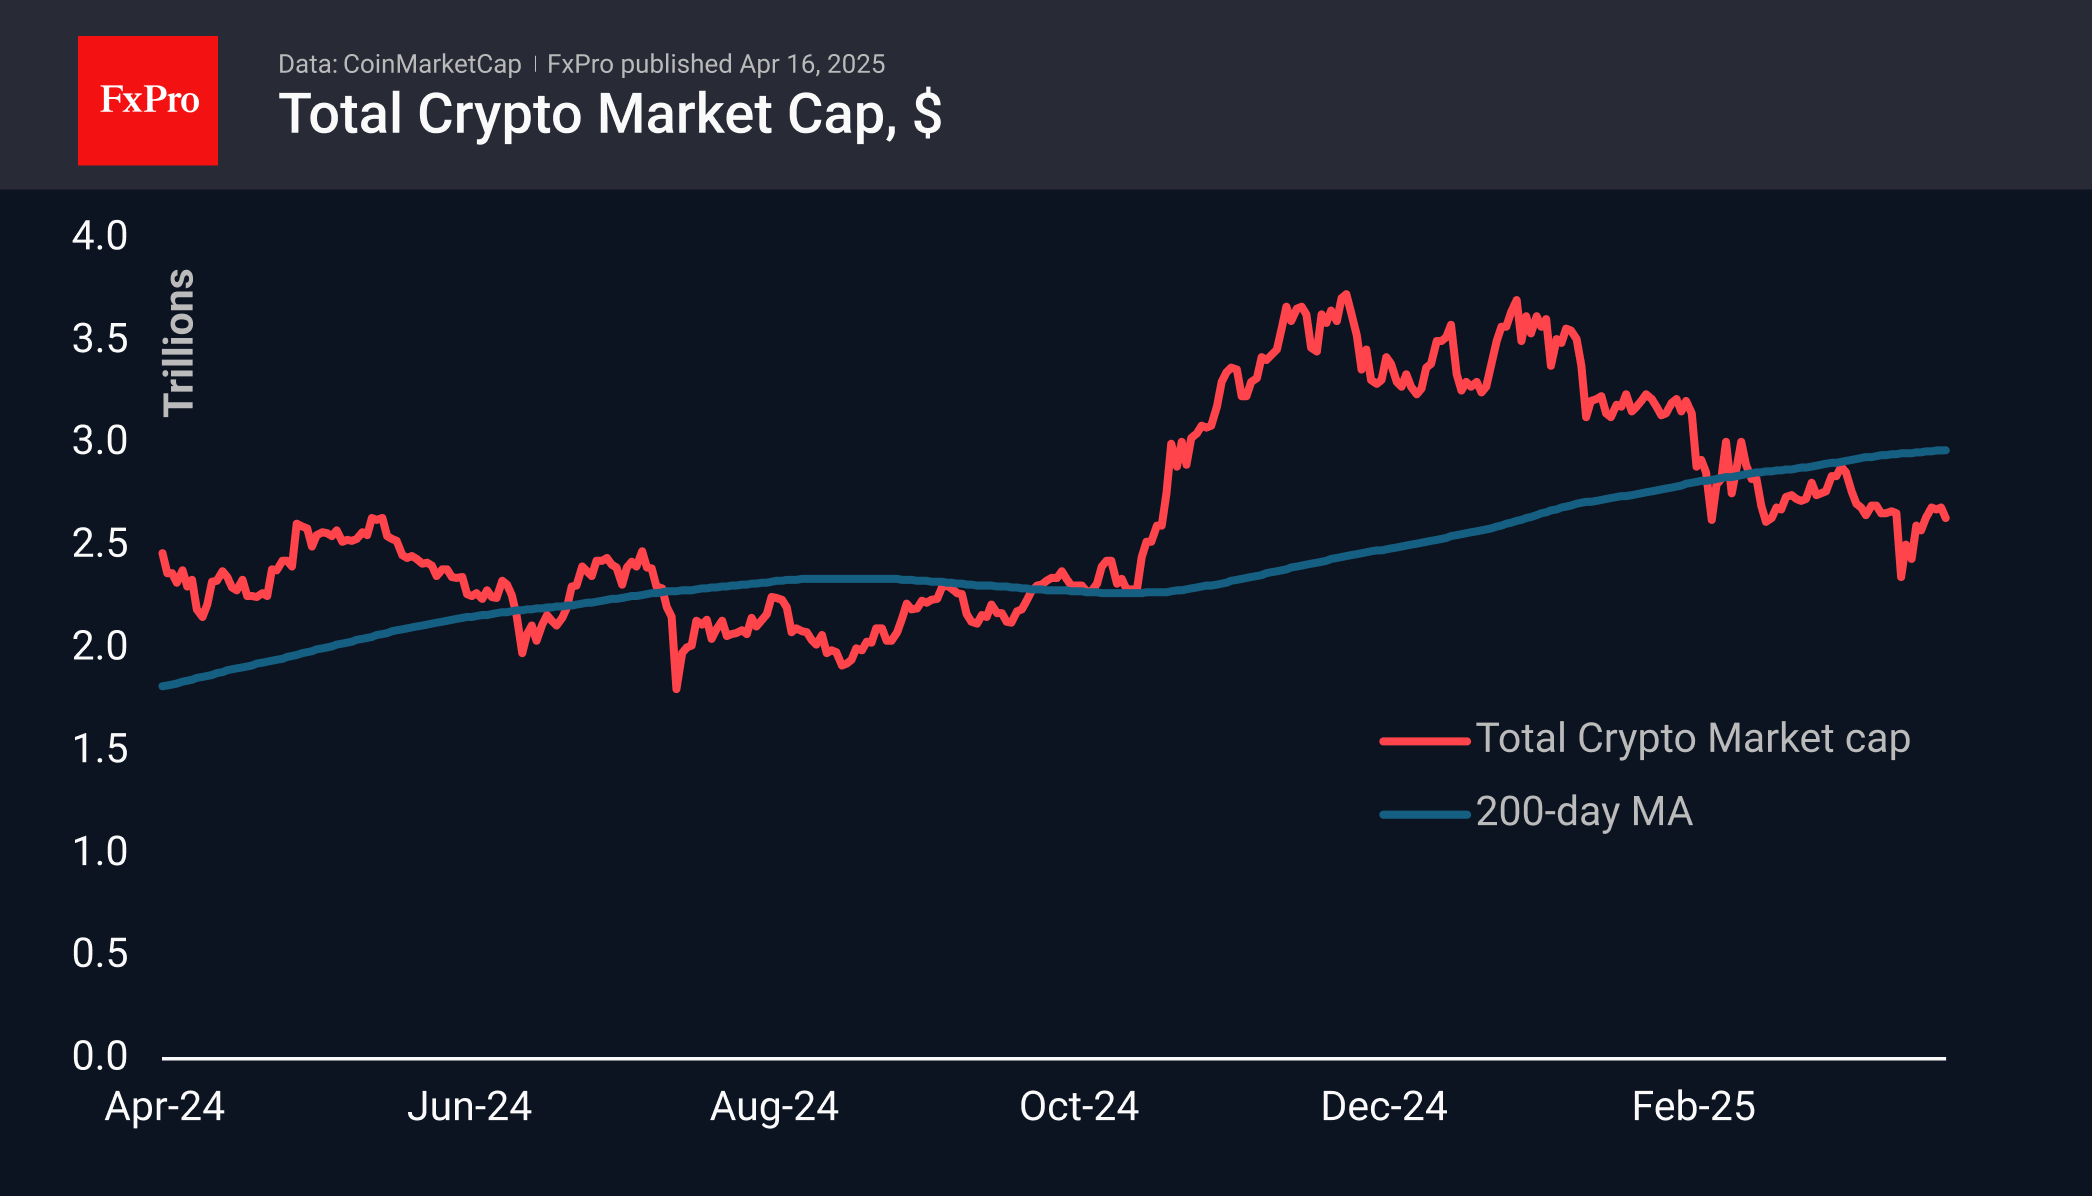
Bitcoin is losing with the market, facing resistance in the form of a cluster of 50- and 200-day moving averages. The importance of these levels suggests some pause in the move, but the chances of a rebound remain high. The low point in early April was more than 30% below historical peaks, making current levels attractive to long-term buyers.

News Background
MN Trading founder Michael van de Poppe notes the growth in money supply as measured by the M2 aggregate, which he believes could lead to Bitcoin updating its record high (ATH) this quarter. Macro analyst TomasOnMarkets adds that the amount of liquidity in the financial system has increased to $6.3 trillion, creating a favourable backdrop for BTC growth.
Bitcoin reserves of publicly traded companies increased 16% in Q1 to 688,000 BTC (~$56.7bn), Bitwise calculates. Over the three months, companies built up reserves by 95,431 BTC, and at least 12 public companies invested in bitcoin for the first time.
Canada is launching the world’s first spot Solana ETFs. The funds will offer a Solana staking feature, potentially providing higher returns than similar Ethereum-based products and lowering the ETF’s cost of ownership, TD Bank said.
Sunset Market Commentary
Markets
The calm is already over. It took two days for the trade conflict to return to the front pages and dominate trading again. It started with China banning Boeing jets, followed by EU officials returning from US trade talks without progress and ended with the US imposing additional export restrictions against chipmaker Nvidia & launching a probe into critical minerals. The latter often leads to the introduction of import tariffs. It culminated into European stocks opening with losses of up to 1.6%. Sentiment later improved abruptly thanks to Bloomberg reporting that China is open for trade talks, be it on certain conditions. They want the US to show more respect, have a consistent position and express willingness to address China’s concerns around American sanctions and Taiwan. We’ll leave it up to the reader to decide whichever is the hardest. We simply stick to the fact that talks, if any, won’t happen overnight. Chinese authorities a couple of hours later struck a more defiant tone again by the way, repeating it will “fight till the end” if its interests are harmed. Stocks nevertheless saw the bright side with the EuroStoxx50 paring losses to 0.6% currently. US stocks still open between 0.4 and 1.8% lower. The US dollar once again fails to benefit from the risk off environment in growing signs of the currency losing safe haven appeal to the likes of the euro. EUR/USD wipes out yesterday’s loss to trade around 1.135. The trade-weighted dollar index returns back sub 100, near the lowest level since mid-2023. The Swiss franc is today’s G10 outperformer. EUR/CHF revisits the 2024/multiyear lows. Sterling slips against most peers but the USD after March CPI numbers this morning basically cemented another quarterly Bank of England rate cut in May (from 4.5% to 4.25%). In fixed income German Bunds again outperform US Treasuries, snapping up the haven flows. German rates ease only slightly though with net daily changes varying between 1.1 and 2.7 bps across the curve. US yields lose a few bps at the front while adding some at the long end (risk premia).
The economic calendar today contained strong but broadly in line with consensus US retail sales. The headline figure printed 1.4% m/m, driven by a consumer rush to cars (+5.3% m/m) ahead of a 25% import tariff. 11 out of the 13 categories posted an increase, many of them for the same aforementioned reason (eg. sporting goods, electronics …). The gauge used in private consumption calculations for GDP rose by 0.4%, slightly below the expected 0.6% but with an upward revision to February (1.3% from 1%). The publication has little effect on markets ahead of a closely watched speech by Fed chair Powell later today. For most of his colleagues (except for Waller on Monday) inflation remains the number one priority and we expect Powell to hold that line as well. It could serve as a wake-up call for markets, who currently assume around 90 bps of cuts this year.
News & Views
News agency Reuters reports that the Bank of Japan will lower its growth outlook at the May 1 policy meeting as US tariffs heighten risks to the export-reliant economy. At the previous quarterly update, the BoJ projected 1.1% growth for fiscal 2025. The extent of the expected damage could depend on the outcome of bilateral negotiations which start today and which US President Trump will join in person. In an interview, BoJ governor Ueda this morning reiterated the BoJ’s dedication to raising rates at an appropriate pace, though he admitted that a policy response (pause?) may be required depending on the economic impact. When it comes to inflation, the tariff shock is expected to delay, but not derail, progress to sustainably hitting the 2% inflation target. Today’s risk aversion prompted a test of the YTD low in USD/JPY at 142.07, but a break, which opens the path to the 2024 low (139.58) was avoided for now.
The World Trade Organization (WTO) updated its trade forecasts. The temporary tariff pause mitigates the trade contraction, but strong downside risks persists. Under current conditions, the volume of world merchandise trade is likely to fall by 0.2% in 2025. The decline is expected to be particularly steep in North America, where exports are forecasted to drop by 12.6%. Chinese merchandise exports are projected to rise by 4% to 9% across all regions outside North America, as trade is redirected. In a worst case scenario (full impact reciprocal tariffs and spreading trade policy uncertainty), the global goods trade could decline by 1.5%. The volume of services trade is forecasted to grow by 4% in 2025.