Sample Category Title
EUR/CHF Daily Outlook
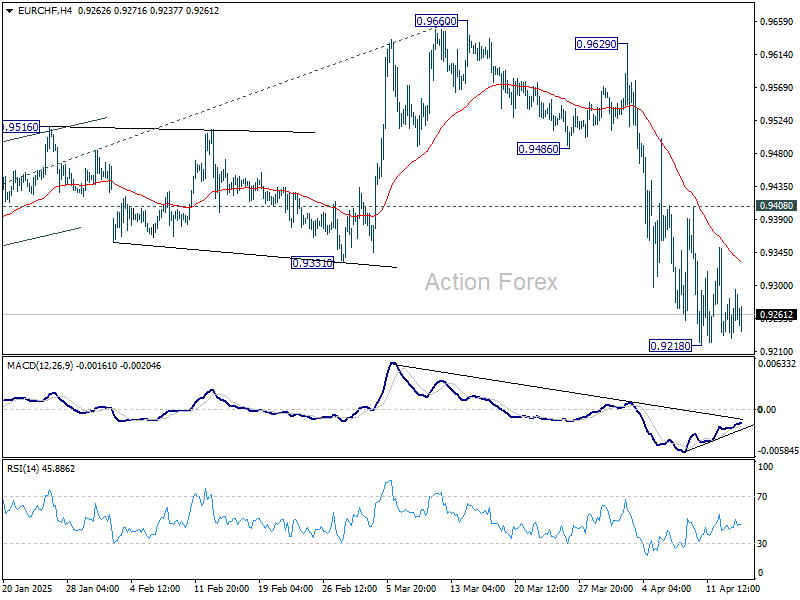
Daily Pivots: (S1) 0.9247; (P) 0.9272; (R1) 0.9314; More....
Intraday bias in EUR/CHF remains neutral and more consolidations could be seen above 0.9218. But outlook will remain bearish as long as 0.9408 resistance holds. On the downside, firm break of 0.9204 low will confirm larger down trend resumption.
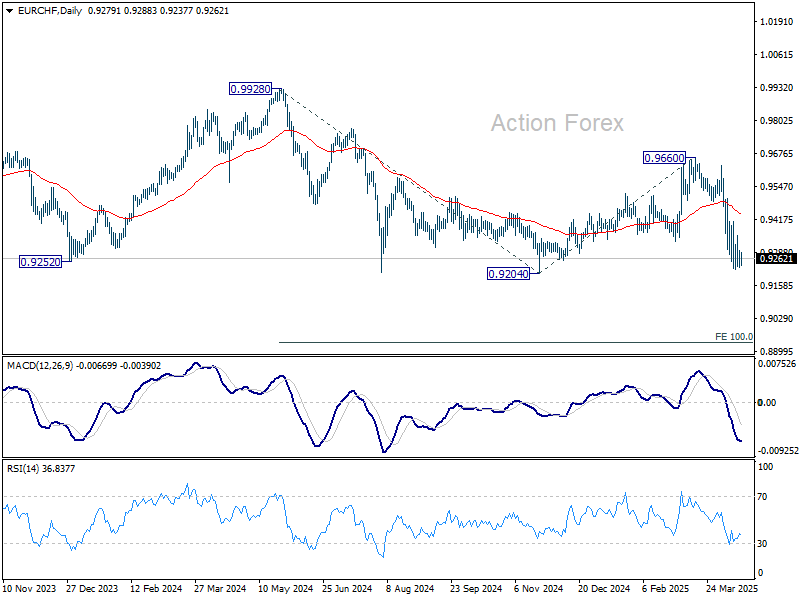
In the bigger picture, rejection by long-term falling channel resistance (now at 0.9600) retains medium term bearishness. That is, down trend from 1.2004 (2018 high) is still in progress. Firm break of 0.9204 (2024 low) will confirm resumption. Next target is 100% projection of 0.9928 to 0.9204 from 0.9660 at 0.8936.
Postcard from China – 10 Key Takeaways from Trip to China
On Sunday I came back from a week-long visit to China. And what a week it was. As the days passed, tariffs went higher and higher, stock markets tanked, recovered, then dropped and then recovered again. Not totally surprising, Trump blinked and hit the pause button on tariffs on all countries except China, but even by Friday he had exempted semiconductors and electronics in a sign he had overplayed his cards. As probably the only country, China has not called Trump asking for trade talks, and this came as no surprise to most people I talked to.
Meetings were with a mix of analysts, company managers, supply chain consultants, investors and old friends that have lived there for a long time. Apart from gauging the temperature on the trade war front, I was there to get a sense of sentiment on a range of issues, such as housing, China's tech advances and what people thought about the recent efforts to boost consumption. The trip took me to Beijing, Shanghai as well as Suzhou, another major city around 90km West of Shanghai. Below I have highlighted 10 key takeaways from my discussions in close to 20 meetings and presentations.
10 key takeaways
- #1: China prepared to fight
- #2: Stronger self-confidence
- #3: Highly disruptive effects short term
- #4: Stronger stimulus, but no devaluation
- #5: No consumer boycott, and Elon Musk still a hero
- #6: Apple and Tesla last in line to be hit(?)
- #7: European companies see both risks and opportunities
- #8: Housing confidence improved, but problem not solved
- #9: China’s fast tech development to continue
- #10: Lifting consumption is a major task
Will US Retail Sales Show Consumers Retreating?
In focus today and over the holidays
Today the US March retail sales and industrial production data is due for release in the afternoon. Markets will pay extremely close attention to especially retail sales, which provides hard evidence of how consumer behaviour has evolved after Trump's tariffs began to take effect. Keep in mind that the data has been collected before the 'Liberation Day' announcements. In the evening, the Fed chair Powell is scheduled to speak at the Economic Club of Chicago at 19.30CET.
From the euro area, we receive the final March inflation data. We expect the data to confirm the flash release, leading to no market reaction as focus has shifted from inflation towards growth concerns and the trade war.
UK CPI is also being released bringing in inflation data for March. Consensus expects a drop in both headline to 2.7% y/y from 2.8% y/y, core to 3.4% y/y from 3.5% y/y and service inflation to 4.8% y/y from 5.0% y/y. If consensus estimates hold, the Bank of England should stay on track to ease monetary policy at its next meeting in May.
The Bank of Canada meeting takes place today at 15:45 CEST. Markets and consensus are leaning towards an unchanged rate decision, with markets pricing in approximately 9bp of cuts. We project that the BoC will deliver a 25bp rate cut, bringing the policy rate to 2.50%. Tariff uncertainty remains elevated and is slowly passing through to soft data, as evidenced, by the relatively downbeat Q1 Canadian business and consumer sentiment reports - supporting the case for a rate cut.
On Thursday, all eyes are on the ECB meeting, where we expect the ECB to cut the policy rate by 25bp to 2.25%, in line with market pricing and consensus. We expect the statement to repeat "monetary policy is becoming meaningfully less restrictive" and Lagarde to highlight the downside risks to growth from the trade war while abstaining from giving any clear guidance on future rate decisions. We expect Lagarde to communicate that the ECB is ready to use all instruments if financial market turmoil increases but currently do not see signs of markets not working in orderly fashion. Going forward, we expect the ECB to deliver three 25bp cuts at the upcoming meetings, bringing the deposit rate to 1.50% by September 2025.
Economic and market news
What happened overnight
In China, quarterly GDP data printed at a very strong level of 5.4% y/y over consensus expectations of 5.1% y/y. Both industrial output at 7.7% y/y and retail sales at 5.9% y/y also significantly exceeded expectations showing significant increases in domestic consumption. However, we are now in Q2 and looking ahead Chinese growth is bound to take a big hit from the massive increase in US tariffs, which is set to lead to a nosedive in exports and also GDP.
What happened yesterday
In the euro area, the ECB Bank Lending Survey pointed to continued stabilising lending conditions following gradual improvements over the past years and balance is to the dovish side. Banks noted an additional tightening of credit standards for companies while also noting a more muted demand for loans. Likewise, risk perceptions and credit quality deterioration continues to weigh on lending to firms and consumers. Credit growth remains muted and combined with the negative impact from the trade war, this should keep ECB on track to deliver further easing. Please note the survey was conducted before Liberation Day.
In Germany, optimism about the economy has waned amid trade war uncertainties. The ZEW Economic Sentiment Index fell sharply to -14.0 in April from 51.6 in March, marking the lowest since summer 2023. Despite a slight improvement in current economic conditions, they remain low at -81.2 (cons: -86.8). Trade tensions, especially with the US and China, significantly impact Germany, with the automotive industry facing a 25% tariff in the US.
In the UK, the labour market report for February/March was fairly in line with expectations with a slight tilt to the soft side. Unemployment rate remains unchanged at 4.4% as expected. Wage growth excluding bonuses was lower than expected at 5.9% for both the whole economy and the private sector with downward revisions for the previous month. Payrolls for March dropped by 78k, with a downward revision of 8k for February. This should keep the BoE set to deliver its next cut in May in line with our expectations.
In Sweden, the spring budget bill was an expected non-event, as most of its contents had already been pre-announced. The additional spending of SEK 11.5 billion is about 0.2% of GDP, but it should be added to the SEK 60 billion announced in September last year for 2025. The new proposals in the spring budget (announced back in March) centre around an extended tax cut for home renovations, which is rather narrow in terms of target group. The spring bill also comes in the context of increased defence spending, which will be formalised for the upcoming autumn bill and will, in our view, result in an upward revision of the borrowing requirement when the Debt Office presents a new borrowing forecast in May.
Equities: Global equities edged slightly higher yesterday, although the real headline was Europe outperforming the U.S. by over 1 percentage point. European markets closed broadly higher, while most major U.S. indices ended the day flat or marginally down. Cyclicals slightly outperformed defensives, and the VIX remains elevated around 30.
In the U.S. yesterday, the Dow declined by 0.4%, the S&P 500 by 0.2%, the Nasdaq by 0.1%, and the Russell 2000 rose by 0.1%.
This morning, Asian markets are trading lower, led by a sharp 2.5% drop in Hong Kong. This comes despite stronger-than-expected Chinese macro data, as industrial production, retail sales, and GDP all surpassed forecasts, with GDP coming in at 5.4% year-on-year.
Futures in both the U.S. and Europe are pointing lower this morning. U.S. tech futures are under particular pressure after Nvidia warned of a $5.5 billion write-down this quarter, citing repercussions from the ongoing trade war.
FI&FX: In an otherwise relatively quiet week so far, EUR/USD slipped below 1.13 as the broad USD paused its five-day slide and Treasury bonds climbed, after Treasury Secretary Scott Bessent downplayed the recent sell-off. Risk-on sentiment in markets provided support for European yields during yesterday's session, leading to a bearish steepening of the German curve. Positive market sentiment and equities tracking higher further supported GBP FX ahead of the release of UK CPI this morning.
Don’t Expect Powell to Cave to Market Expectations of Growth-Supporting Rate Cuts
Markets
The first two sessions of the trading-shortened Easter week developed orderly, with markets recovering somewhat from last week’s mayhem. News flow of the last 24 hours or so suggests that the risk rebound will face a tough test. Markets initially seemed to turn a blind eye to them, until the Trump administration extended the list of export controls to Nvidia’s tailormade H20 chips for China in another escalation of the trade conflict between the US and China. Other worrying headlines included US probes into semiconductor, pharmaceutical and possibly critical minerals imports which are a prelude of more sectoral tariffs, China ordering airlines not to take further deliveries of Boeing jets, rumours on scant progress being made in trade talks between the EU and the US and disappointing Q1 ASML earnings. The negative trade headlines start to outweigh the reprieve coming from the 90-day pause in reciprocal tariffs and from some product exemptions (eg certain electronics or car parts). Asian stock markets dive 1% to 2% lower this morning with European and US equity futures also spelling trouble ahead. In last week’s market sell-off, German Bunds significantly outperformed US Treasuries. We expect those dynamics to hold as investors come to terms with higher US risk premia. In the same vein, we stick to our positive view for EUR/USD. In yesterday’s vacuum, the pair tested last week’s broken resistance (now turned into support) at 1.1274/76. That level held with the pair currently changing hands around 1.1370. The Japanese yen outperforms this morning with USD/JPY testing the YTD low this morning just above 142. The Swiss franc is also heading back to the EUR/CHF 0.9220/10 support area.
Today’s eco calendar contains March US retail sales and industrial production figures, together with a $13bn 20-yr US bond auction and a keynote speech by Fed Chair Powell on the economic outlook. Especially the latter could hurt sentiment further as we don’t expect Powell to cave to market expectations of growth-supporting rate cuts, sticking to the anti-inflation line instead. US Treasuries could in such scenario lose new ground. This morning’s UK inflation numbers (March) were slightly lower than feared (0.3% M/M & 3.4% Y/Y for headline; core CPI 3.4% Y/Y; services CPI 4.7% Y/Y) and suggest that the BoE for now can stick to its quarterly cutting pace in May. EUR/GBP rises from 0.8525 to 0.8570 this morning.
News & Views
China’s economy expanded by 1.2% q/q and 5.4% year-over-year in the first quarter of 2025. The solid growth was supported in part by frontloading exports before widely expected tariffs kicked in. In the accompanying monthly data set, industrial production for example quickened sharply in March to 7.7% y/y. Retail sales also accelerated and more than expected. The 5.9% in March was the fastest pace since December 2023. Since US president Trump’s Liberation Day, however, circumstances dramatically changed and makes repeated solid expansions increasingly difficult. China’s statistics bureau noted that “the external environment is becoming more complex and severe, the drive for growth of effective domestic demand is insufficient, and the foundation for sustained economic recovery and growth is yet to be consolidated.” Calls on the government for additional fiscal stimulus will likely continue ahead of the Politburo meeting end of April. China’s yuan this morning shrugs at the decent but outdated GDP numbers and is caught in the broader risk off move. USD/CNY jumps to 7.327.
Hungary’s freshly appointed central bank deputy governor Kurali vowed to conduct an orthodox monetary policy during his confirmation hearing before parliament yesterday. “In the current economic environment, we need an interest rate policy that can guarantee price stability in tandem with financial and market stability.” He said the central bank needs to maintain a positive real interest rate to have inflation slowing down to the 3% +/- 1 ppt target range. The central bank’s policy rate today stands at 6.5% compared with 4.7% inflation (March). Kurali also noted the government needs to reduce deficits and debt in order to have sustained economic growth. Rating agency S&P last week downgraded Hungary’s rating outlook to negative from stable over fiscal concerns after PM Orban ramped up pre-election spending. Hungary’s rating is just one notch above junk (BBB-). The Hungarian forint appreciated after Kurali’s comments but continues to trade at weak levels around EUR/HUF 408.
EUR/USD Daily Outlook
Daily Pivots: (S1) 1.1238; (P) 1.1308; (R1) 1.1353; More...
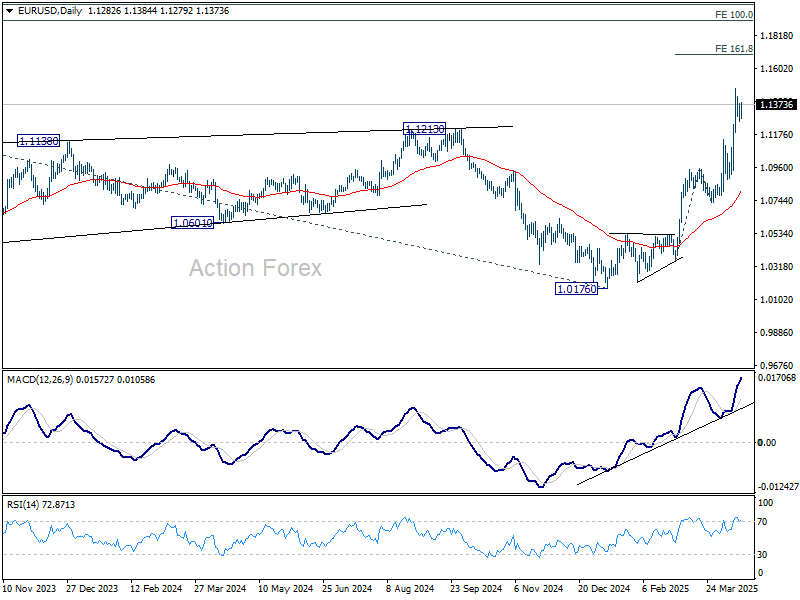
Intraday bias in EUR/USD remains neutral for the moment. More consolidations could be seen below 1.1472 and deeper pullback cannot be ruled out. But downside should be contained by 1.1145 resistance turned support to bring another rally. On the upside, break of 1.1472 will target 161.8% projection of 1.0358 to 1.0953 from 1.0731 at 1.1694.
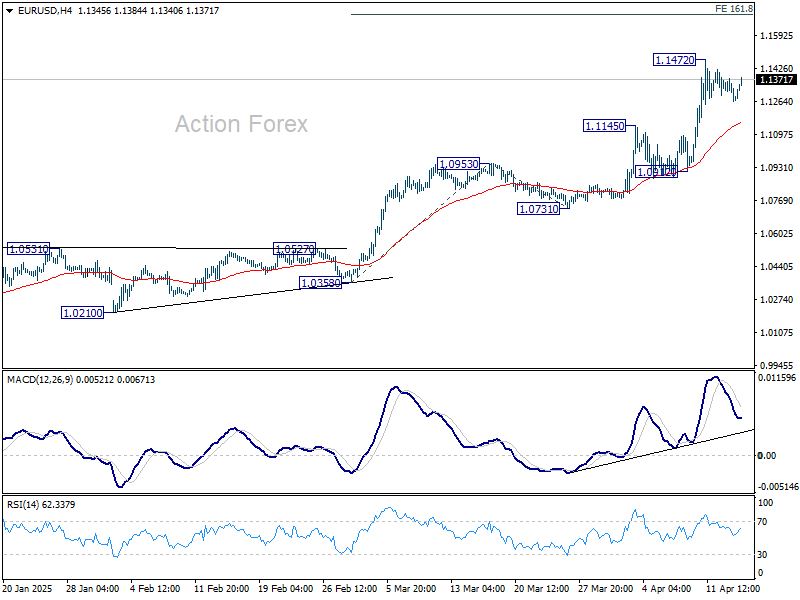
In the bigger picture, rise from 0.9534 long term bottom could be correcting the multi-decade downtrend or the start of a long term up trend. In either case, further rise should be seen to 100% projection of 0.9534 to 1.1274 from 1.0176 at 1.1916. This will now remain the favored case as long as 55 W EMA (now at 1.0745) holds.
USD/JPY Daily Outlook
Daily Pivots: (S1) 142.71; (P) 143.15; (R1) 143.70; More...
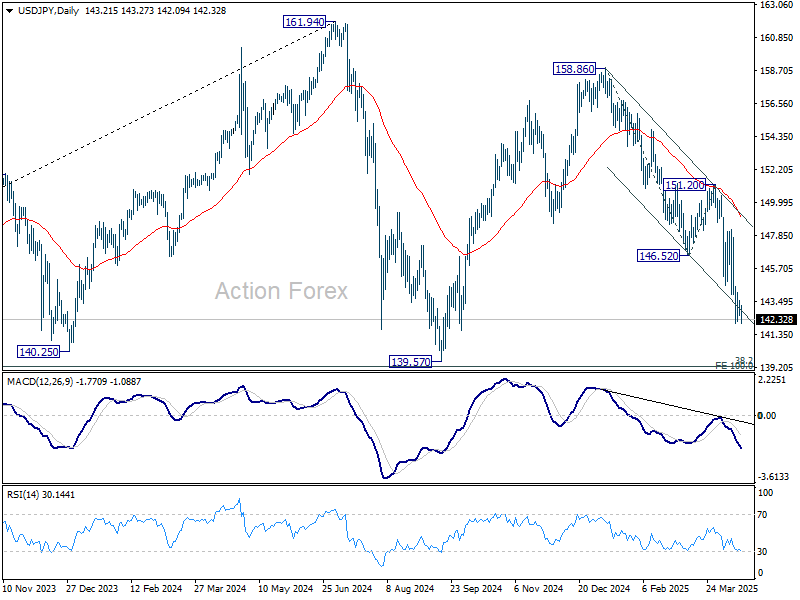
Intraday bias in USD/JPY remains neutral as consolidations continue above 142.05 temporary low. Stronger recovery might be seen but outlook will stay bearish as long as 151.20 resistance holds. Below 142.05 will resume the fall from 158.86 to 139.57 support.
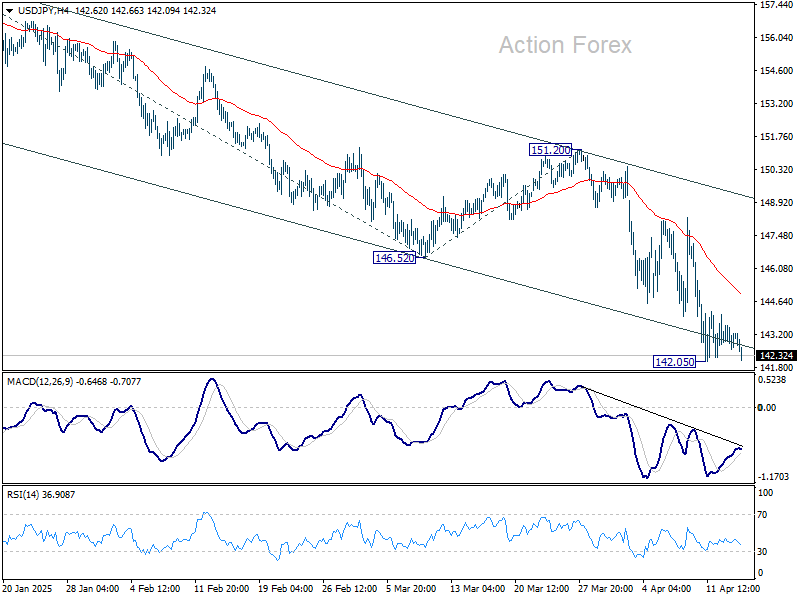
In the bigger picture, price actions from 161.94 are seen as a corrective pattern to rise from 102.58 (2021 low), with fall from 158.86 as the third leg. Strong support should be seen from 38.2% retracement of 102.58 to 161.94 at 139.26 to bring rebound. However, sustained break of 139.26 would open up deeper medium term decline to 61.8% retracement at 125.25.
GBP/USD Daily Outlook
Daily Pivots: (S1) 1.3180; (P) 1.3216; (R1) 1.3268; More...
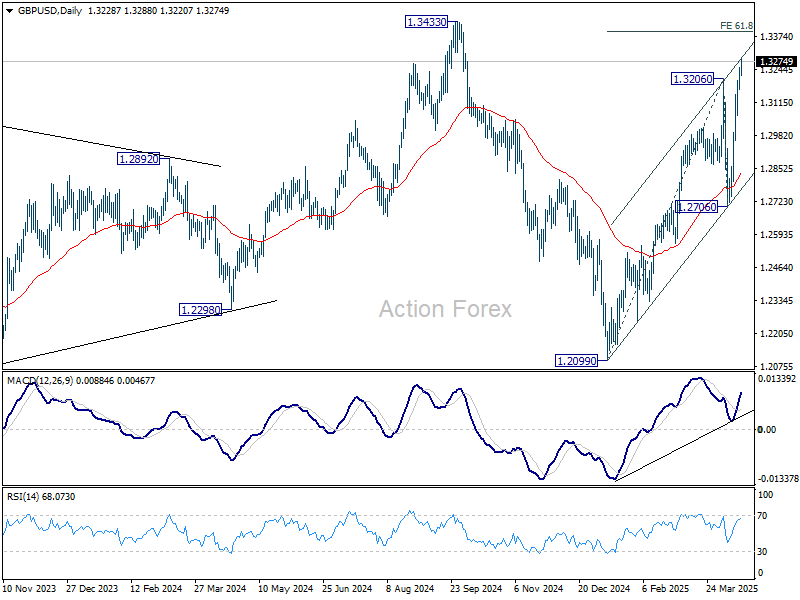
Intraday bias in GBP/USD remains on the upside for the moment. Current rise from 12099 should target 61.8% projection of 1.2099 to 1.3206 from 1.2706 at 1.3390, and possibly further to 1.3433 high. On the downside, below 1.3121 minor support will turn intraday bias neutral first. But overall near term outlook will stay bullish as long as 1.2706 support holds.
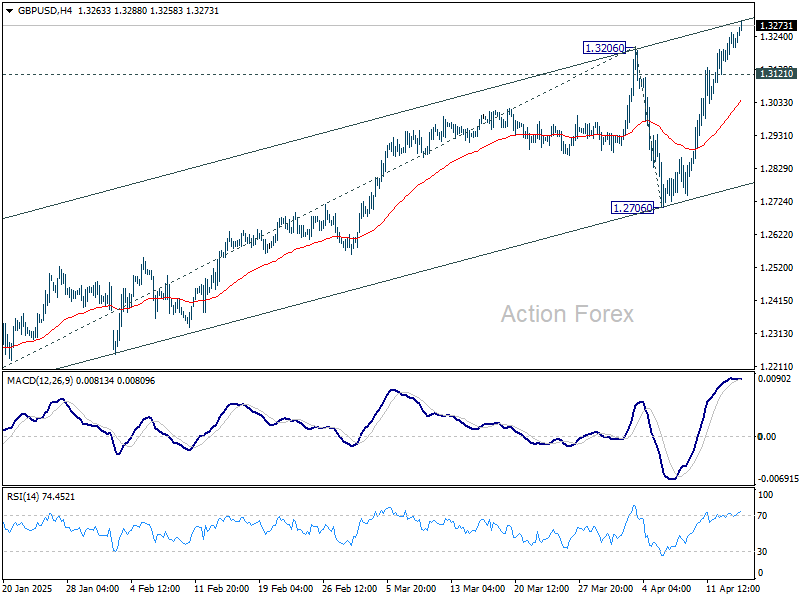
In the bigger picture, price actions from 1.3433 are seen as a corrective pattern to the up trend from 1.3051 (2022 low). Rise from 1.2099 could be the second leg. Overall, GBP/USD should target 1.4248 key resistance (2021 high) on break of 1.3433 at a later stage.
USD/CHF Daily Outlook
Daily Pivots: (S1) 0.8163; (P) 0.8201; (R1) 0.8273; More…
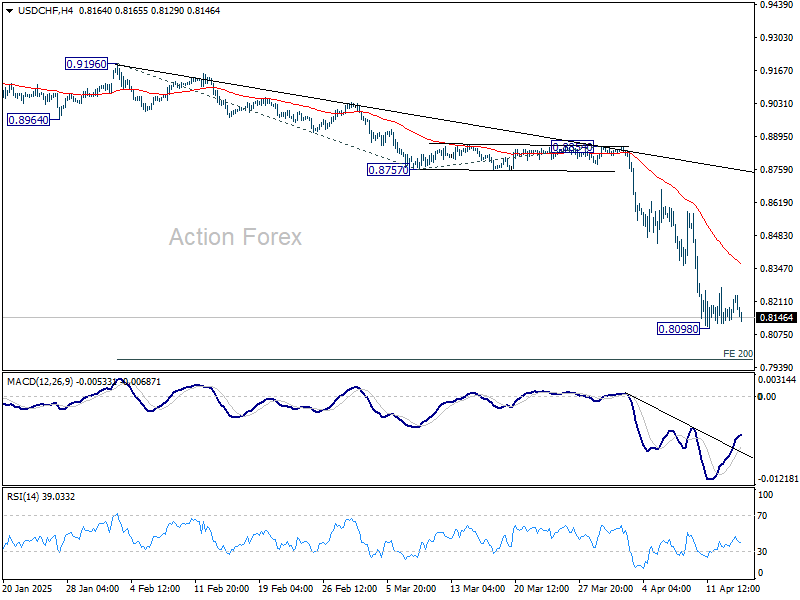
Intraday bias in USD/CHF remains neutral for consolidations above 0.8098 temporary low. While stronger rise might be seen, upside should be limited by 55 4H EMA (now at 0.8363) to bring another fall. On the downside, break of 0.8098 will resume recent down trend to 200% projection of 0.9196 to 0.8757 from 0.8854 at 0.7976 next.
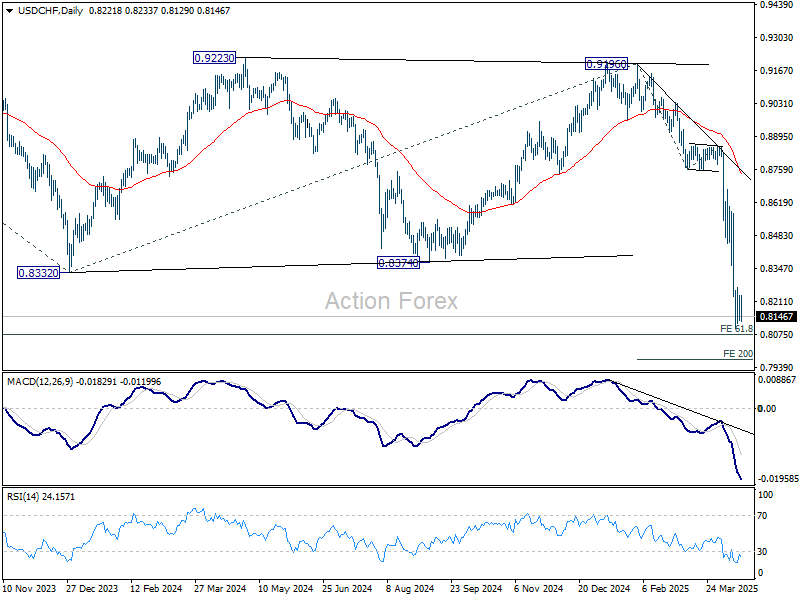
In the bigger picture, the break of 0.8332 (2023 low) confirms resumption of long term down trend from 1.0342 (2017 high). Next target is 61.8% projection of 1.0146 (2022 high) to 0.8332 from 0.9196 at 0.8075. Firm break there will target 100% projection at 0.7382.
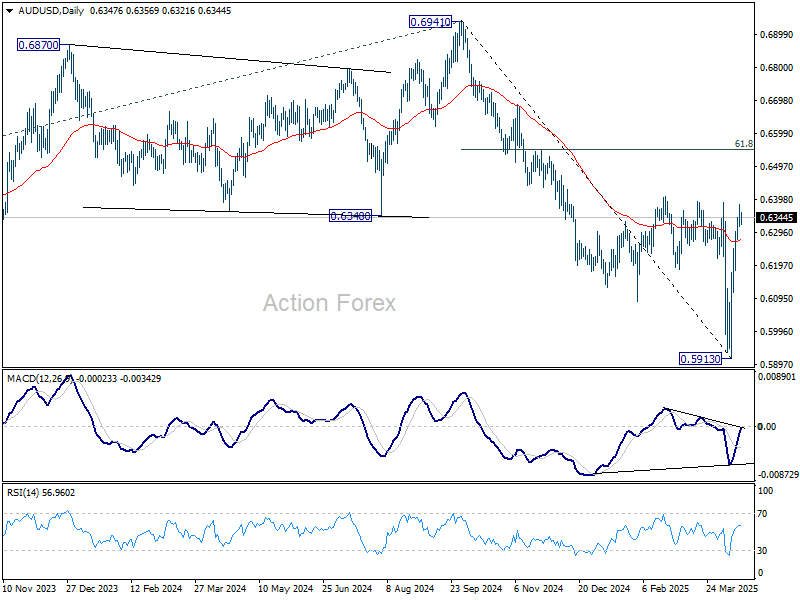
AUD/USD Daily Report
Daily Pivots: (S1) 0.6313; (P) 0.6348; (R1) 0.6380; More...
Intraday bias in AUD/USD is turned neutral first with current retreat. Further rally is expected as long as 55 4H EMA (now at 0.6239) holds. Firm break of 0.6407 resistance will extend the rise from 0.5913 to 61.8% retracement of 0.6941 to 0.5913 at 0.6548, even still as a corrective move.
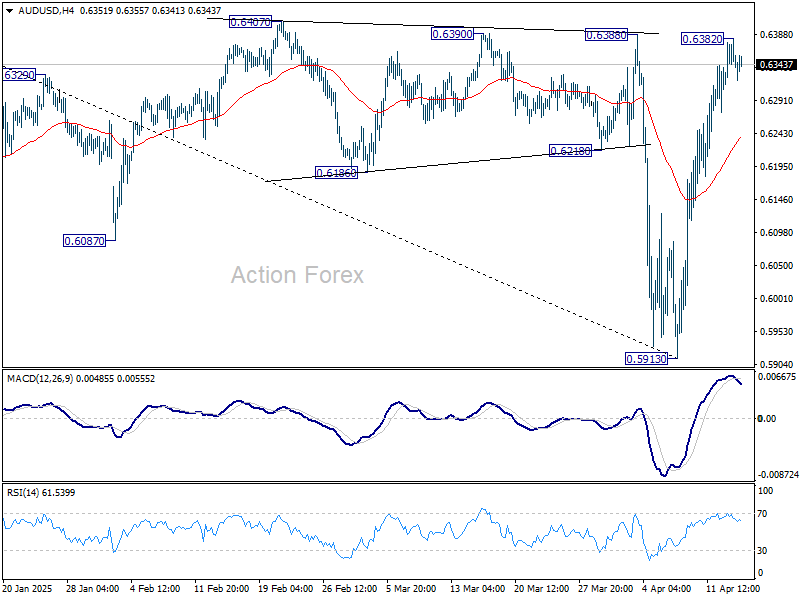
In the bigger picture, fall from 0.6941 (2024 high) is seen as part of the down trend from 0.8006 (2021 high). Next medium term target is 61.8% projection of 0.8006 to 0.6169 from 0.6941 at 0.5806. However, sustained trading above 55 W EMA (now at 0.6441) will argue that a medium term bottom was already formed, and set up further rebound to 0.6941 resistance instead.
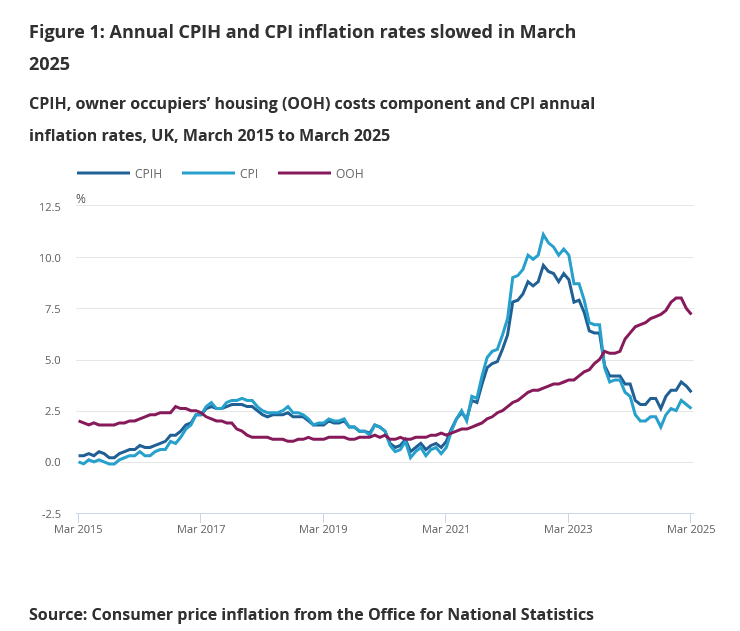
UK CPI falls to 2.6%, both goods and services inflation ease
UK consumer inflation continued to ease in March, with headline CPI slowing to 2.6% yoy, slightly below the expected 2.7% and down from 2.8% yoy in February. On a monthly basis, prices rose 0.3%, also under consensus 0.4% mom forecast.
The decline was broad-based, with annual goods inflation falling to 0.6% yoy from 0.8% yoy and services inflation easing to 4.7% yoy from 5.0% yoy.
Core CPI (excluding energy, food, alcohol and tobacco) edged down to 3.4% as expected, from 3.5% previously.