Sample Category Title
Elliott Wave Outlook Confirms That GBPUSD Has Resumed Its Upward Move
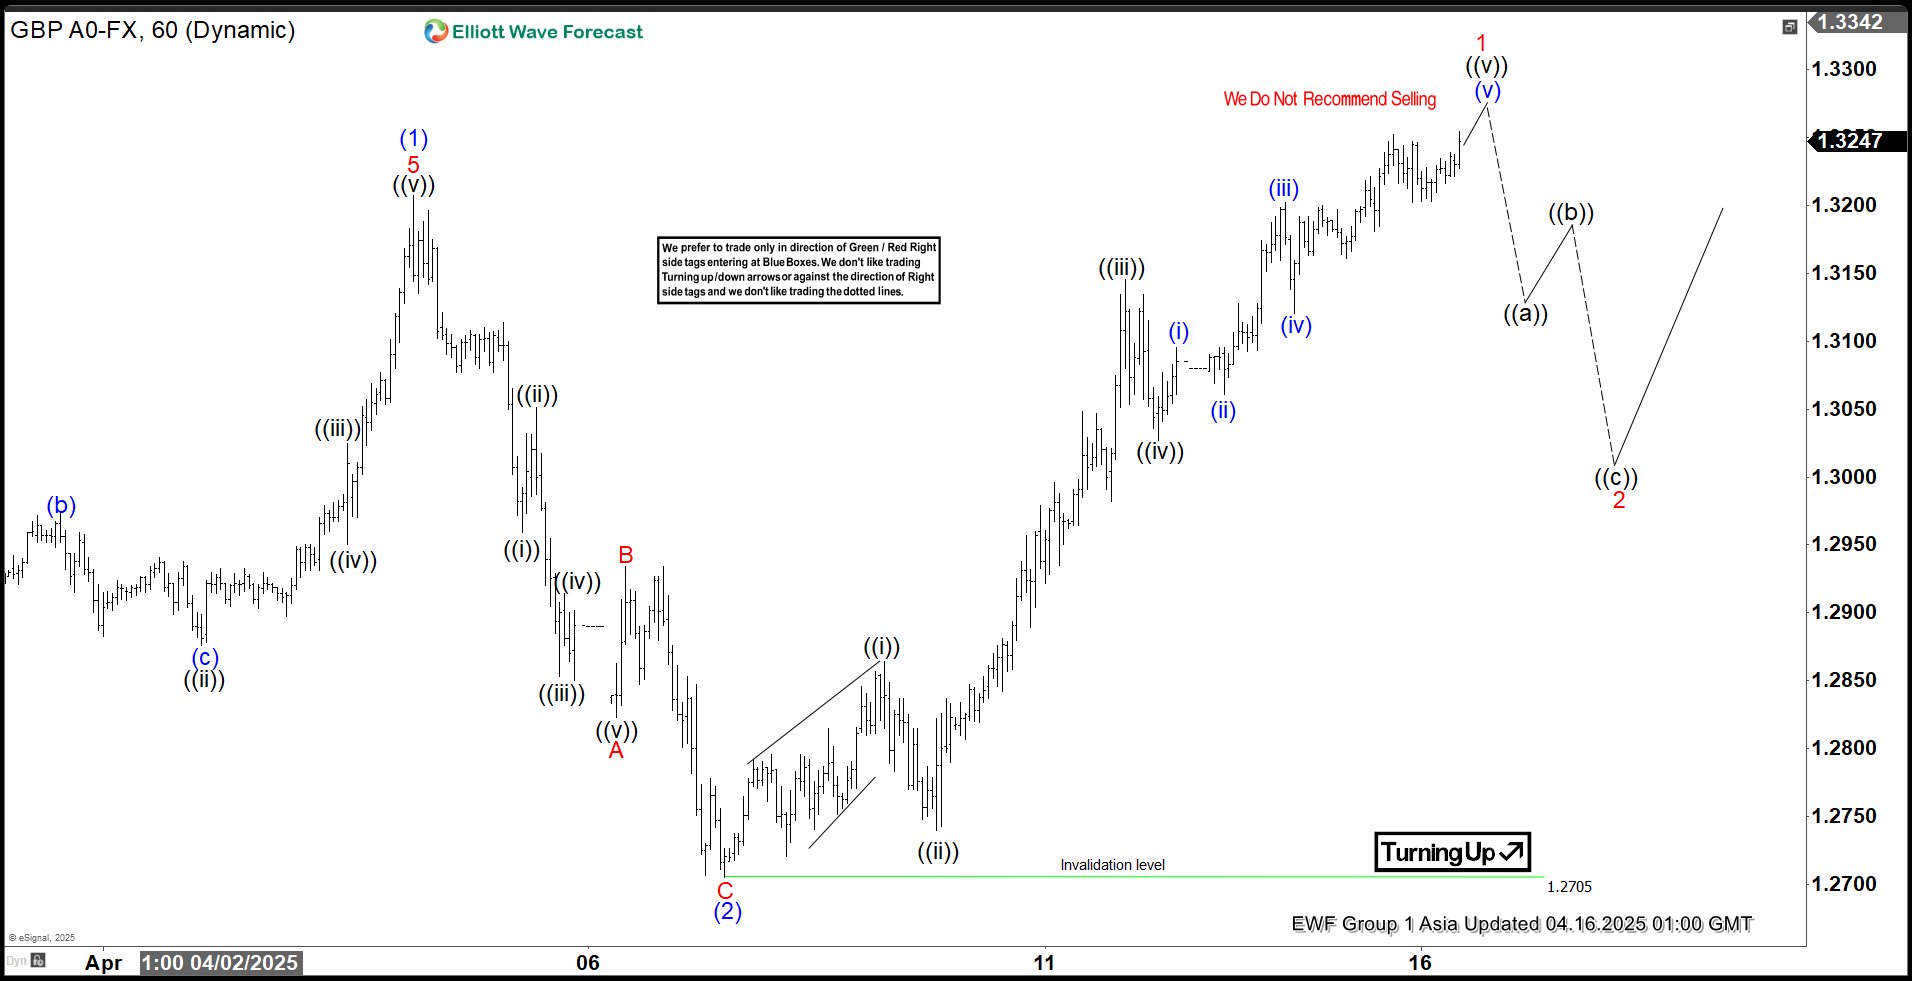
GBPUSD has recently broken above its April 3, 2025 peak of 1.3207, which we identified as wave (1) in the chart. This breakout signals a bullish trend starting from the January 13, 2025 low of 1.2705, suggesting more upward movement ahead. The rally from this low follows a five-wave Elliott Wave pattern. This is a common structure in technical analysis indicating a strong trend.
Starting from the January 13 low, the first wave or wave (1) reached 1.3207.,A pullback in wave (2) then followed which ended at 1.2705. This pullback formed a zigzag pattern. Wave A dropped to 1.2823, wave B rose to 1.2934, and wave C fell to 1.2705, completing wave (2).
The pair has now moved higher into wave (3). From the wave (2) low, the first sub-wave (wave ((i))) peaked at 1.2864, followed by a dip in wave ((ii)) to 1.274. The third sub-wave (wave ((iii))) climbed to 1.314, and the fourth (wave ((iv))) dipped to 1.3027. The fifth sub-wave (wave ((v))) is expected to finish soon, completing wave 1 of a larger pattern.
After this, the pair is likely to pull back in wave 2, correcting the upward move from the April 8, 2025 low. This correction could unfold in 3, 7, or 11 smaller swings before the pair resumes its upward trend. In the short term, as long as the 1.27 low holds, any dips should attract buyers in 3, 7, or 11 swings, supporting further gains.
GBPUSD 60 Minute Elliott Wave Chart
GBPUSD Video
https://www.youtube.com/watch?v=ghD1ZV5_E5A
USD/CAD Daily Outlook
Daily Pivots: (S1) 1.3882; (P) 1.3930; (R1) 1.4010; More...
Intraday bias in USD/CAD remains neutral and more consolidations could be seen above 1.3827. While stronger recovery cannot be ruled out, outlook will stay bearish as long as 1.4150 support turned resistance holds. On the downside, break of 1.3827 will resume the fall from 1.4791 to 100% projection of 1.4791 to 1.4150 from 1.4414 at 1.3773.
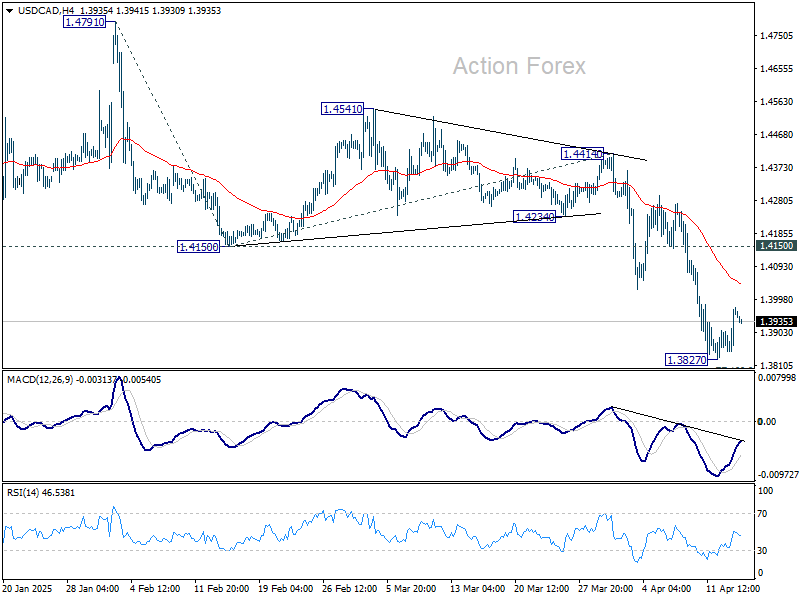
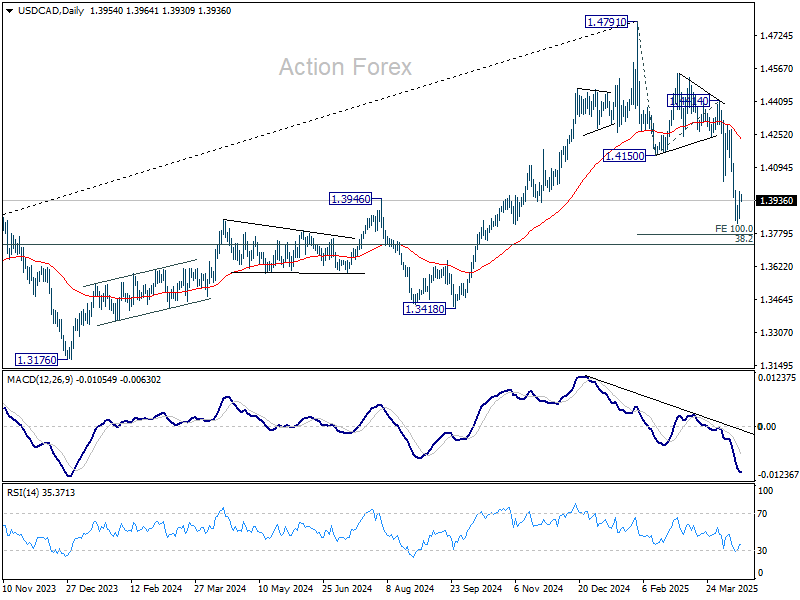
In the bigger picture, the break of 1.3976 resistance turned support (2022 high) and 55 W EMA (now at 1.3983) indicates that a medium term top is already in place at 1.4791. Fall from there would either be a correction to rise from 1.2005, or trend reversal. In either case, firm break of 38.2% retracement of 1.2005 (2021 low) to 1.4791 at 1.3727 will pave the way back to 61.8% retracement at 1.3069.
Strong China Data Fails to Buoy Risk Sentiment; BoC Stuck Between Cutting and Holding
Risk sentiment turned a bit subdued in Asia today. Markets are broadly soft, continuing to digest the sharp tariff-driven selloff seen earlier this month. Even China's stronger-than-expected Q1 data, including a 5.4% GDP growth print and robust industrial and retail figures, failed to provide much lift. Market participants appear skeptical, viewing the numbers as a front-loading of activity ahead of the full brunt of US and China tariffs , which are already reaching decoupling levels. The real test for China’s resilience will come in the months ahead as trade disruptions deepen.
In the currency markets, Dollar is broadly weaker once again, giving back recent recovery as sentiment fluctuates. Aussie and Loonie are also underperforming. On the other hand, Swiss Franc has returned to the top of the board, followed by Euro and Yen, as investors rotate back into safer havens. Sterling and Kiwi are holding steady in the middle.
BoC rate decision later today is a major focal point, and markets are evenly split on the outcome. Yesterday’s softer-than-expected inflation data reinforced the view that February’s CPI spike was likely transitory, giving BoC room to cut rates from 2.75% to 2.50%. With US tariffs weighing on global demand and sentiment, a preemptive move to cushion the Canadian economy would be defensible.
However, some argue BoC may prefer to hold for now, especially to assess the medium-term inflationary effects of tariffs. While headline CPI is easing, trade-related supply disruptions and currency depreciation could generate renewed price pressures in the months ahead. Balancing these competing risks will be no easy task, and with the policy rate already cut sharply from its 5.00% peak, the central bank has room to wait for greater clarity.
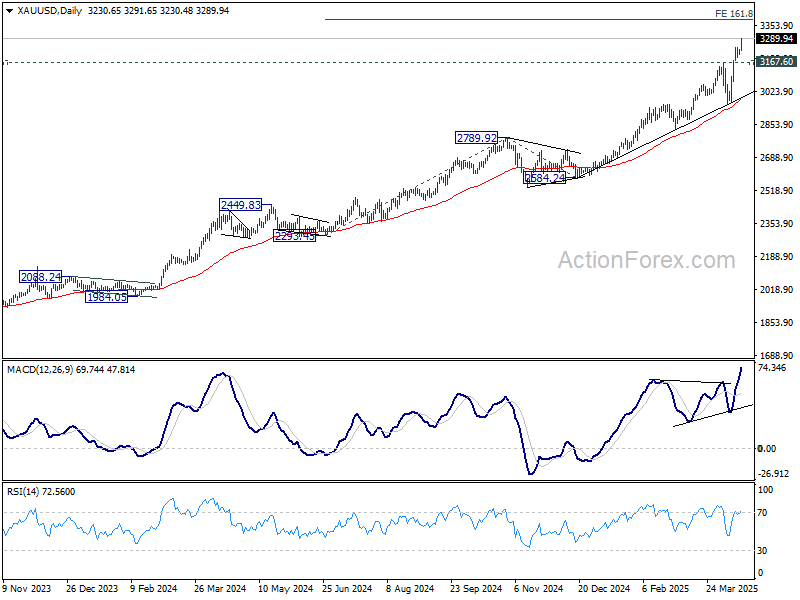
Gold, meanwhile, continues to benefit from the uncertain backdrop, with prices pushing to new all-time highs. Technically, D MACD suggests that the up trend is still in upside acceleration phase. Near term outlook will stay bullish as long as 3167.60 resistance turned support holds. The question is whether overbought condition would cap upside at 161.8% projection of 2293.45 to 2789.92 from 2584.24 at 3387.52. Or Gold would just shoot through the roof.
In Asia, at the time of writing, Nikkei is down -1.36%. Hong Kong HSI is down -2.46%. China Shanghai SSE is down -0.63%. Singapore Strait Times is up 0.15%. Japan 10-year JGB yield is down -0.052 at 1.323. Overnight, DOW fell -0.38%. S&P 500 fell -0.17%. NASDAQ fell -0.05%. 10-year yield fell -0.041 to 4.323.
BoJ’s Ueda: US tariffs nearing bad scenario, policy response may be needed
BoJ Governor Kazuo Ueda warned that US President Donald Trump’s escalating tariff policies have "moved closer towards the bad scenario” anticipated by the central bank.
“We will scrutinise without pre-conception the extent to which US tariffs could hurt the economy,” he said in an interview with Sankei newspaper.
"A policy response may become necessary. We will make an appropriate decision in accordance with changes in developments," he added.
Nevertheless, Ueda reiterated that BoJ will continue to raise interest rates “at an appropriate pace” as long as economic and price conditions align with its projections.
On inflation, Ueda said domestic food price pressures are expected to ease. He sees real wages turning positive and continuing to rise into the second half of the year, supporting consumption and price stability.
Still, he warned of dual risks: persistent inflation driven by global supply shocks, or a consumption drag caused by the rising cost of living.
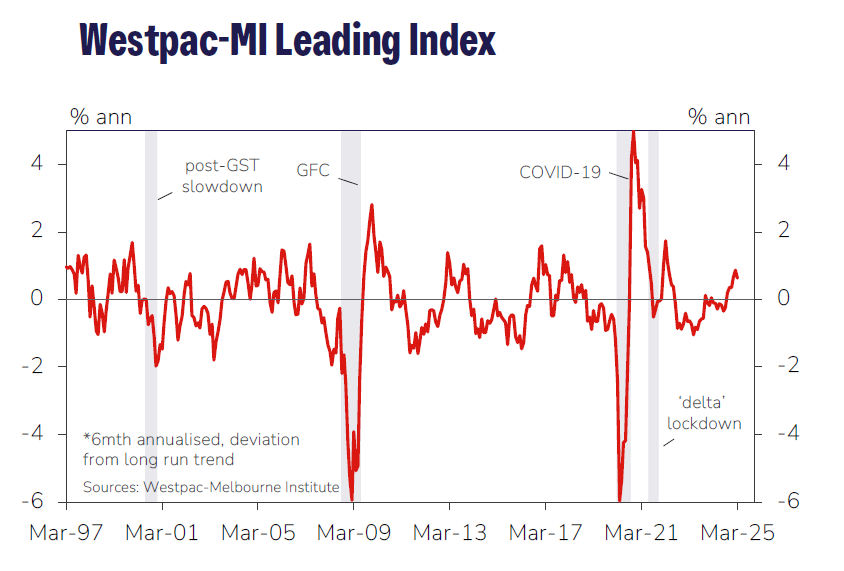
Australia Westpac leading index falls as tariff shock starting to weigh
Australia’s Westpac Leading Index slipped from 0.9% to 0.6% in March. Westpac noted that the index has only just begun to reflect the escalating disruptions caused by US President Donald Trump's reciprocal tariff announcement on April 2.
While the immediate impact on Australia is seen as limited and manageable for now, "some further softening in the growth pulse looks likely in the months ahead".
Westpac has revised down its growth forecast for Australia in 2025 to 1.9% from 2.2%, citing the accumulating downside risks.
Looking ahead to RBA's May 19–20 meeting, Westpac expects the deteriorating global backdrop and clearer signs of inflation cooling will prompt a 25bps rate cut.
Moreover, the tone of the meeting is likely to pivot more decisively "away from lingering questions about inflation to downside risks to growth." Such a shift would lay the groundwork for additional policy easing in the second half of the year.
China Q1 GDP tops forecasts with 5.4% growth
China’s economy started the year on a stronger footing, with GDP expanding by 5.4% yoy in Q1, surpassing market expectations of 5.1%. On a quarterly basis, growth slowed to 1.2% from 1.6% in Q4.
March’s activity indicators were broadly upbeat. Industrial production surged by 7.7% yoy, well above the 5.6% yoy forecast. Retail sales climbed 5.9%, also ahead of expectations of 5.1% yoy.
Fixed asset investment increased 4.2% year-to-date, modestly exceeding projections. However, persistent weakness in the property sector continues to weigh on the recovery narrative. Property investment fell -9.9% in Q1, slightly worse than the -9.8% decline recorded over the first two months of the year. Private sector investment—a key gauge of business confidence—rose only 0.4%.
Looking ahead
UK CPI and Eurozone CPI final are the main features in European session. Later in the day, US will release retail sales, industrial production and NAHB housing index. BoC rate deision will also be a major focus.
USD/CAD Daily Outlook
Daily Pivots: (S1) 1.3882; (P) 1.3930; (R1) 1.4010; More...
Intraday bias in USD/CAD remains neutral and more consolidations could be seen above 1.3827. While stronger recovery cannot be ruled out, outlook will stay bearish as long as 1.4150 support turned resistance holds. On the downside, break of 1.3827 will resume the fall from 1.4791 to 100% projection of 1.4791 to 1.4150 from 1.4414 at 1.3773.
In the bigger picture, the break of 1.3976 resistance turned support (2022 high) and 55 W EMA (now at 1.3983) indicates that a medium term top is already in place at 1.4791. Fall from there would either be a correction to rise from 1.2005, or trend reversal. In either case, firm break of 38.2% retracement of 1.2005 (2021 low) to 1.4791 at 1.3727 will pave the way back to 61.8% retracement at 1.3069.
Ethereum In Limbo: Limited Upside May Invite Market Caution
Key Highlights
- Ethereum found support near $1,375 and corrected some losses.
- ETH is still well below a key bearish trend line with resistance at $1,740 on the daily chart.
- Bitcoin price must settle above $88,000 to start a fresh increase.
- XRP could gain bullish momentum if it clears the $2.250 resistance.
Ethereum Technical Analysis
Ethereum declined heavily below the $2,000 zone, like Bitcoin. ETH traded below the $1,800 and $1,550 support levels before the bulls appeared near $1,375.
Looking at the daily chart, the price settled well below the 100-day simple moving average (red) and the 200-day simple moving average (green). A low was formed at $1,379 and the price recently started a recovery wave.
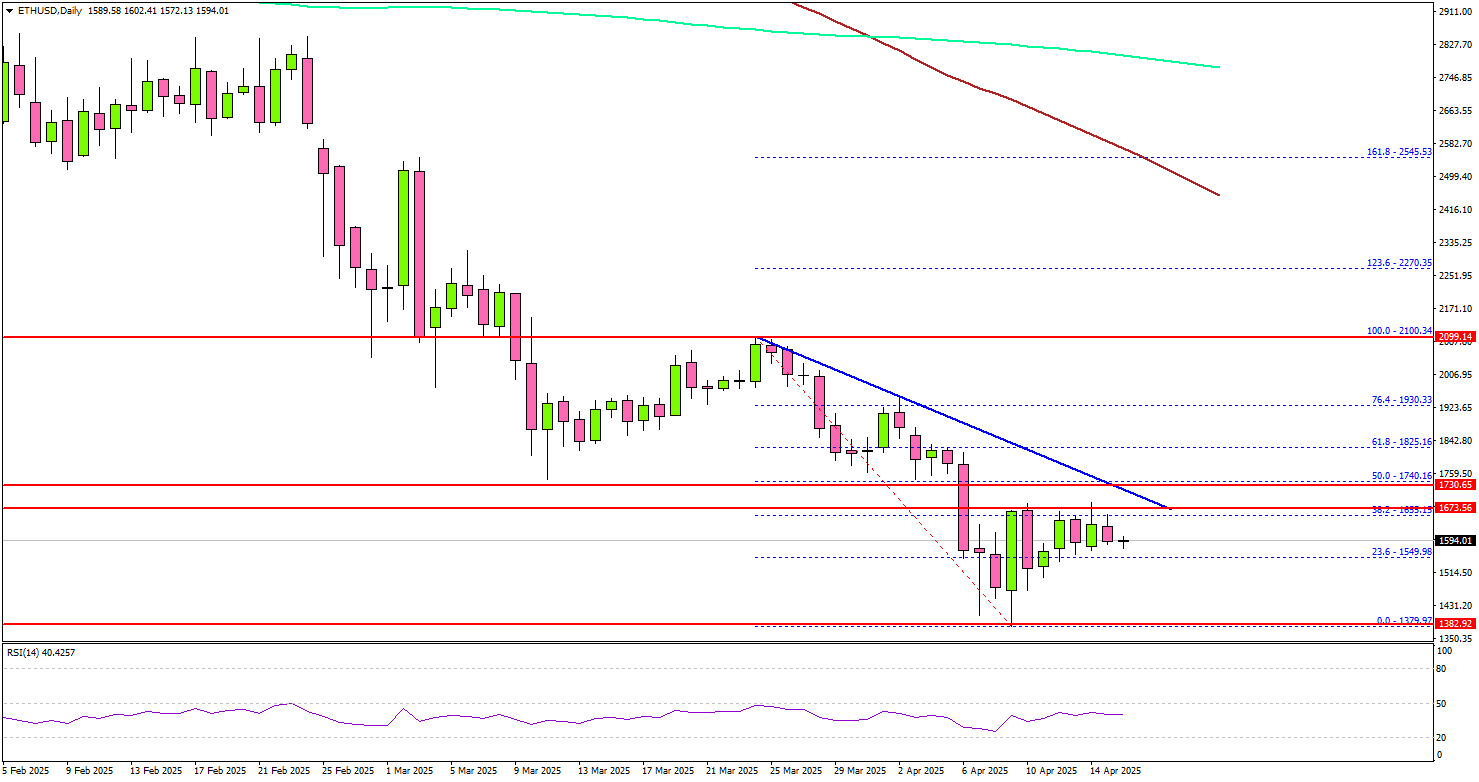
There was a move above the 23.6% Fib retracement level of the downward move from the $2,100 swing high to the $1,379 low. Immediate resistance is near the $1,675 level.
The next major resistance is near the $1,740 level. There is also a key bearish trend line forming with resistance at $1,740 on the same chart. The trend line is close to the 50% Fib retracement level of the downward move from the $2,100 swing high to the $1,379 low.
A daily close above the $1,740 resistance zone could start another steady increase. In the stated case, the price may perhaps rise toward the $2,000 level. The next stop for the bulls may perhaps be to $2,100.
On the downside, Ethereum might find support near the $1,450 level. The next major support is $1,375, below which the price could slide toward $1,320. Any more losses might call for a move toward the $1,200 level.
Looking at Bitcoin, there was a steady increase above the $84,000 level, and the price might continue to rise toward the $88,000 level.
Economic Releases
- Fed's Chair Powell speech.
- US Retail Sales for March 2025 (MoM) – Forecast +1.3%, versus +0.2% previous.
China Q1 GDP tops forecasts with 5.4% growth
China’s economy started the year on a stronger footing, with GDP expanding by 5.4% yoy in Q1, surpassing market expectations of 5.1%. On a quarterly basis, growth slowed to 1.2% from 1.6% in Q4.
March’s activity indicators were broadly upbeat. Industrial production surged by 7.7% yoy, well above the 5.6% yoy forecast. Retail sales climbed 5.9%, also ahead of expectations of 5.1% yoy.
Fixed asset investment increased 4.2% year-to-date, modestly exceeding projections. However, persistent weakness in the property sector continues to weigh on the recovery narrative. Property investment fell -9.9% in Q1, slightly worse than the -9.8% decline recorded over the first two months of the year. Private sector investment—a key gauge of business confidence—rose only 0.4%.
Australia Westpac leading index falls as tariff shock starting to weigh
Australia’s Westpac Leading Index slipped from 0.9% to 0.6% in March. Westpac noted that the index has only just begun to reflect the escalating disruptions caused by US President Donald Trump's reciprocal tariff announcement on April 2.
While the immediate impact on Australia is seen as limited and manageable for now, "some further softening in the growth pulse looks likely in the months ahead".
Westpac has revised down its growth forecast for Australia in 2025 to 1.9% from 2.2%, citing the accumulating downside risks.
Looking ahead to RBA's May 19–20 meeting, Westpac expects the deteriorating global backdrop and clearer signs of inflation cooling will prompt a 25bps rate cut.
Moreover, the tone of the meeting is likely to pivot more decisively "away from lingering questions about inflation to downside risks to growth." Such a shift would lay the groundwork for additional policy easing in the second half of the year.
BoJ’s Ueda: US tariffs nearing bad scenario, policy response may be needed
BoJ Governor Kazuo Ueda warned that US President Donald Trump’s escalating tariff policies have "moved closer towards the bad scenario” anticipated by the central bank.
“We will scrutinise without pre-conception the extent to which US tariffs could hurt the economy,” he said in an interview with Sankei newspaper.
"A policy response may become necessary. We will make an appropriate decision in accordance with changes in developments," he added.
Nevertheless, Ueda reiterated that BoJ will continue to raise interest rates “at an appropriate pace” as long as economic and price conditions align with its projections.
On inflation, Ueda said domestic food price pressures are expected to ease. He sees real wages turning positive and continuing to rise into the second half of the year, supporting consumption and price stability.
Still, he warned of dual risks: persistent inflation driven by global supply shocks, or a consumption drag caused by the rising cost of living.
Asia Opening Bell: US Stock Index Futures Tumbled Over Nvidia’s Export Ban, Gold Accelerated to Another Fresh All-Time High
Yesterday, 15 April, saw another lacklustre session in the US stock market, as US trade tariff woes overshadowed strong earnings results from Bank of America and Citigroup that beat expectations.
The S&P gave up its initial opening intraday gain of 0.7% and ended yesterday's session with a loss of -0.2%. Other major stock indices also witnessed a downward reversal, the Dow Jones Industrial Average shed 0.4%, the Nasdaq 100 and Russell 2000 ended with minor gains of 0.2% and 0.1%, respectively.
Trade tariffs uncertainties arising from the lack of progress made between the European Union and US officials over trade negotiations, and the US has indicated that most US tariffs on the EU will not be removed.
In addition, China has ordered its airlines not to take any further deliveries of Boeing jets, as part tit-for-tat trade war measures, indicating more potential escalations between the US and China.
After the close of yesterday’s US session, media reports highlighted that Nvidia has been informed by the US White House to restrict its exports of H20 chips to China. Nasdaq 100 and S&P 500 E-mini futures reacted negatively with an intraday loss of 1.3% and 0.9% respectively in today’s Asia session at this time of writing.
Safe haven demand remains in vogue as Gold (XAU/USD), as the yellow metal added an intraday gain of 1.1% in today’s session, accelerated to a fresh all-time high of $3,266 at this time of writing.
The US Dollar Index snapped a five-day losing streak as it rose by 0.5% yesterday. However, the pound outperformed, where the GBP/USD gained by 0.3%, and rose above 1.32, to a six-month high.
Asian stock indices started today’s session on a weak footing as Japan’s Nikkei 255 reversed down after two days of gains with an intraday loss of 0.5%. On the radar next will be key China economic data releases (Q1 GDP, Retail Sales, Industrial Production) at 10.00 am Singapore time.
Economic data releases
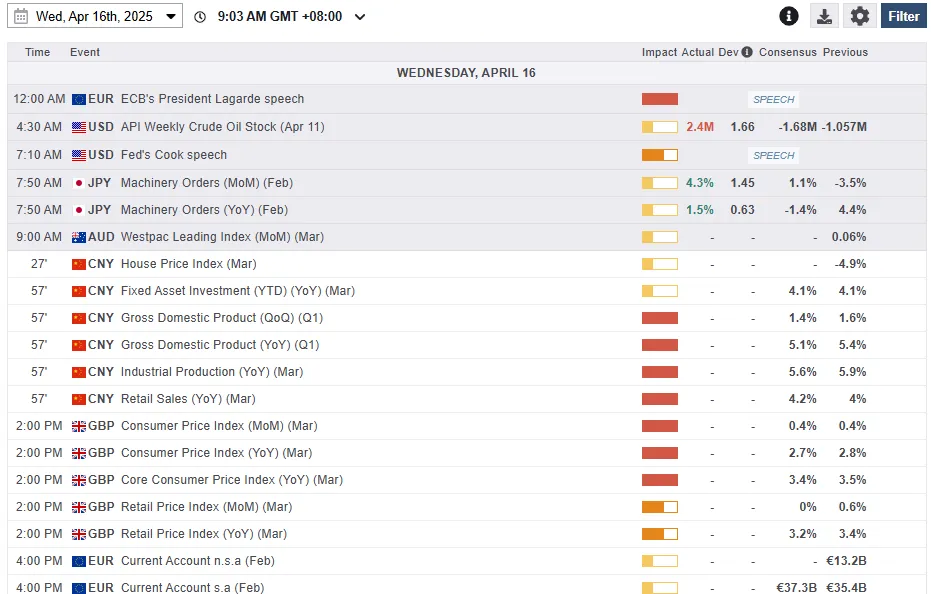
Fig 1: Key data for today’s Asian session (Source: MarketPulse)
Chart of the day – Gold (XAU/USD)
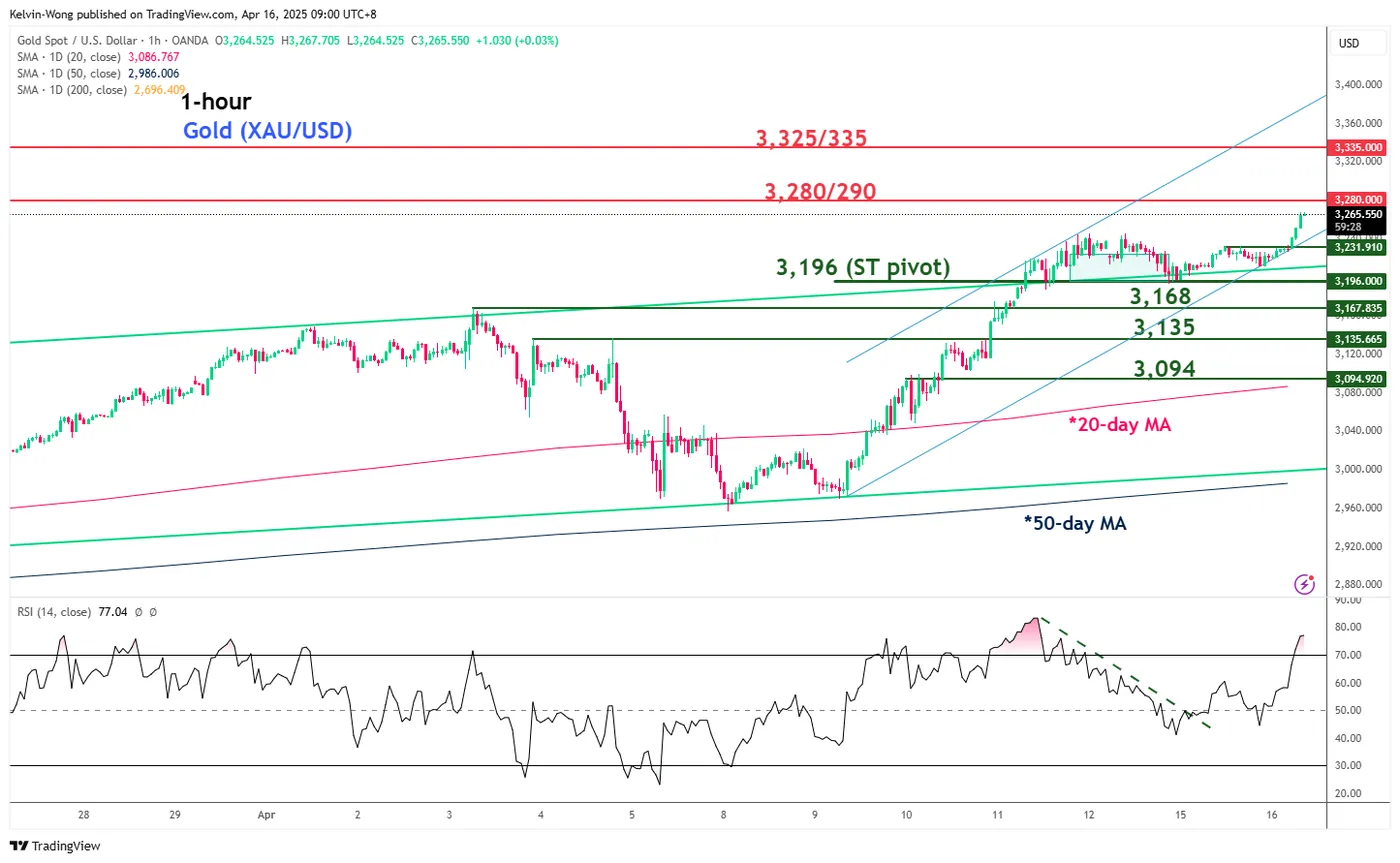
Fig 2: Gold (XAU/USD) minor trend as of 16 Apr 2025 (Source: Trading View)
The bullish acceleration in the yellow metal is supported by a positive momentum reading seen on its RSI momentum indicator.
Watch the $3,196 key short-term pivotal support on Gold (XAU/USD) with the next intermediate resistances coming in at $3,280/290 and $3,325/335.
On the flip side, a break below $3,196 negates the bullish tone to kickstart a minor corrective decline sequence within its short-term uptrend phase to expose the next intermediate supports at $3,168 and $3,135.
GBPCAD Trade Setup: Bulls Re-Enter from Blue Box
Hello traders and welcome to another ‘blue box’ blog post. In a blog post like this, we discuss most recent trade setups that the Elliottwave-Forecast members took. The spotlight will be on the GBPCAD again in this post.
In the last update on GBPCAD, we discussed a bullish trade setup from the blue box. The pair had just concluded a 3-swing pullback from the March 2025 high. Prior to that, at the top of the March 2024 high, price had just completed wave ((3)) within the clear bullish sequence from the low of September 2023. Thus, the path for ‘buy the dip’ came after price surged above the December 2024 wave ((1)) high after over five months of sideways/choppy price action. If you have been reading our previous posts, you’d know we like buying pullbacks with a bullish sequence. Likewise, in a bearish sequence, we like selling bounces. Pullbacks/bounces evolve in a 3, 7 or 11 swing structures.
When the market presented the opportunity to buy off the extreme of a 3-swing pullback for wave ((4)) on the 27th March 2025, we didn’t hesitate. Members went long as we showed in the last update. GBPCAD found support in the blue box and bounced to the risk free price. Our first target is what we call the RISK FREE PRICE. At this risk-free price, we like closing half our position in profit while leaving rest to breakeven. We like doing this conservative trade management approach because we understand the nature of the markets when correcting a trend-based sequence.
Corrections often complete a 3, 7 or 11 swing structure. When a 3-swing fails, 7 swing evolves. In a like manner, when a 7-swing fails, an 11-swing will evolves. In this example, the bounce from the blue box was corrective and the pair turned lower to evolve as a 7-swing deeper structure. Therefore, members closed the second half of their positions at breakeven and kept the profit on the first target. When the evolving 7-swing structure breached the 26th March 2025 low, we alerted members with another blue box on the H4 chart.
GBPCAD Trade Setup: 8th April, 2025
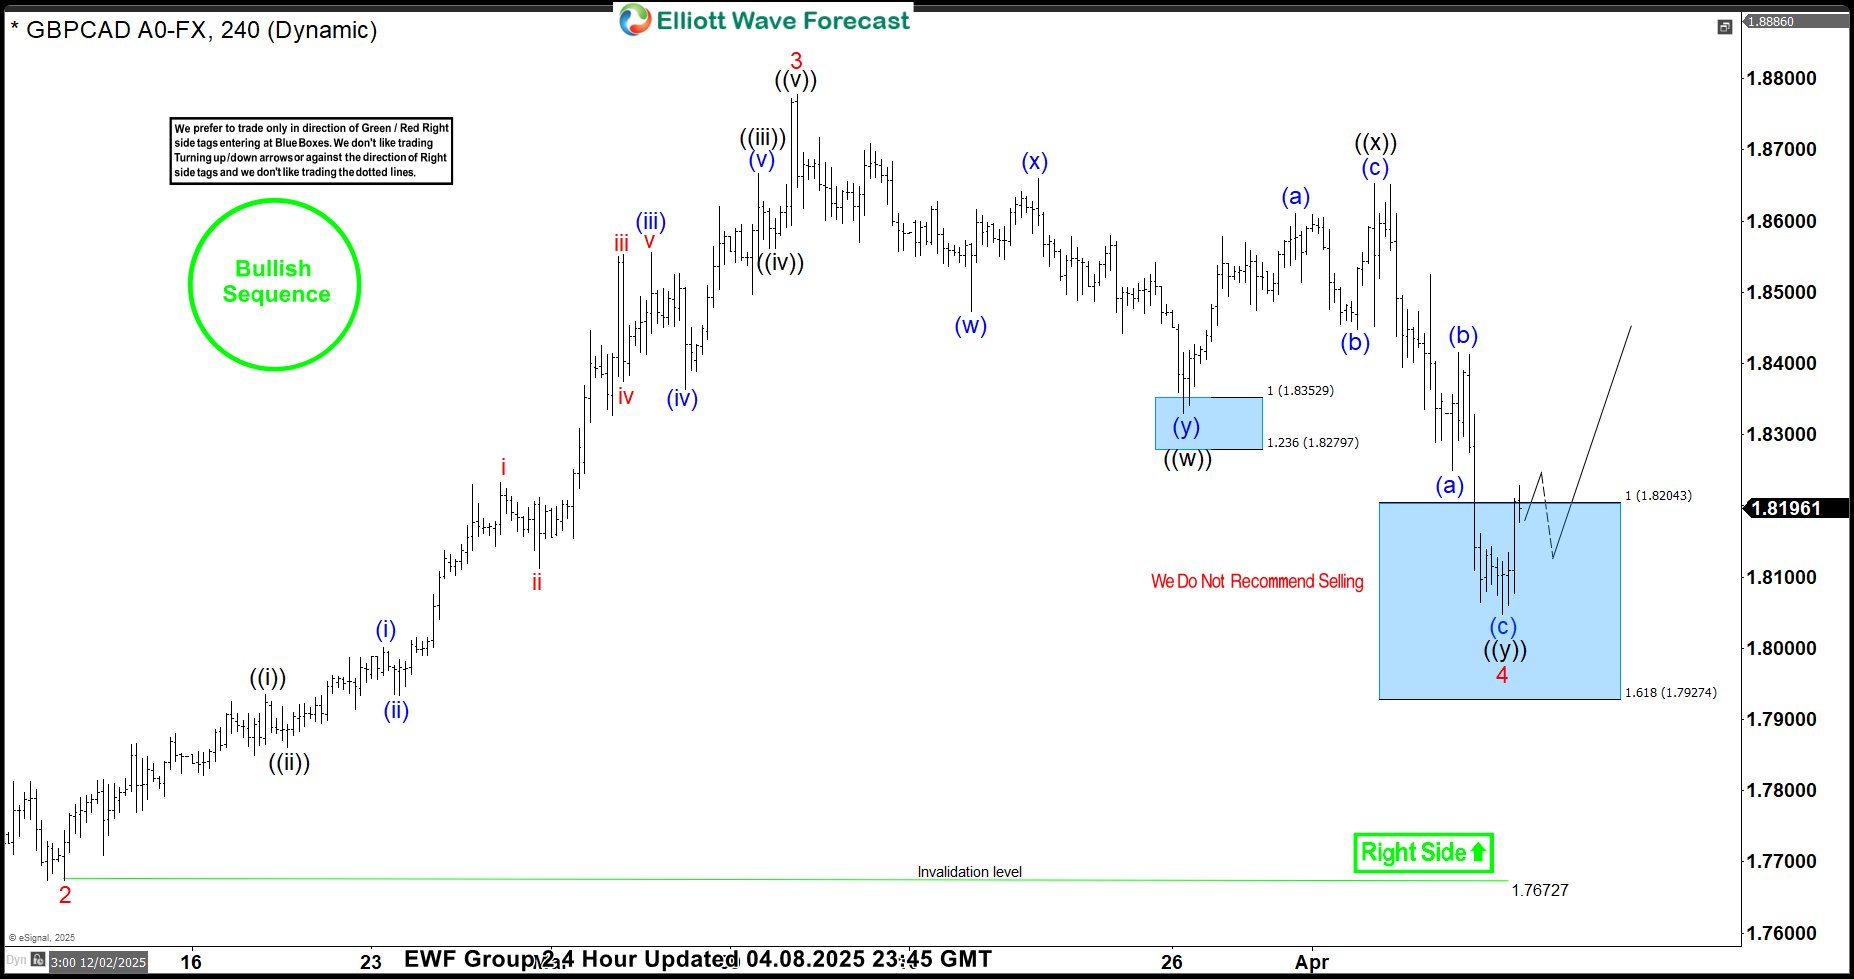
GBPCAD, H4
On 8th April 2024, we shared the chart above with members showing the blue box at 1.8204-1.7927. At the blue box, members went long and set stop at 1.7927. We expected price to finish a 7-swing structure for wave 4 with anticipation for more rallies in wave 5 of ((3)). Afterwards, wave ((4)) pullback will evolve with another buying opportunity. For this setup, we set the first target at 1.8305. At 1.8305, we anticipated to take partial profit and set the rest of the position to breakeven. The final target was set at 1.8970 where we like to close the rest of the position.
GBPCAD Trade Setup: 15th April, 2025
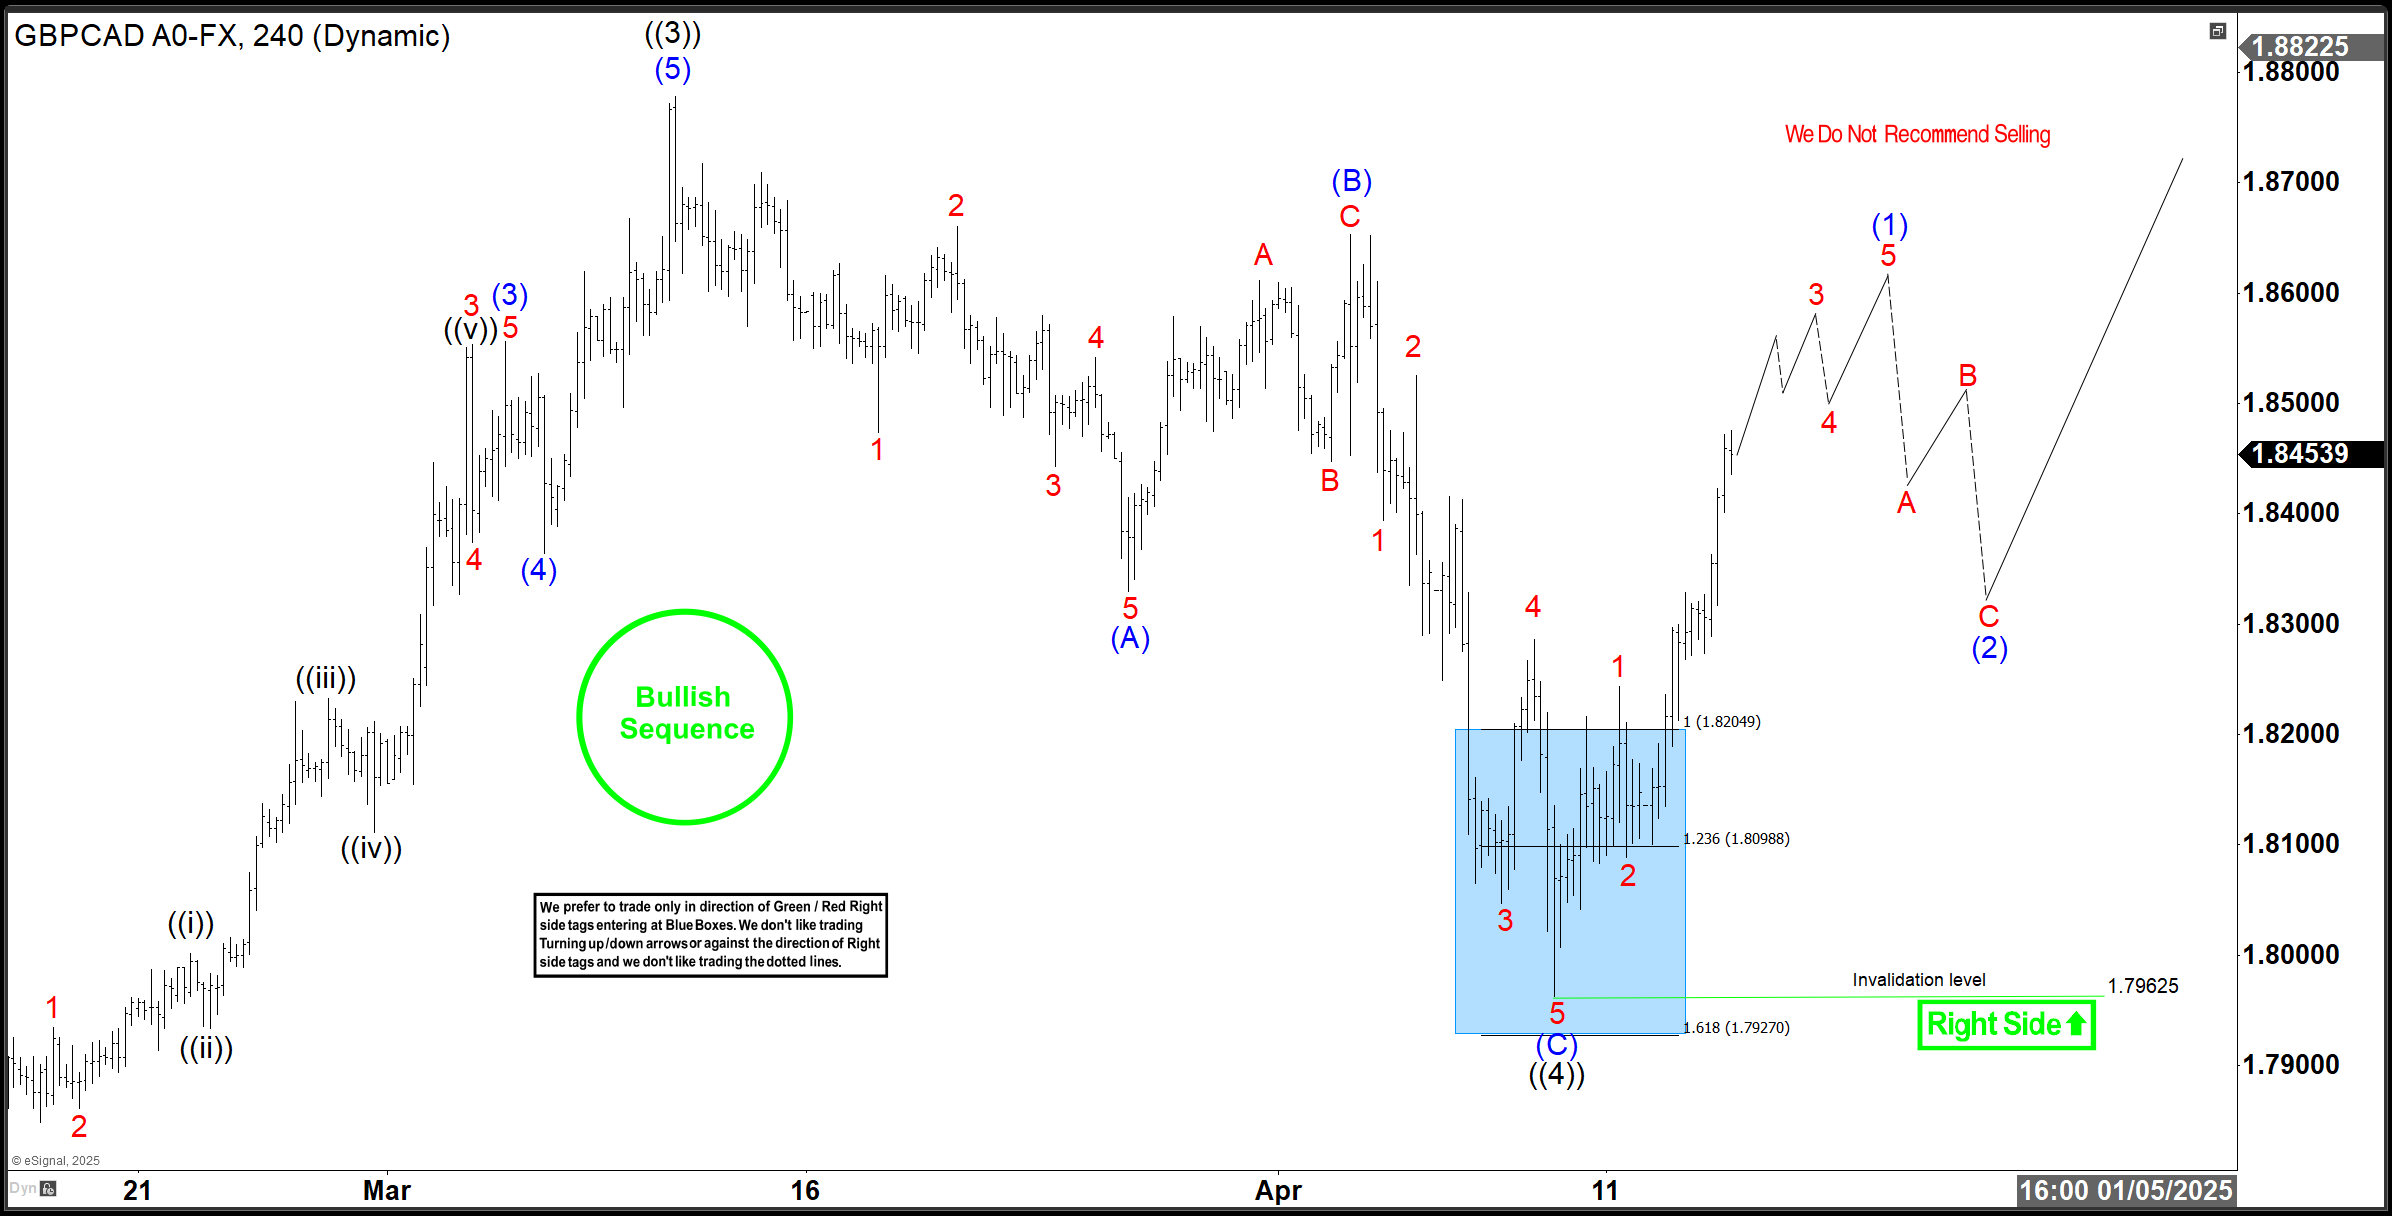
GBPCAD, H4
The chart above shows the current price action (the time of typing this) just a week after. After few candles in the box, the pair surged quickly to exceed the first target. Thus, members are running a risk-free trade right now after keeping some profits. Members will aim to close the rest of the position at 1.8974 where wave ((3)) could finish. The next setup will be the wave ((4)) pullback as the long-term bullish sequence remains incomplete. This is exactly how we like trading with our members.
USDJPY Wave Analysis
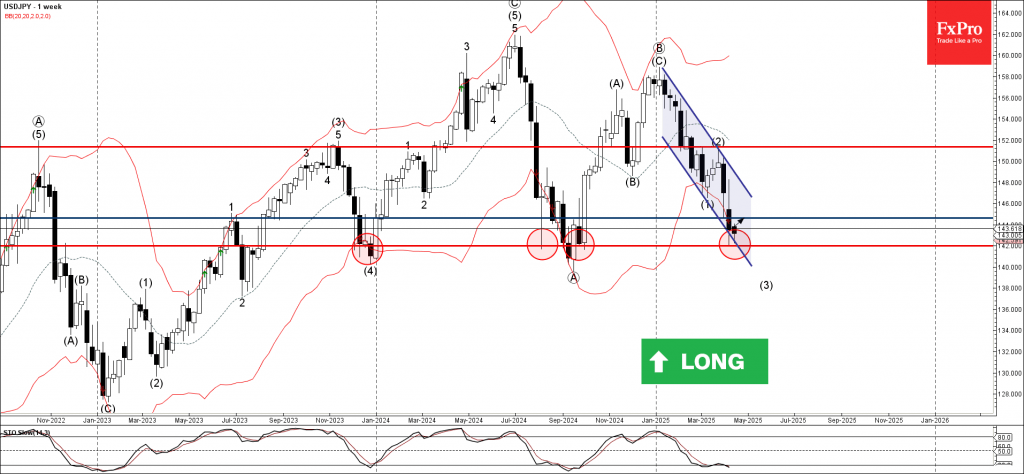
USDJPY: ⬆️ Buy
- USDJPY reversed from long-term support level 142.00
- Likely to rise to the resistance level 144.65
USDJPY currency pair recently reversed up from the support zone between the long-term support level 142.00 (which has been reversing the price from the end of 2023), support trendline of the weekly down-channel from January and the lower weekly Bollinger Band.
The upward reversal from this support zone stopped the previous intermediate impulse wave (3) from last month.
Given the strength of the support level 142.00 and the oversold weekly Stochastic, USDJPY currency pair can be expected to rise to the next resistance level 144.65.