
Sample Category Title
Bitcoin Starts Breaking Resistance
Market Overview
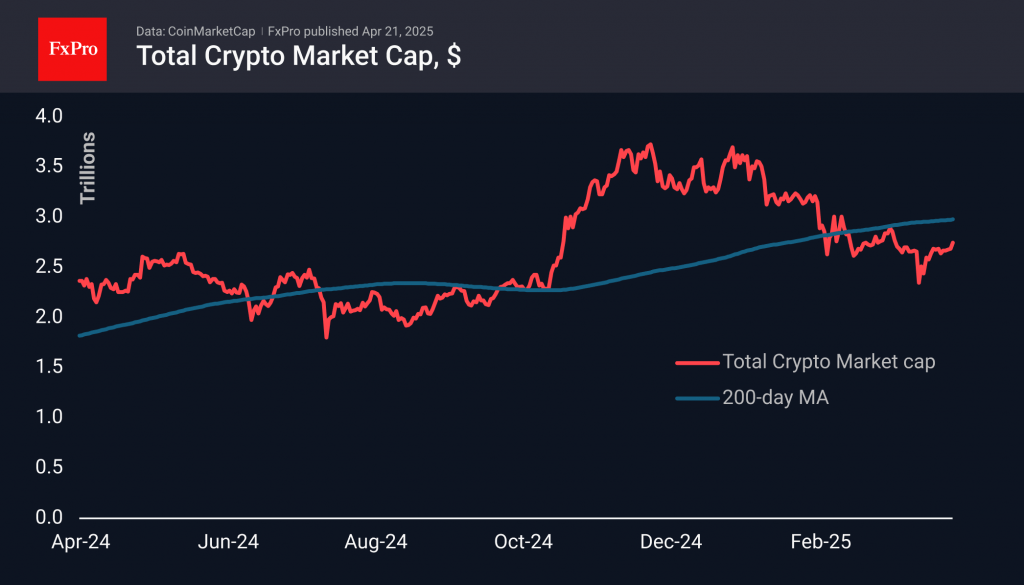
The crypto market has gained 2% over the past 24 hours, reaching $2.75 trillion. This marks a surge to the highest levels in three and a half weeks and an attempt to break upwards from a prolonged consolidation. At this stage, attention is focused on top-tier coins — BTC, ETH, XRP, and BNB — all gaining over 2%. However, among slightly smaller-cap coins, performance remains quite varied.
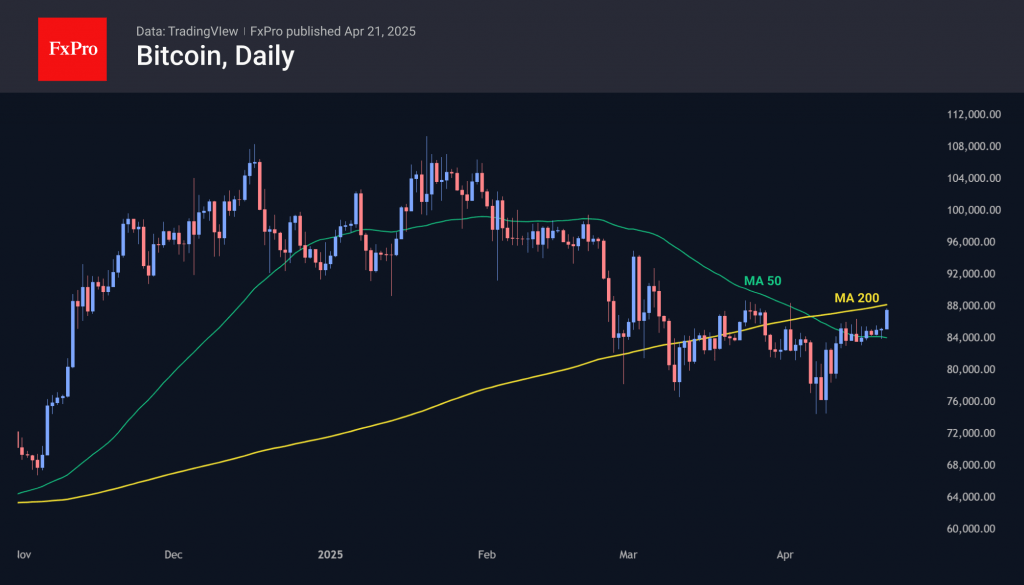
Bitcoin jumped to $87,500 on Monday, testing the late March highs. The leading cryptocurrency managed to bounce off the 50-day moving average, around which it had been hovering for the past week and a half. A solid close above the $88,000 area would signal a break in the downtrend and a return to levels above the 200-day moving average.
A confident move higher from current levels would be a key signal for the entire market, once again positioning BTC as the flagship set to lead the way.
News Background
Analysts have also pointed to a slowdown in the growth of stablecoin supply in recent weeks. This is another sign of declining liquidity in digital assets.
Barry Silbert, founder of the venture-holding Digital Currency Group (DCG), stated that 99.9% of existing cryptocurrencies are pointless and worthless. According to him, simply holding Bitcoin instead of investing in crypto projects would have made him significantly more money.
Google searches for Bitcoin in March hit their highest levels since the start of the year, rising by 26% over the month. Ethereum showed a similar trend, indicating a revival of interest in digital assets from retail investors, as noted by The Block.
According to Matrixport, ETH’s market share has dropped by nearly 50% since the launch of spot Ethereum ETFs in the US in July 2024. At the same time, Bitcoin remains stable despite its limited liquidity.
XAU/USD: Gold Resumes Rally After a Brief Holiday Pause and Nears $3,400 Target
Markets are back to business and accelerated in unchanged direction after short Easter break.
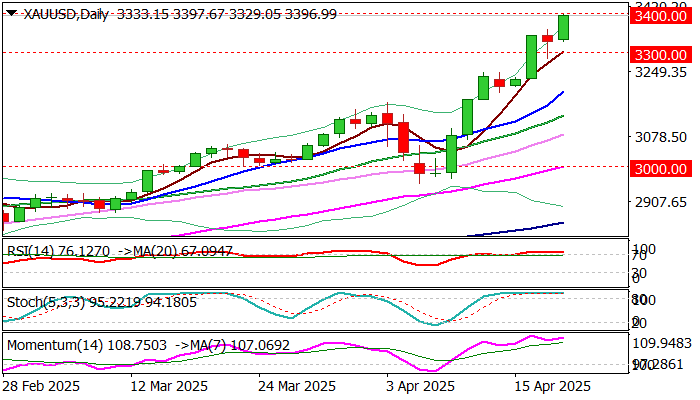
Gold jumped around 1.8% in Asian/early European trading, hitting series of new record highs and pressuring psychological $3400 level.
Fresh safe haven demand was sparked on growing uncertainty over escalation of US-China trade war and China’s warning to countries against striking economic deal with the US.
Clouded US economic outlook and fresh tensions over President Trump’s attack against Fed Chair Powell, added to migration from US dollar and further inflated gold price.
Fresh gains came just ticks ahead of $3400 level, where headwinds are expected as daily studies are strongly overbought, while hourly indicators form initial reversal signal (momentum and stochastic bearish divergence).
However, due to strong and unchanged supportive factors (fundamentals) dips are likely to be shallow, with support at $3360 zone and session low ($3329) marking solid supports which should contain and guard more significant $3300 support.
Final break of $3400 to expose targets at $3428 and $3459 (Fibo projections).
The latest rallies signal that bulls already eye target at $3500, against my recent forecast that gold would hit $3500 by the end of the year.
The metal’s price holds in steep and accelerating uptrend for the fourth consecutive month, adding to signals of possible much stronger than expected gains in the near future.
Res: 3400; 3428; 3459; 3500.
Sup: 3369; 3357; 3329; 3300.
BTC/USD Analysis: Bulls on the Offensive
In our previous analysis of Bitcoin’s price (14 April), we:
→ constructed a long-term ascending channel (marked with blue lines);
→ highlighted resistance level R, suggesting that the bulls were seizing the initiative in an attempt to pave the way for a continuation of the long-term trend on the BTC/USD chart.
As we can see, Bitcoin is now trading at its highest level in nearly three weeks. Moreover, the bulls are close to reclaiming a key high from early April. Market sentiment is being buoyed, in part, by comments from Michael Saylor, who stated that MicroStrategy is prepared to continue accumulating Bitcoin. Following a recent purchase of more than 3,000 coins, the company now holds over 530,000 BTC on its balance sheet.
Technical Analysis of the BTC/USD Chart Today
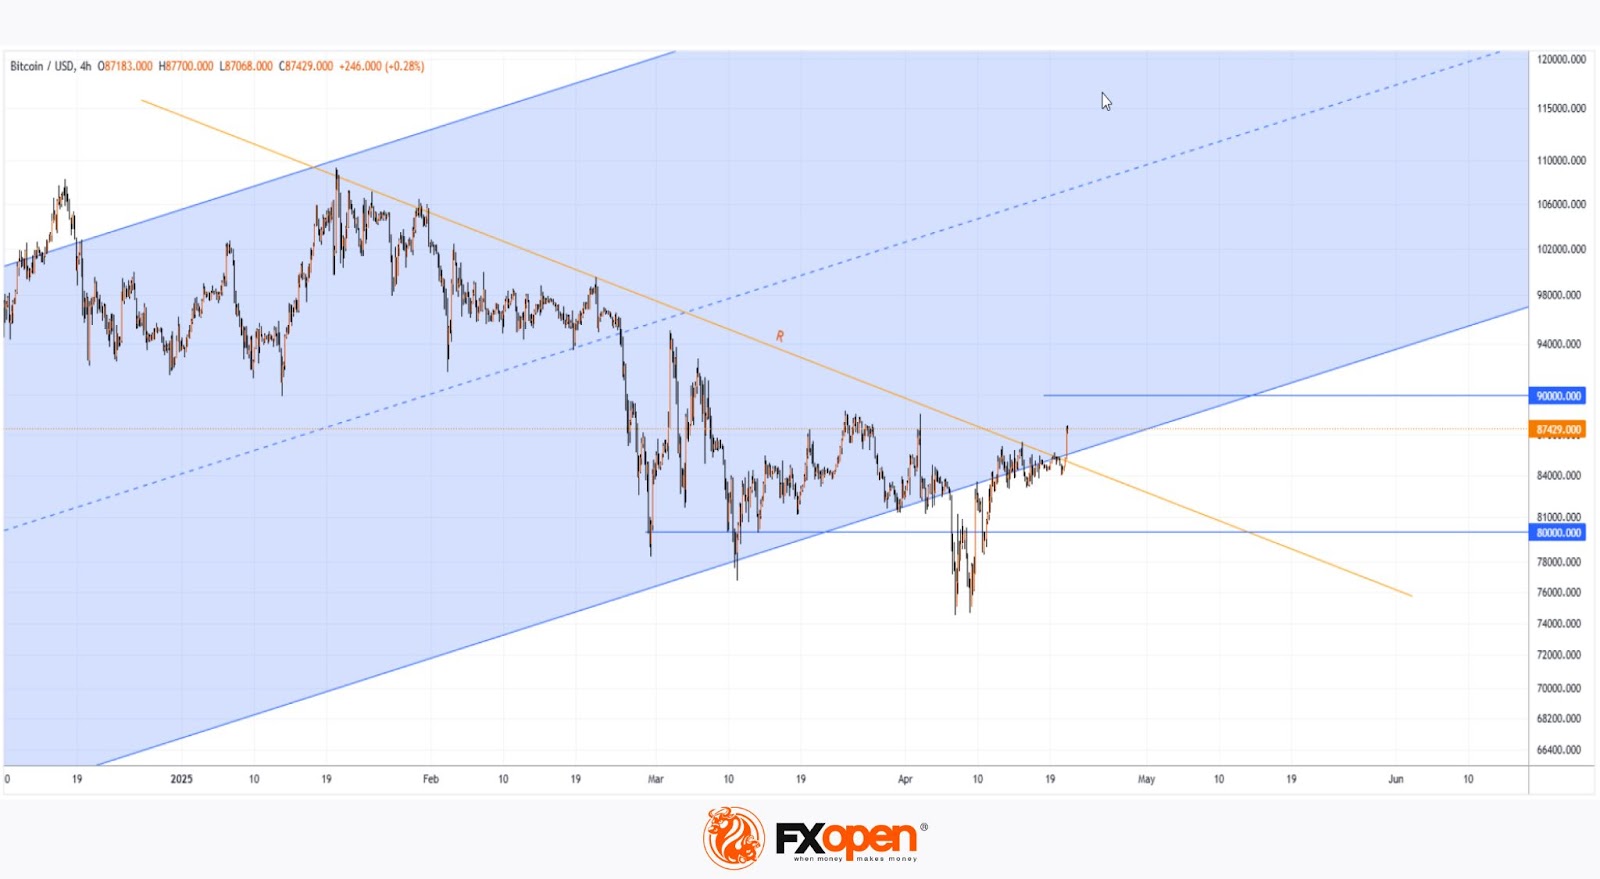
Currently, Bitcoin is trading above the R resistance line, having risen on a strong bullish candle — a clear indication of demand outweighing supply. This price action reinforces the relevance of the long-term ascending channel, making the argument stronger that the bearish breakout attempt (marked with an arrow) in early April was a false move.
It’s also worth noting that the psychological level of $80K is acting as strong support — since late February, BTC has dipped below this level several times but has failed to establish itself there. A bullish attempt to challenge the $90K level before the end of the month cannot be ruled out.
Will Bitcoin continue on a bullish path? Much will depend on the fundamental backdrop — particularly factors influencing the US dollar’s performance. Notably, the US Dollar Index futures are trading at their lowest level since March 2022.
FXOpen offers the world's most popular cryptocurrency CFDs*, including Bitcoin and Ethereum. Floating spreads, 1:2 leverage — at your service. Open your trading account now or learn more about crypto CFD trading with FXOpen.
*Important: At FXOpen UK, Cryptocurrency trading via CFDs is only available to our Professional clients. They are not available for trading by Retail clients. To find out more information about how this may affect you, please get in touch with our team.
This article represents the opinion of the Companies operating under the FXOpen brand only. It is not to be construed as an offer, solicitation, or recommendation with respect to products and services provided by the Companies operating under the FXOpen brand, nor is it to be considered financial advice.
EUR/USD Hits Three-Year High as US White House Policy Concerns Mount
The EUR/USD pair surged to a fresh three-year peak on Monday, holding steady at 1.1518 amid growing unease over US economic policy.
Key Drivers Behind the EUR/USD Rally
Investors returning from the Easter break were met with renewed concerns over the US White House’s stance on the Federal Reserve and its Chair, Jerome Powell. Questions surrounding the Fed’s independence have unsettled markets, particularly after Donald Trump ramped up his criticism of Powell.
While the US President has previously threatened to dismiss Powell, legal and institutional barriers make such a move difficult. Nevertheless, Trump’s rhetoric has grown increasingly aggressive, as he pushes for swifter interest rate cuts and greater monetary policy flexibility. The Fed, however, remains caught between taming inflation and navigating a robust labour market—a delicate balancing act that has only heightened market anxiety.
These tensions compound existing worries over escalating trade conflicts and broader uncertainty surrounding the Trump administration’s economic policies. Over the weekend, Chicago Fed President Austan Goolsbee added to the unease, warning that US tariffs could dampen economic activity by summer.
Technical Analysis: EUR/USD
H4 Chart Outlook
- The pair previously consolidated around 1.1333 before breaking upward.
- After finding support at 1.1390, it formed a bullish wave towards 1.1530.
- A downward correction towards 1.1390 is now anticipated. A break below this level could extend losses to 1.1245.
- The MACD indicator supports this view, with its signal line above zero but pointing sharply downward.

H1 Chart Outlook
- The market briefly consolidated near 1.1390 before rallying to 1.1530.
- A pullback towards 1.1390 is now in focus, with a breakdown potentially opening the door to 1.1245.
- The Stochastic oscillator aligns with this scenario, hovering above 80 and poised for a decline towards 20.

Conclusion
The EUR/USD rally reflects mounting scepticism towards US policy stability, with technical indicators now hinting at a potential retracement. Traders will be watching closely for further Fed commentary and political developments that could sway the pair’s trajectory.
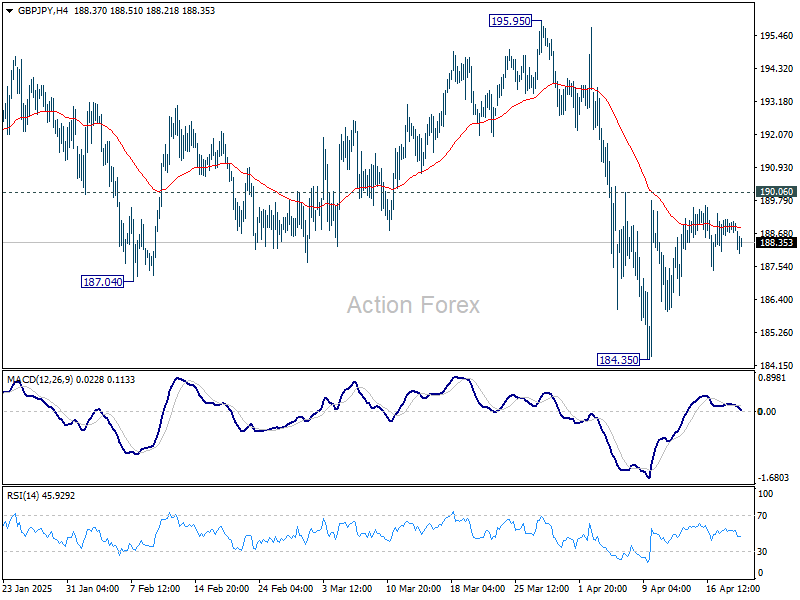
GBP/JPY Daily Outlook
Daily Pivots: (S1) 188.59; (P) 188.92; (R1) 189.33; More...
Range trading continues in GBP/JPY and intraday bias stays neutral. Risk will remain on the downside as long as 190.06 resistance holds. Below 184.35 will target 180.00 low. Nevertheless, break of 190.06 will turn bias back to the upside for stronger rebound.
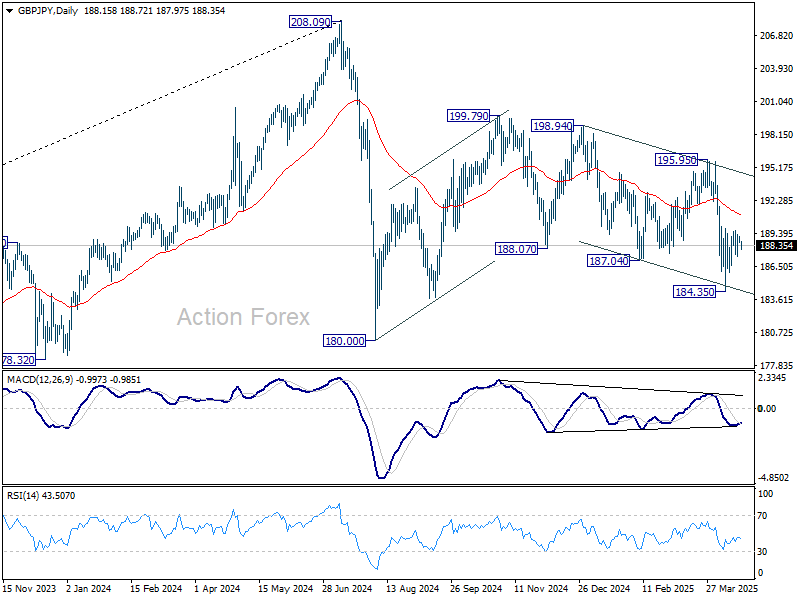
In the bigger picture, price actions from 208.09 are seen as a correction to rally from 123.94 (2020 low). Strong support should be seen from 38.2% retracement of 123.94 to 208.09 at 175.94 to contain downside. However, sustained break of 175.94 will bring deeper fall even still as a correction.
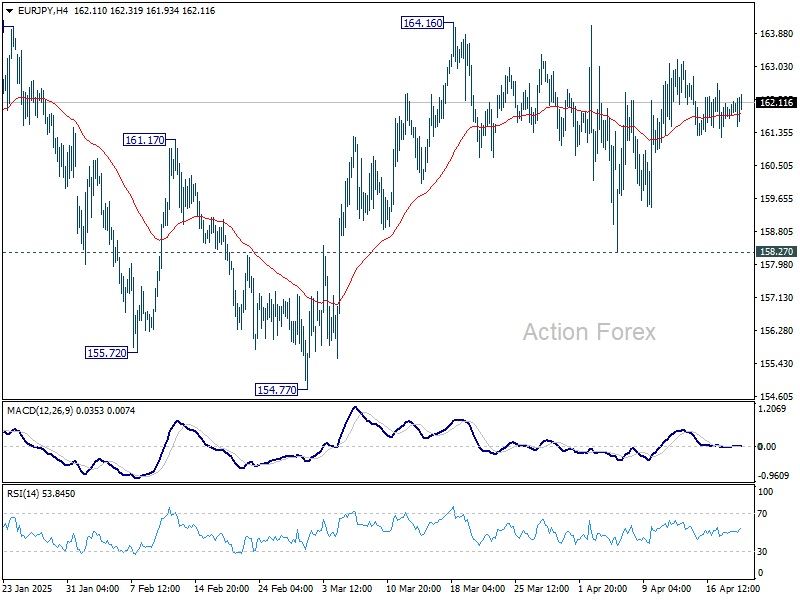
EUR/JPY Daily Outlook
Daily Pivots: (S1) 161.70; (P) 161.95; (R1) 162.21; More...
Range trading continues in EUR/JPY and intraday bias stays neutral for the moment. On the upside, above 164.16 will resume the rally from 154.77 to 164.89 resistance, and then 166.67. However, decisive break of 158.27 support will bring deeper decline back to 154.77 support. Overall, sideway consolidation pattern from 154.40 is still extending.
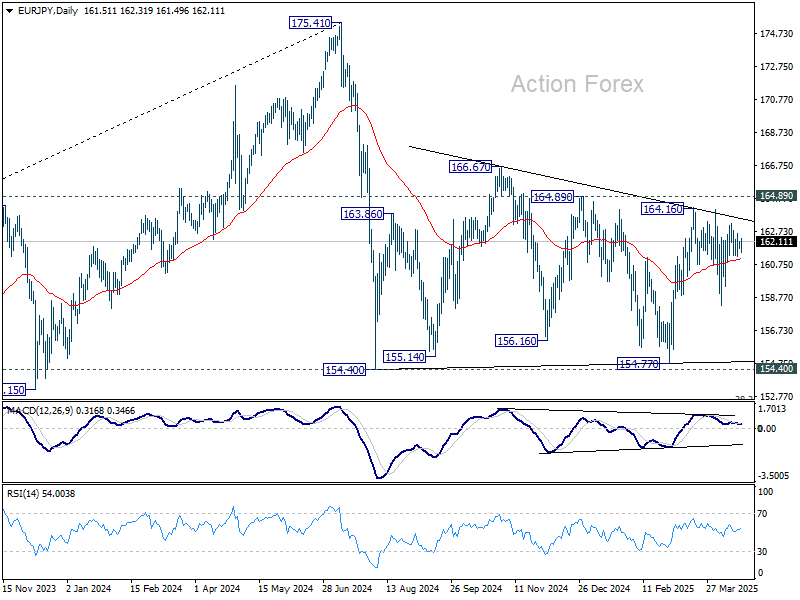
In the bigger picture, price actions from 175.41 are seen as correction to rally from 114.42 (2020 low). Strong support should be seen from 38.2% retracement of 114.42 to 175.41 at 152.11 to contain downside. However, sustained break of 152.11 will bring deeper fall even still as a correction.
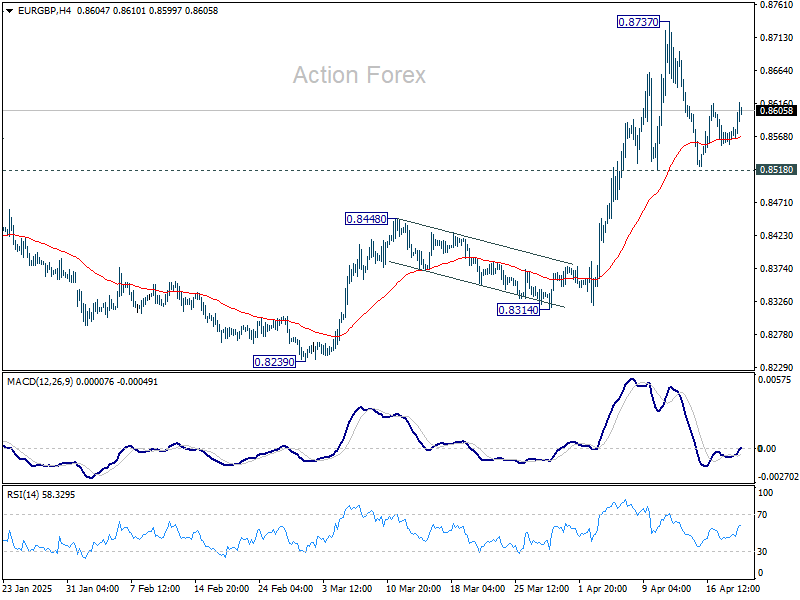
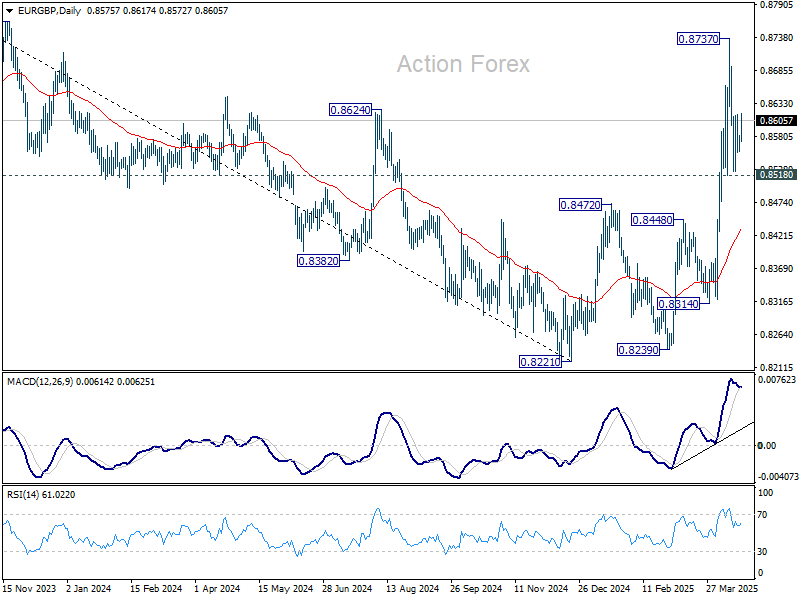
EUR/GBP Daily Outlook
Daily Pivots: (S1) 0.8558; (P) 0.8570; (R1) 0.8583; More...
Intraday bias in EUR/GBP stays neutral as consolidation from 0.8737 is still extending. Further rise is expected as long as 0.8518 support holds. On the upside, break of 0.8737 will resume the larger rally from 0.8221. However, sustained break of 0.8518 will bring deeper fall back to 55 D EMA (now at 0.8432).
In the bigger picture, down trend from 0.9267 (2022 high) should have completed at 0.8221, just ahead of 0.9201 key support (2024 low). Rise from 0.8221 is likely reversing the whole fall. Further rise should be seen to 61.8% retracement of 0.9267 to 0.8221 at 0.8867 next. This will now remain the favored case as long as 0.8472 resistance turned support holds.
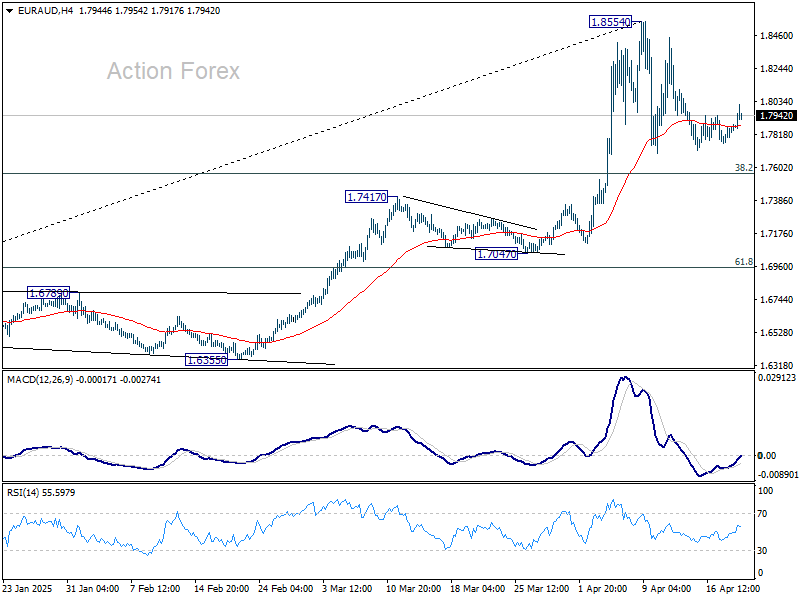
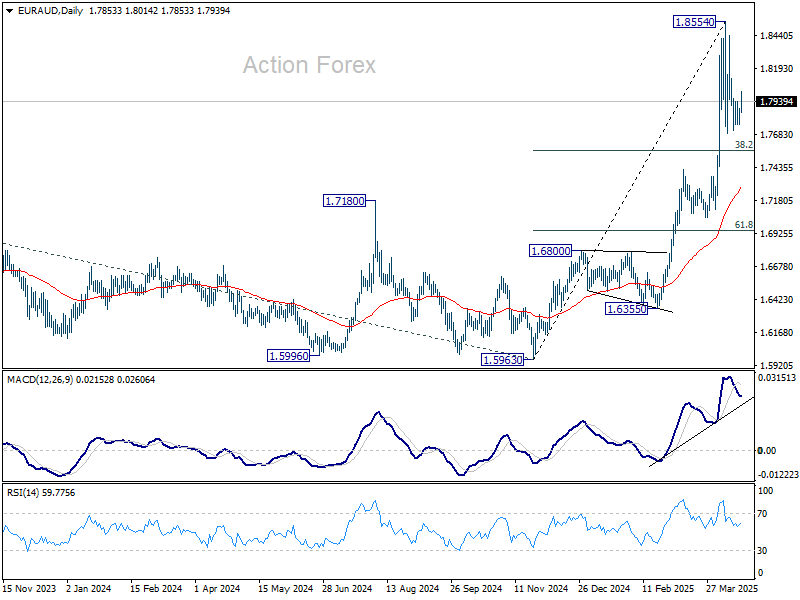
EUR/AUD Daily Outlook
Daily Pivots: (S1) 1.7803; (P) 1.7845; (R1) 1.7912; More...
EUR/AUD is still staying in consolidations below 1.8554 short term top and intraday bias remains neutral. Downside of the pull back should be contained by 38.2% retracement of 1.5963 to 1.8854 at 1.7750. On the upside, firm break of 1.8554 will resume larger up trend.
In the bigger picture, up trend from 1.4281 (2022 low) is in progress, and in reacceleration phase as seen in W MACD. Next target is 100% projection of 1.4281 to 1.7062 from 1.5963 at 1.8744. Firm break there will pave the way to 138.2% projection at 1.9806, which is close to 1.9799 (2020 high). Outlook will remain bullish as long as 1.7417 resistance turned support holds even in case of deep pullback.
EUR/CHF Daily Outlook
Daily Pivots: (S1) 0.9290; (P) 0.9308; (R1) 0.9320; More....
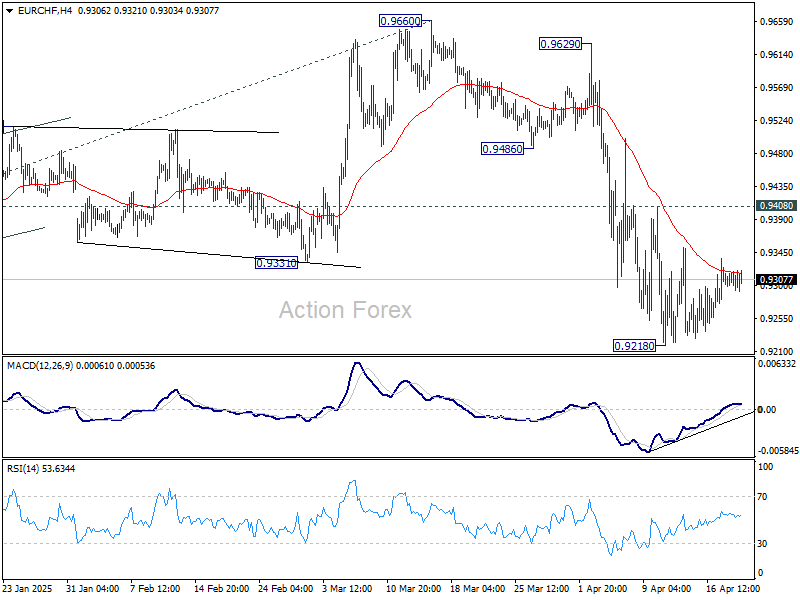
EUR/CHF is still extending consolidation from 0.9218 and intraday bias stays neutral at this point. Outlook will remain bearish as long as 0.9408 resistance holds. On the downside, firm break of 0.9204 low will confirm larger down trend resumption.
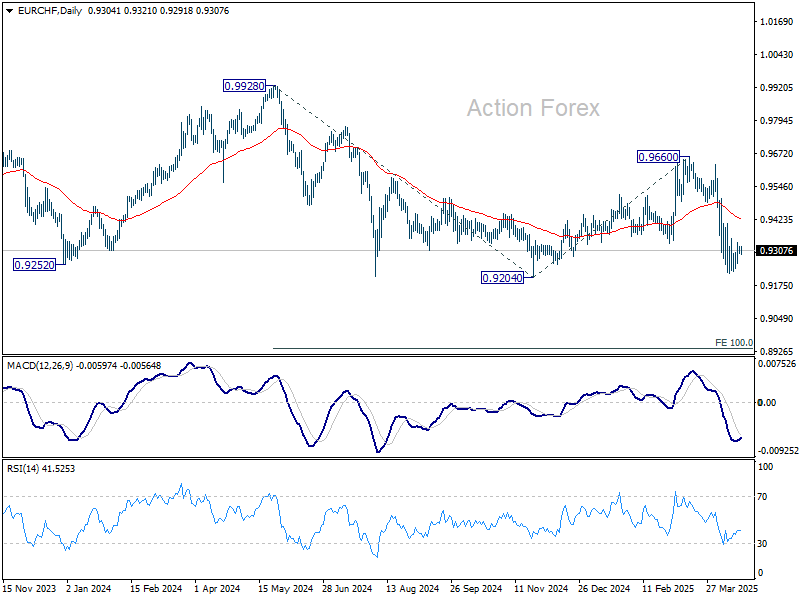
In the bigger picture, rejection by long-term falling channel resistance (now at 0.9600) retains medium term bearishness. That is, down trend from 1.2004 (2018 high) is still in progress. Firm break of 0.9204 (2024 low) will confirm resumption. Next target is 100% projection of 0.9928 to 0.9204 from 0.9660 at 0.8936.
Gold Extends Record Run, WTI Crude Oil Rebound in Tandem
Gold price started a fresh surge above the $3,250 resistance level. WTI Crude oil prices climbed higher above $60.00 and might extend gains.
Important Takeaways for Gold and WTI Crude Oil Prices Analysis Today
- Gold price started a fresh surge and traded to a new record high at $3,384 against the US Dollar.
- A key bullish trend line is forming with support at $3,322 on the hourly chart of gold at FXOpen.
- WTI Crude oil prices started a recovery wave above the $60.00 and $61.50 resistance levels.
- There was a break below a connecting bullish trend line with support at $63.00 on the hourly chart of XTI/USD at FXOpen.
Gold Price Technical Analysis
On the hourly chart of Gold at FXOpen, the price formed a base near the $3,200 zone. The price started a steady increase above the $3,250 and $3,280 resistance levels.
There was a decent move above the 50-hour simple moving average and $3,350. The bulls pushed the price above the $3,380 resistance zone. A new record high was formed near $3,384 and the price is now consolidating gains.
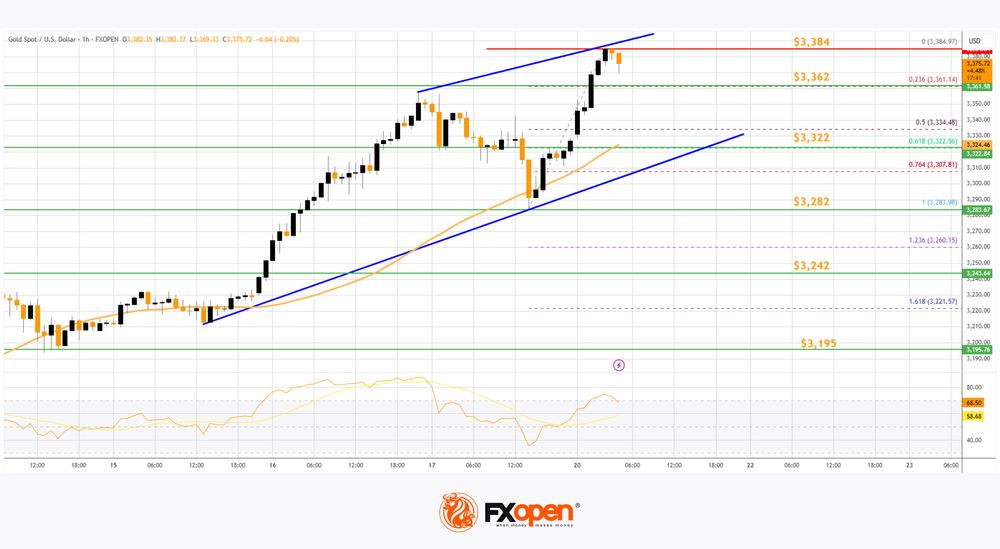
On the downside, immediate support is near the $3,362 level and the 23.6% Fib retracement level of the upward move from the $3,283 swing low to the $3,384 high.
The next major support sits at $3,322. There is also a key bullish trend line forming with support at $3,322. It is near the 61.8% Fib retracement level of the upward move from the $3,283 swing low to the $3,384 high.
A downside break below the trend line support might send the price toward the $3,282 support. Any more losses might send the price toward the $3,242 support zone.
Immediate resistance is near the $3,384 level. The next major resistance is near the $3,388 level. An upside break above the $3,388 resistance could send Gold price toward $3,500. Any more gains may perhaps set the pace for an increase toward the $3,520 level.
Oil Price Technical Analysis
On the hourly chart of WTI Crude Oil at FXOpen, the price started a recovery wave from $58.40 against the US Dollar. The price gained bullish momentum after it broke the $60.00 resistance and the 50-hour simple moving average.
The bulls pushed the price above the $61.50 and $62.00 resistance levels. The recent high was formed at $64.20 and the price started a downside correction. There was a minor move below the 23.6% Fib retracement level of the upward move from the $59.87 swing low to the $64.18 high.
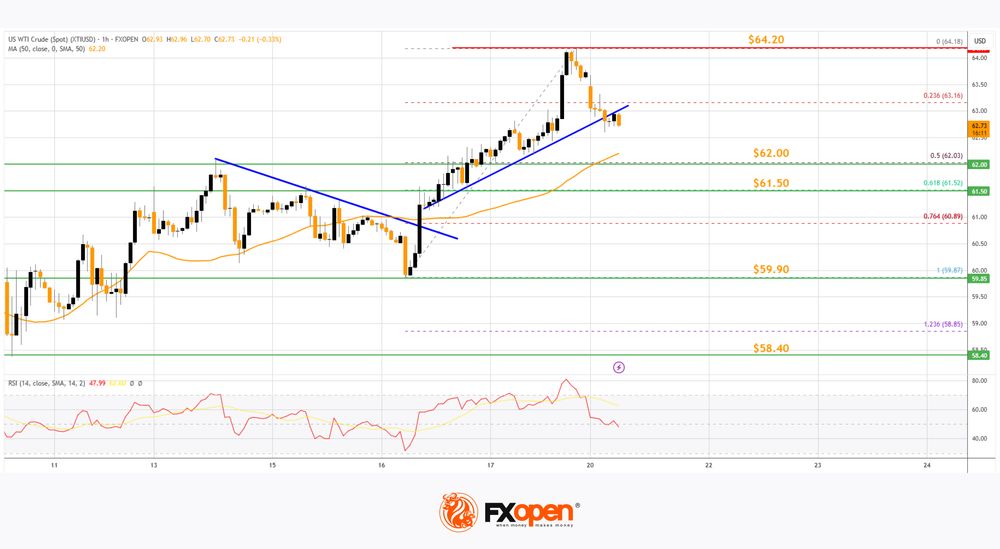
There was a break below a connecting bullish trend line with support at $63.00. The RSI is now below the 50 level. Immediate support on the downside is near the $62.0 zone or the 50% Fib retracement level of the upward move from the $59.87 swing low to the $64.18 high.
The next major support on the WTI crude oil chart is near the $61.50 zone, below which the price could test the $59.90 level. If there is a downside break, the price might decline toward $58.40. Any more losses may perhaps open the doors for a move toward the $56.20 support zone.
If the price climbs higher again, it could face resistance near $64.20. The next major resistance is near the $65.00 level. Any more gains might send the price toward the $68.50 level.
Start trading commodity CFDs with tight spreads. Open your trading account now or learn more about trading commodity CFDs with FXOpen.
This article represents the opinion of the Companies operating under the FXOpen brand only. It is not to be construed as an offer, solicitation, or recommendation with respect to products and services provided by the Companies operating under the FXOpen brand, nor is it to be considered financial advice.