
Sample Category Title
EUR/USD Skyrockets Above 1.1500 as Dollar Crumbles
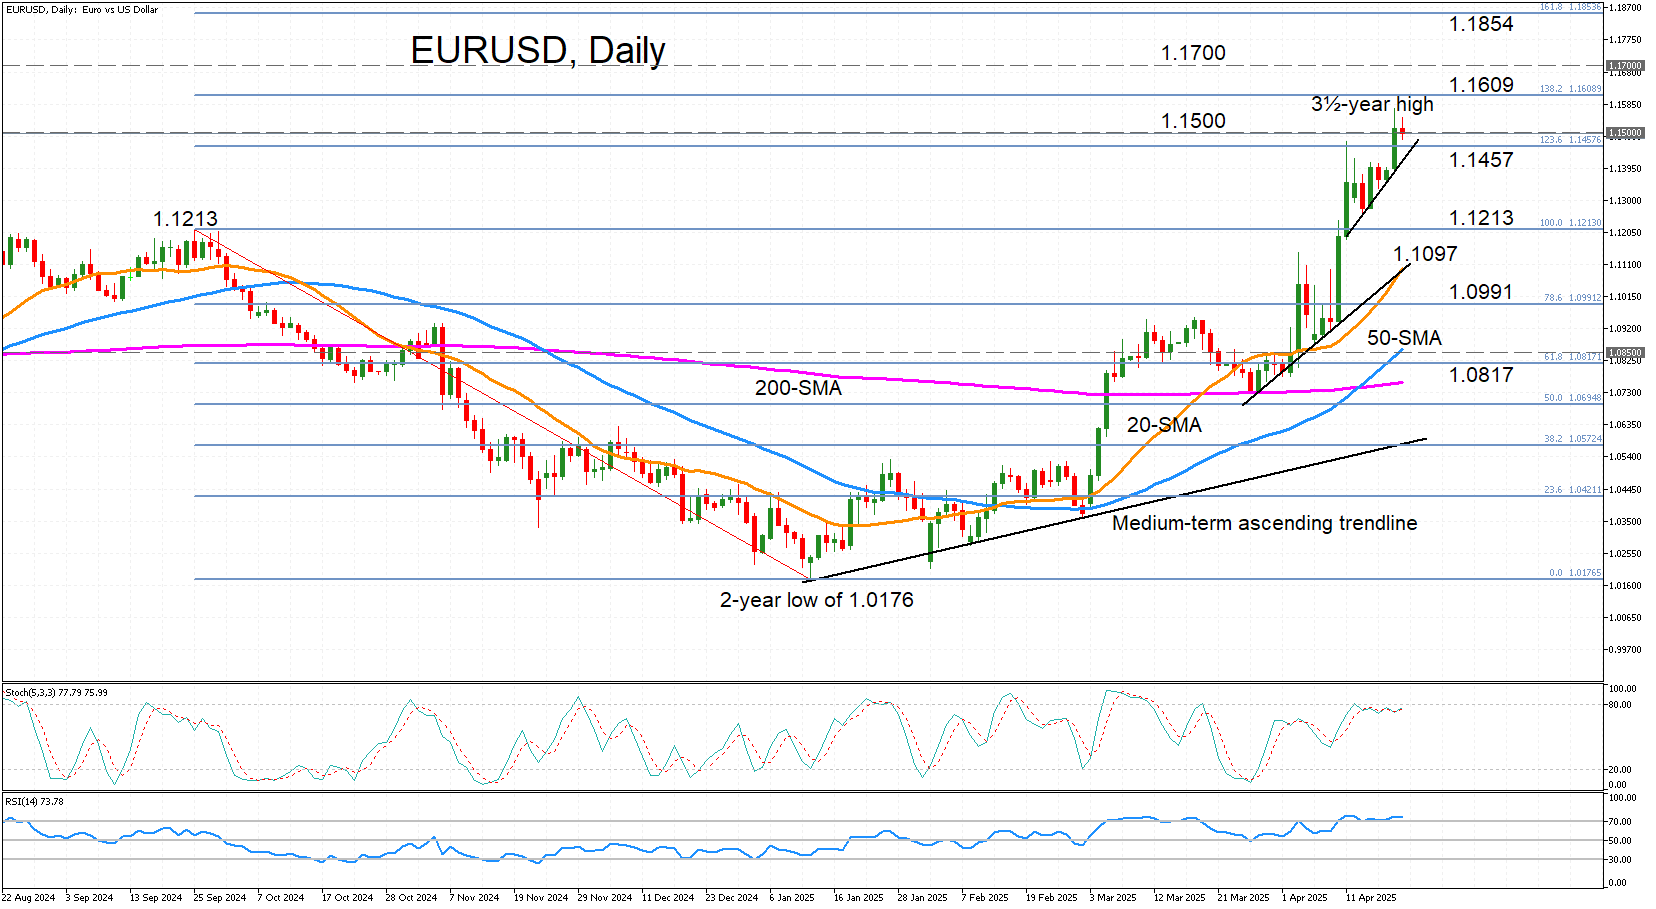
- EURUSD consolidates around 1.1500 after jumping to 3½-year high.
- Overbought conditions may limit further gains.
EURUSD broke another technical barrier on Monday, surging above the 1.1500 handle to hit a three-and-a-half-year peak of 1.1572 amid the ongoing selloff in the US currency. The dollar came under pressure again yesterday after US President Trump renewed his attack on Federal Reserve Chair Jerome Powell.
The pair is trading well above its medium-term ascending trendline, as well as its simple moving averages (SMA). But it’s unclear how sustainable this rally is in the short term, as the RSI has crossed above the 70 overbought level, while the stochastics are hovering right beneath the corresponding mark.
Should EURUSD continue its ascent, the next hurdle is the 138.2% Fibonacci extension of the September 2024-January 2025 downtrend at 1.1609. Not far higher is the 1.1700 handle, and after that, the main challenge is to overcome the 161.8% Fibonacci extension of 1.1854.
However, if bulls run out of breath, immediate support is likely to come from the most recent uptrend line, which is intersecting with the 123.6% Fibonacci extension of 1.1457. A drop lower would bring into scope the September 2024 peak of 1.1213, followed by the 20-day SMA at 1.1097. After that, there’s likely to be another major battle in the heavily congested 1.0850 region, which contains the 50-day SMA.
All in all, EURUSD is strongly bullish in the short- and medium-terms but the speed of the uptrend is subject to shift, with a near-term correction possible. A major test to the upside is the 1.1700 level, while to the downside, holding above the 20-day SMA will be key in maintaining momentum.
USD/JPY Analysis: Exchange Rate Falls Below 140 Yen per Dollar Today
As shown on the USD/JPY chart today, the exchange rate between the US dollar and Japanese yen has fallen below 140 yen per dollar – marking the first time this has occurred in 2025. Since the beginning of the year, the rate has dropped by approximately 11%.
Among the main driving factors is the White House's tariff policy, which has triggered a sell-off in US government bonds and a weakening of the dollar. One of the more recent developments includes the release of the Consumer Price Index report by the Bank of Japan, which revealed that the CPI remained steady at 2.2%, despite analysts (according to ForexFactory) forecasting a rise to 2.4%.
It’s possible that, due to the lack of inflationary pressure in Japan, the yen is in a relatively stronger position compared to the US currency, where concerns persist that trade wars and Trump’s push for lower interest rates may lead to a spike in inflation and a devaluation of the dollar.
Technical Analysis of the USD/JPY Chart
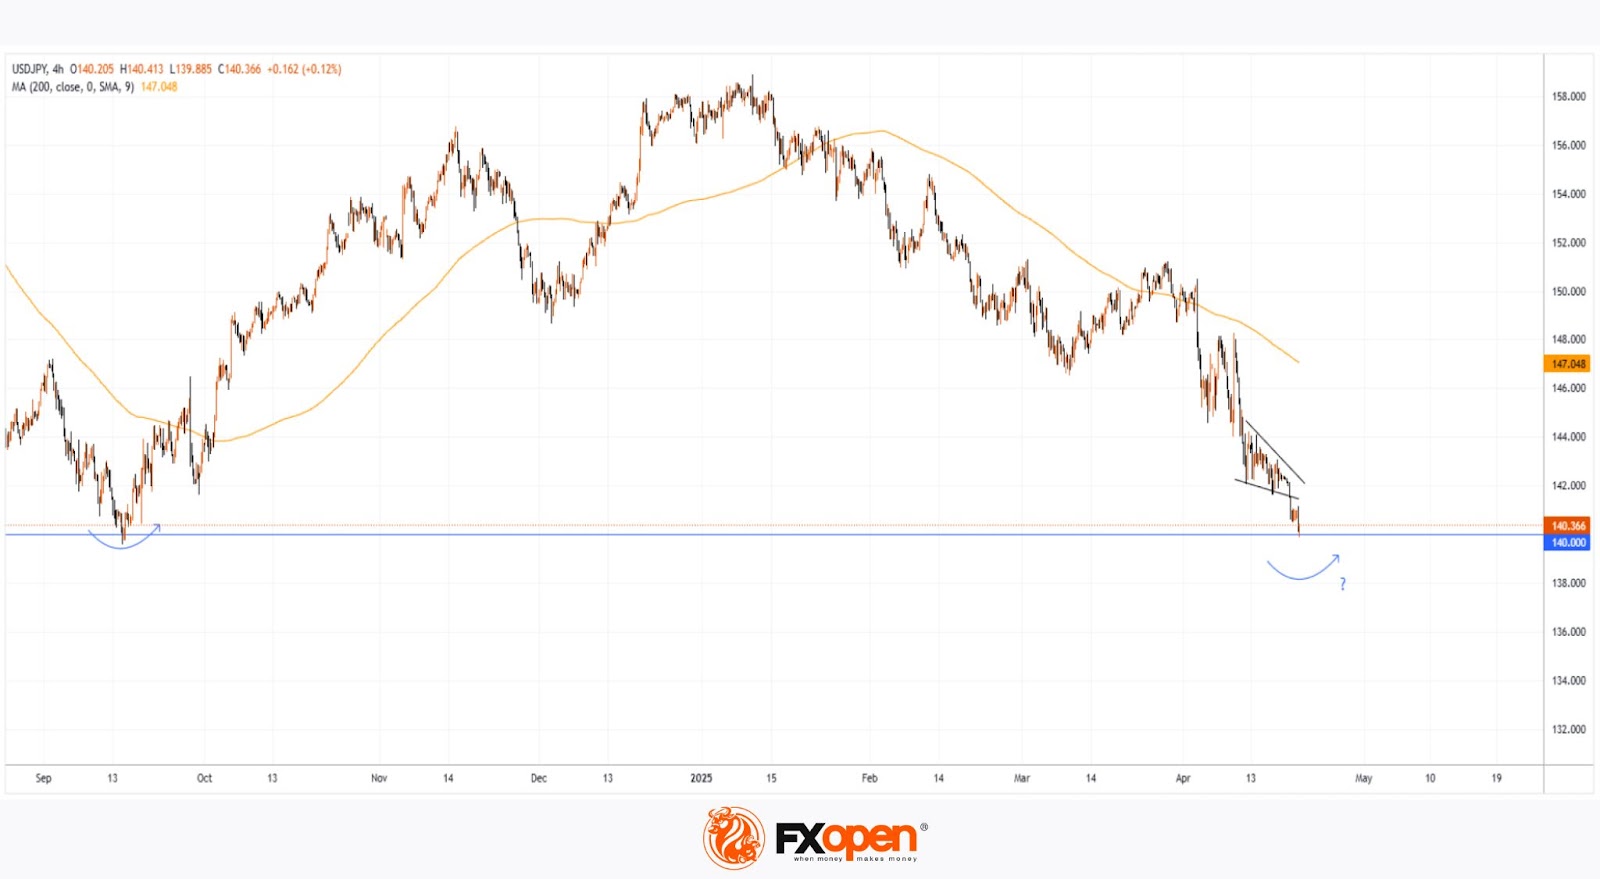
It’s worth noting that the psychological level of 140 yen per dollar has acted as key support since late 2023. On the rare occasions when the rate has dipped below this mark, the bulls have soon regained confidence, prompting a reversal.
It’s quite possible we may witness a similar attempt on the USD/JPY chart in the coming weeks or even days. However, the current outlook remains bearish, as the price has broken below the Descending Wedge pattern (marked with black lines), indicating that supply is outweighing demand.
Trade over 50 forex markets 24 hours a day with FXOpen. Take advantage of low commissions, deep liquidity, and spreads from 0.0 pips. Open your FXOpen account now or learn more about trading forex with FXOpen.
This article represents the opinion of the Companies operating under the FXOpen brand only. It is not to be construed as an offer, solicitation, or recommendation with respect to products and services provided by the Companies operating under the FXOpen brand, nor is it to be considered financial advice.
Questions Around Fed Independence and Tariffs Weigh on Sentiment, Eurozone Consumer Confidence Ahead
Asian stocks struggled on Tuesday as investors moved away from U.S. assets, weakening Wall Street and the dollar. Worries about the Federal Reserve's independence also added more stress to Treasuries.
The Dollar index was on track for a fourth day of losses as little progress in tariff negotiations continued to weigh on sentiment.
President Donald Trump’s sharp criticism of Fed Chair Jerome Powell for not lowering interest rates led to Wall Street dropping about 2.4% on Monday, with the dollar falling to its lowest level in three years.
Gold prices hit new highs due to worries about the Federal Reserve's independence. A sign of risk sentiment is reflected in oil and other risk assets which are struggling.
Currency Strength Chart, Strongest - Weakest: JPY, CAD, GBP, AUD, NZD, USD, EUR, CHF
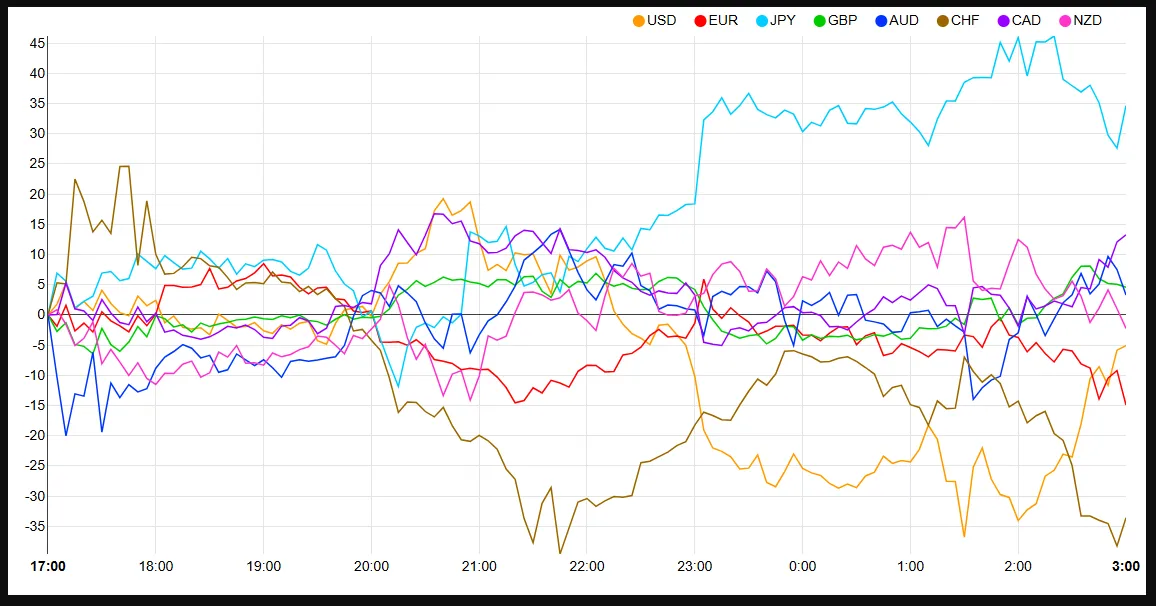
Source: FinancialJuice
Trade tensions between the US and China remain in limbo for now. Developments are slow as China's Xi Jinping warned other countries against making deals that would harm China.
A high-level Japanese team will deliver a letter from Prime Minister Ishiba to Chinese President Xi this week, showing efforts to ease tensions between the US and China.
A poll shows that Trump’s tariff campaign is already affecting Japanese companies, with about 10% saying it has impacted their business and more worried about future disruptions.
Looking at sentiment heading into the European Open and markets remain cautious. European Futures are indicating a weak open but the DAX is up 0.40% at the time of writing.
Economic data releases
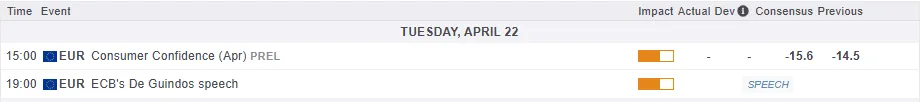
From a data perspective, the major event for the European session will be the Eurozone Consumer Confidence Flash.
For all market-moving economic releases and events, see the MarketPulse Economic Calendar. (click to enlarge)
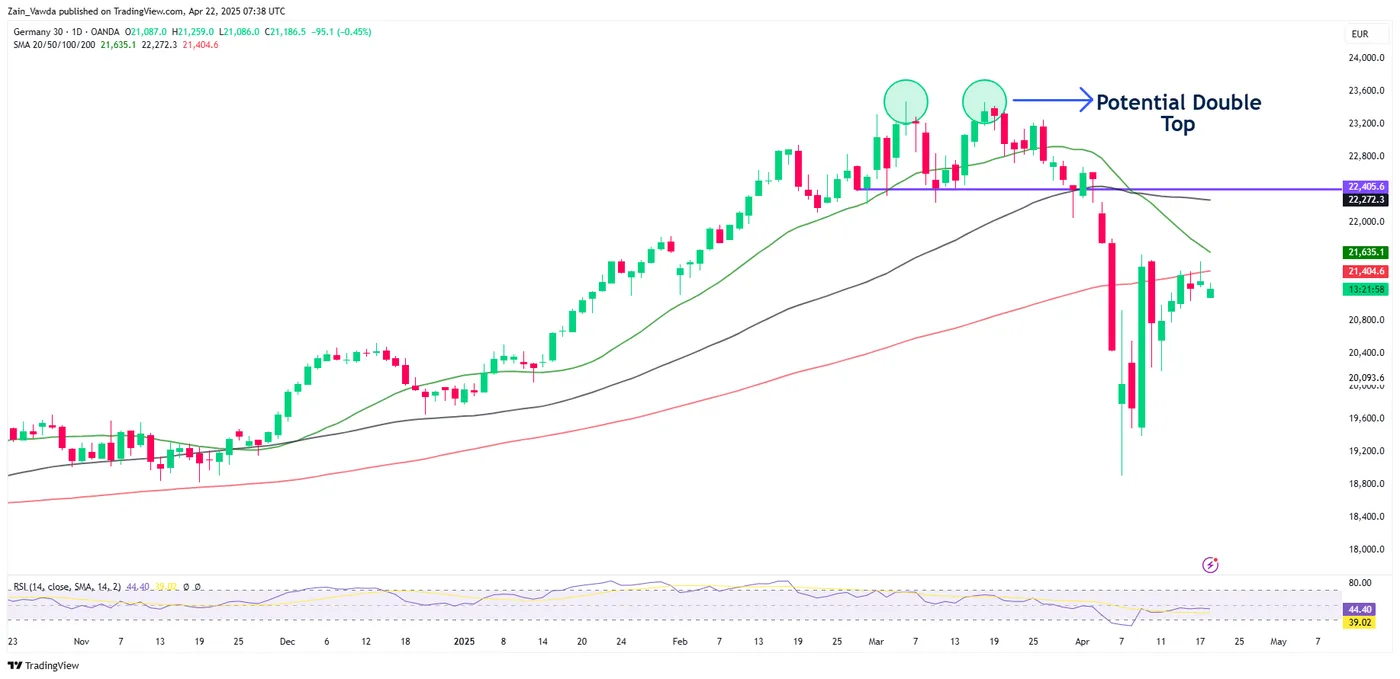
Chart of the day - DAX
From a technical standpoint, the DAX is back at the 200-day MA with another rejection yesterday.
The index is up in early trade but given the sentiment in play, a break of the 200-day MA may be a challenge.
However, the more times the DAX tests the 200-day MA the greater the chance of a breakthrough and a push higher.
Looking at the MAs it does appear that a death cross is developing as the 20-day MA eyes a cross below the 200-day MA.
The RSI remains below the 50 neutral level meaning that the bearish momentum remains in play.
Source: TradingView.com (click to enlarge)
Support
- 21000
- 20190
- 19491
Resistance
- 21404
- 21635
- 22000
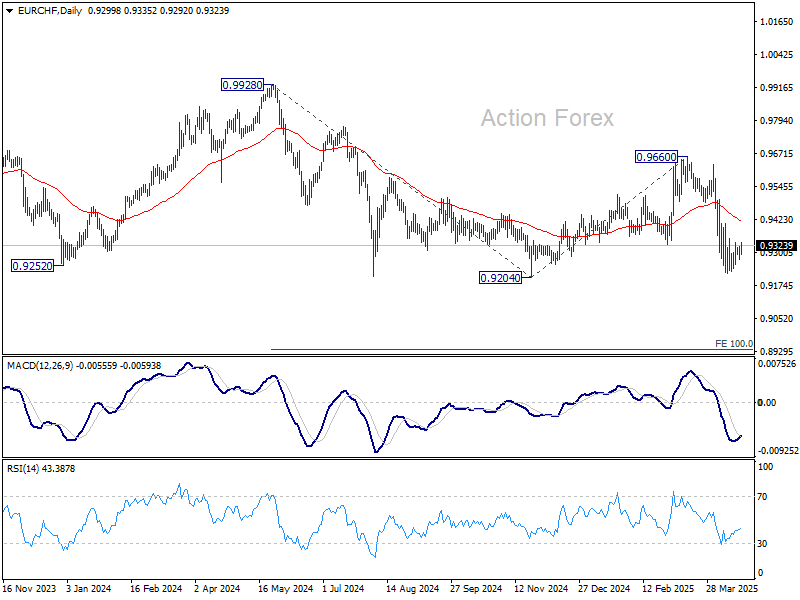
EUR/CHF Daily Outlook
Daily Pivots: (S1) 0.9283; (P) 0.9307; (R1) 0.9339; More....
Intraday bias in EUR/CHF remains neutral as consolidation continues above 0.9218 short term bottom. Outlook will remain bearish as long as 0.9408 resistance holds. On the downside, firm break of 0.9204 low will confirm larger down trend resumption.
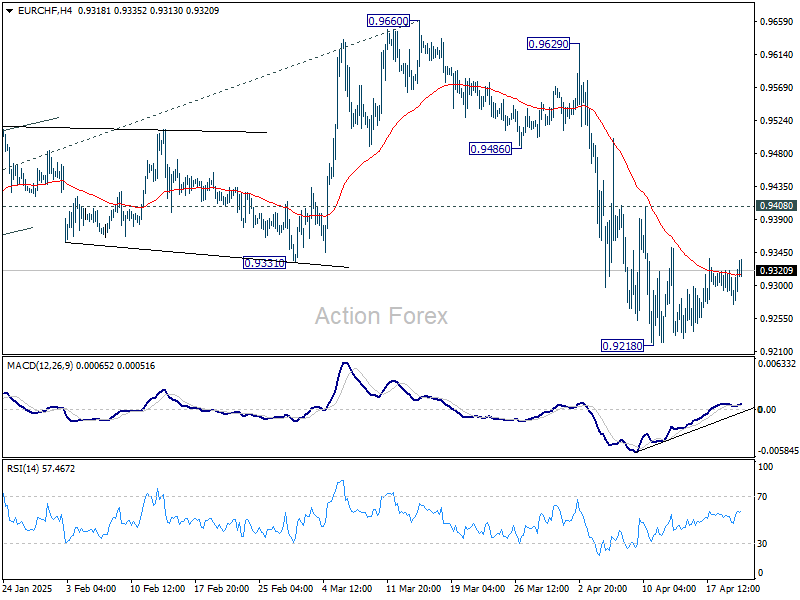
In the bigger picture, rejection by long-term falling channel resistance (now at 0.9600) retains medium term bearishness. That is, down trend from 1.2004 (2018 high) is still in progress. Firm break of 0.9204 (2024 low) will confirm resumption. Next target is 100% projection of 0.9928 to 0.9204 from 0.9660 at 0.8936.
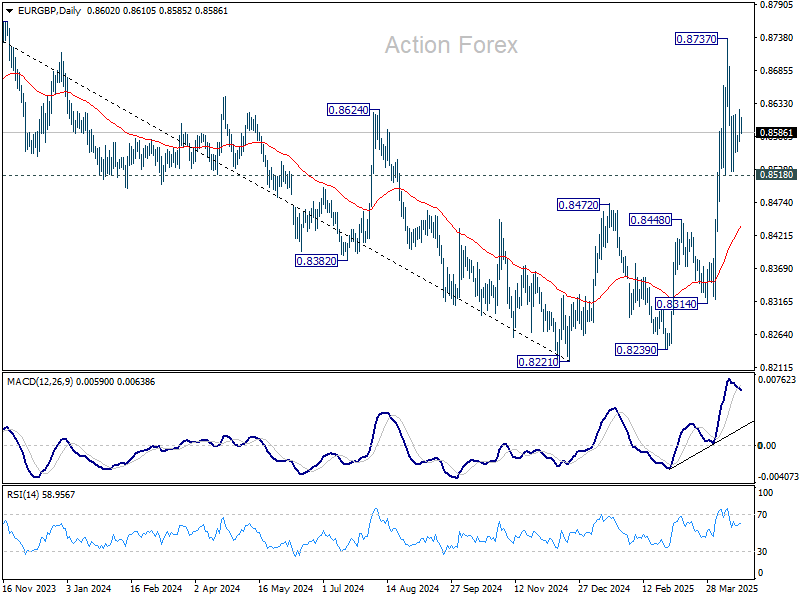
EUR/GBP Daily Outlook
Daily Pivots: (S1) 0.8580; (P) 0.8602; (R1) 0.8626; More...
EUR/GBP is staying in consolidation below 0.8737 short term top and intraday bias remains neutral. Further rise is expected as long as 0.8518 support holds. On the upside, break of 0.8737 will resume the larger rally from 0.8221. However, sustained break of 0.8518 will bring deeper fall back to 55 D EMA (now at 0.8438).
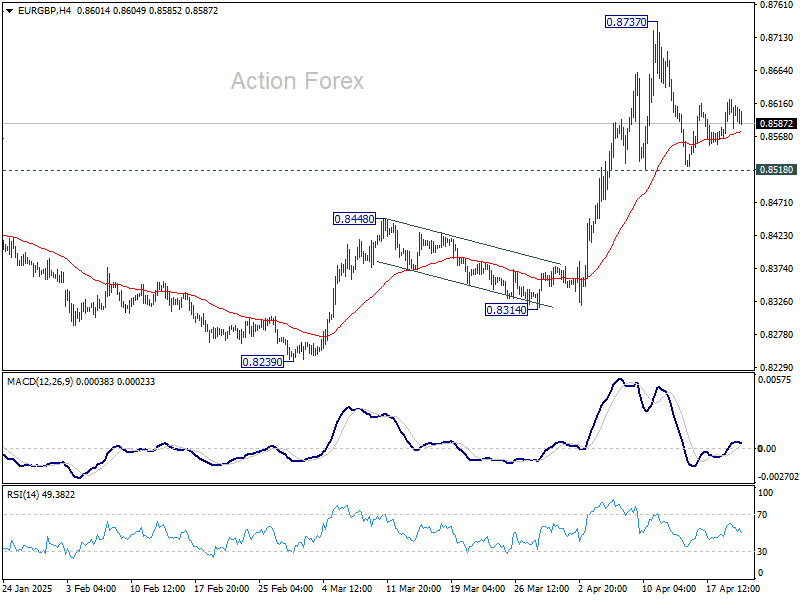
In the bigger picture, down trend from 0.9267 (2022 high) should have completed at 0.8221, just ahead of 0.9201 key support (2024 low). Rise from 0.8221 is likely reversing the whole fall. Further rise should be seen to 61.8% retracement of 0.9267 to 0.8221 at 0.8867 next. This will now remain the favored case as long as 0.8472 resistance turned support holds.
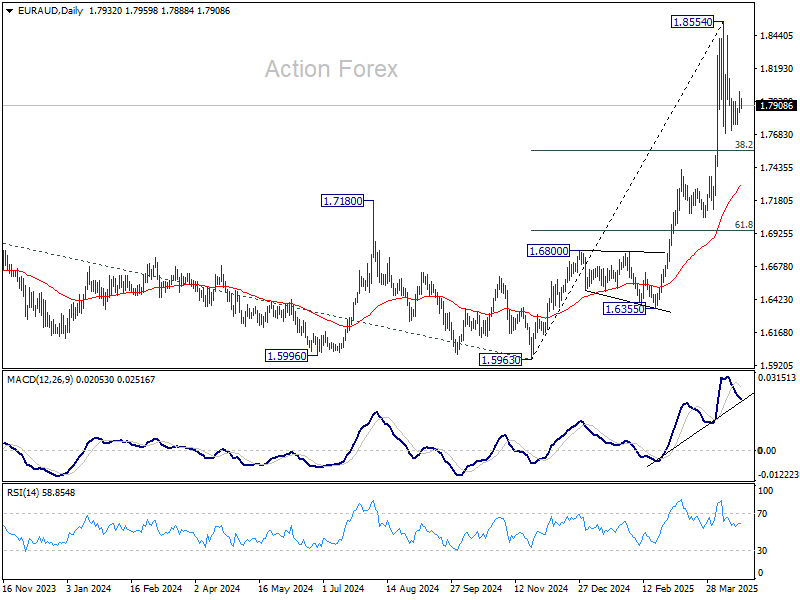
EUR/AUD Daily Outlook
Daily Pivots: (S1) 1.7870; (P) 1.7943; (R1) 1.8017; More...
Intraday bias in EUR/AUD remains neutral as consolidations continue below 1.8554 short term top. Downside of the pull back should be contained by 38.2% retracement of 1.5963 to 1.8854 at 1.7750. On the upside, firm break of 1.8554 will resume larger up trend.
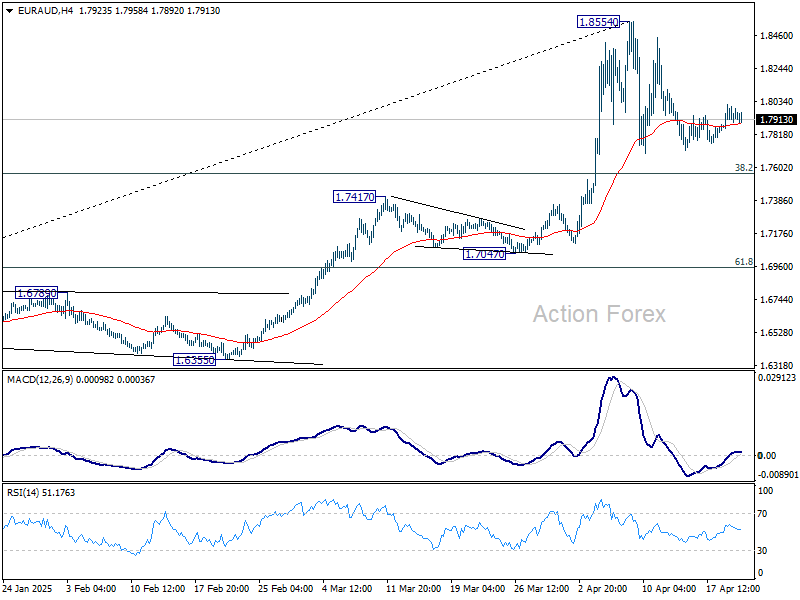
In the bigger picture, up trend from 1.4281 (2022 low) is in progress, and in reacceleration phase as seen in W MACD. Next target is 100% projection of 1.4281 to 1.7062 from 1.5963 at 1.8744. Firm break there will pave the way to 138.2% projection at 1.9806, which is close to 1.9799 (2020 high). Outlook will remain bullish as long as 1.7417 resistance turned support holds even in case of deep pullback.
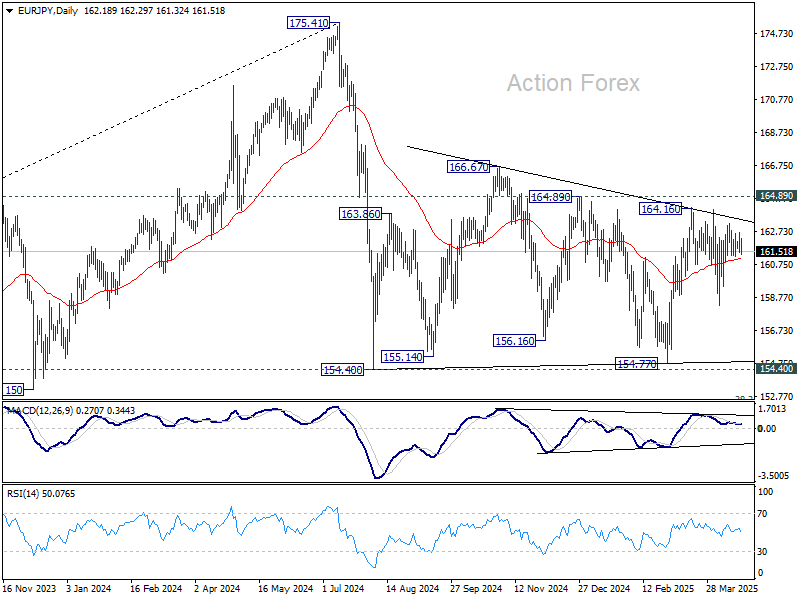
EUR/JPY Daily Outlook
Daily Pivots: (S1) 161.62; (P) 162.15; (R1) 162.70; More...
Intraday bias in EUR/JPY remains neutral as range trading continues. On the upside, above 164.16 will resume the rally from 154.77 to 164.89 resistance, and then 166.67. However, decisive break of 158.27 support will bring deeper decline back to 154.77 support. Overall, sideway consolidation pattern from 154.40 is still extending.
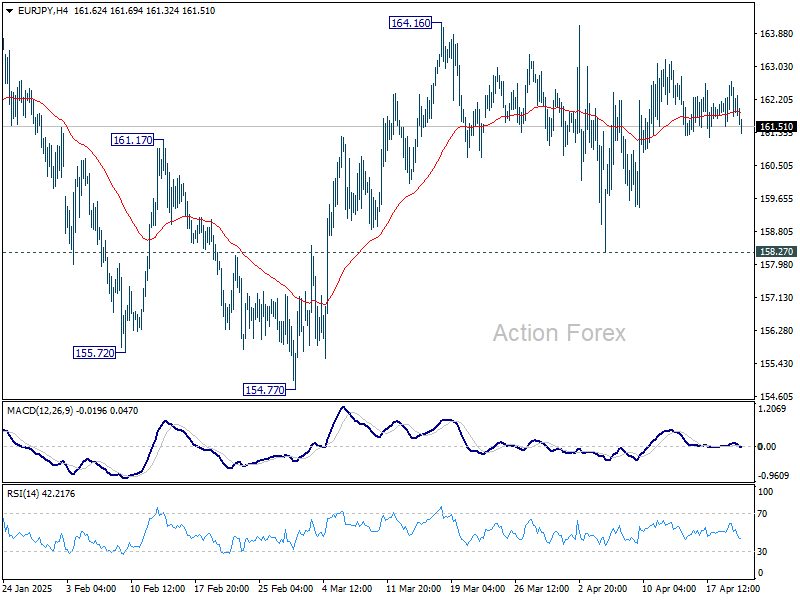
In the bigger picture, price actions from 175.41 are seen as correction to rally from 114.42 (2020 low). Strong support should be seen from 38.2% retracement of 114.42 to 175.41 at 152.11 to contain downside. However, sustained break of 152.11 will bring deeper fall even still as a correction.
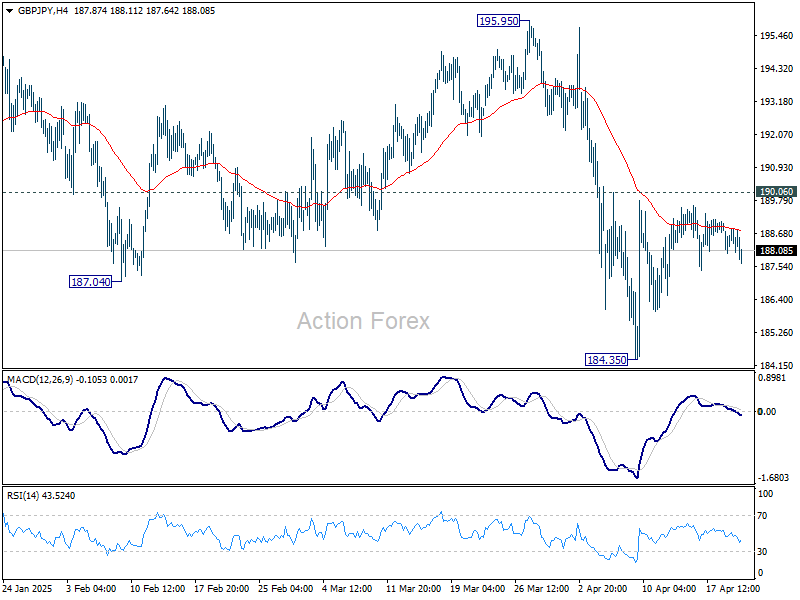
GBP/JPY Daily Outlook
Daily Pivots: (S1) 188.04; (P) 188.45; (R1) 188.88; More...
Intraday bias in GBP/JPY remains neutral as range trading continues above 184.35. Risk will remain on the downside as long as 190.06 resistance holds. Below 184.35 will target 180.00 low. Nevertheless, break of 190.06 will turn bias back to the upside for stronger rebound.
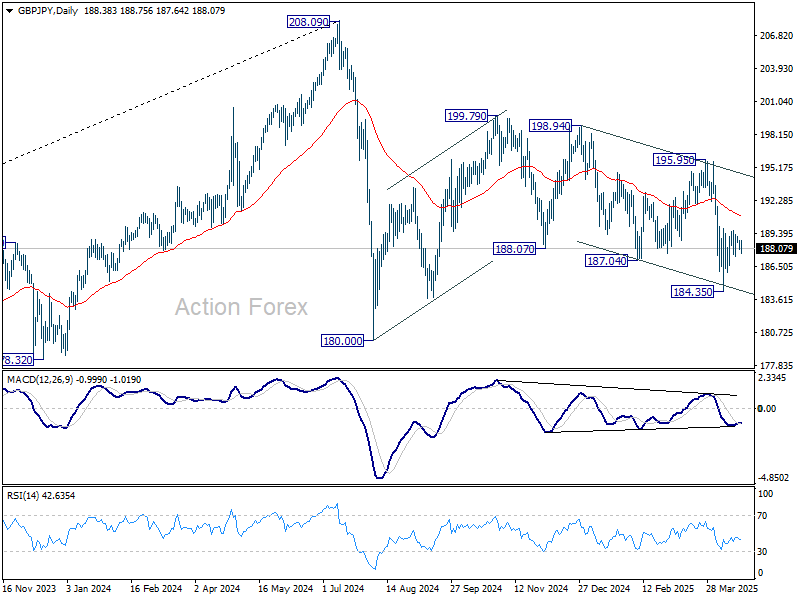
In the bigger picture, price actions from 208.09 are seen as a correction to rally from 123.94 (2020 low). Strong support should be seen from 38.2% retracement of 123.94 to 208.09 at 175.94 to contain downside. However, sustained break of 175.94 will bring deeper fall even still as a correction.
Markets Apparently Assume that Fed at Some Point Will (Have to) Give in to Political Pressure
Markets
After the market chaos in the wake of the Liberation Day reciprocal tariffs announcement, president Trump and his administration now apparently (again) started a new battlefield challenging classic economic thinking/wisdom: central bank independence. Referring to the ECB rate cuts, president Trump on Thursday already indicated that Jerome Powell and the Fed are again too late and wrong not to have already cut interest rates. He reinforced that call on Monday morning as Trump assessed that there is virtually no inflation anymore in the US. At the same time, there are all kinds of rumours/headlines (including from Kevin Hassett, director of the National Economic Council) that the administration continues studying the matter of the President being able to dismiss the Fed Chair. This intensifying debate on central bank independence yesterday added a new layer of uncertainty for US markets. The US Treasury curve again steepened, with the 2-y ceding 3.6 bps. Markets apparently assume that the Fed at some point will (have to) give in to political pressure even as Fed Chair Powell last week indicated that, considering current status of the economy/labour market, the Fed still is well positioned to maintain its current wait-and-see stance, giving priority to price stability. However, the sell US trade again hit the long end of the US yield curve hard with the 30-y yield adding 10.4 bps. At 4.90%, the psychological barrier of 5.00% (often seen as a line in the sand for outright market panic) is again within reach. European (equity) markets still were closed for the Easter Long Week, but US equities again were hit hard as the cornerstone of Fed independence was seen as coming further under pressure. US equity indices declined about 2.5%. The dollar also was again in free-fall. DXY dropped below the 99.57/98.98 key support area, trading at the lowest level since end March 2022. Similar narrative for EUR/USD with the pair breaking beyond the 1.1495 February 2022 top. USD/JPY this morning is testing the 140 barrier!
This morning, Asia markets showed no clear trend after the US sell-off yesterday. European markets reopen after the long Easter weekend. A balanced ECB communication at Thursday’s policy meeting and Bunds recently profiting from safe have flows, potentially keep European bond markets well supported short-term. The eco calendar is thin today, but several Fed and ECB speakers will give their view. The US Treasury will sell $69 bln of 2-y notes, but the focus of markets evidently is at the long and of the curve. Yesterday’s breaks in several key USD cross rates including EUR/USD suggest a further slide of the US currency. The 30-y US yield nearing the 5.0% barrier only might add to further US(D) related nervousness.
News & Views
China’s Ministry of Commerce yesterday published a statement warning countries against (trade) deals with the US at the expense of China’s interests. In such scenario, Beijing ““will never accept it and will resolutely take reciprocal countermeasures. China is willing to strengthen solidarity and coordination with all parties, jointly respond and resist unilateral bullying acts.” Part of the US government’s tactics to get rid of currently paused additional tariffs include pushing other countries to curb trade with China. Sources suggest this could include imposing secondary tariffs on countries with close China ties. The US also wants them to stop absorbing excess goods from China that are being rerouted in order to escape the very high US duties. Reuters reported earlier this month that Vietnam for example is prepared to crack down on Chinese goods being shipped to the US via its territory and to tighten controls on sensitive exports to China.
Rating agency S&P raised the Greek credit rating to BBB with a stable outlook. They praised efforts to improve tax compliance, combined with resilient economic growth, which are enabling Greece to continue overperforming fiscal targets. The net debt to GDP ratio is expected to fall by an average of 6 percentage points over the next four years (to 114% in 2028). Finally, the country’s debt management agency has a significant cash position estimated at 15% of GDP which covers close to three years of upcoming debt maturities.
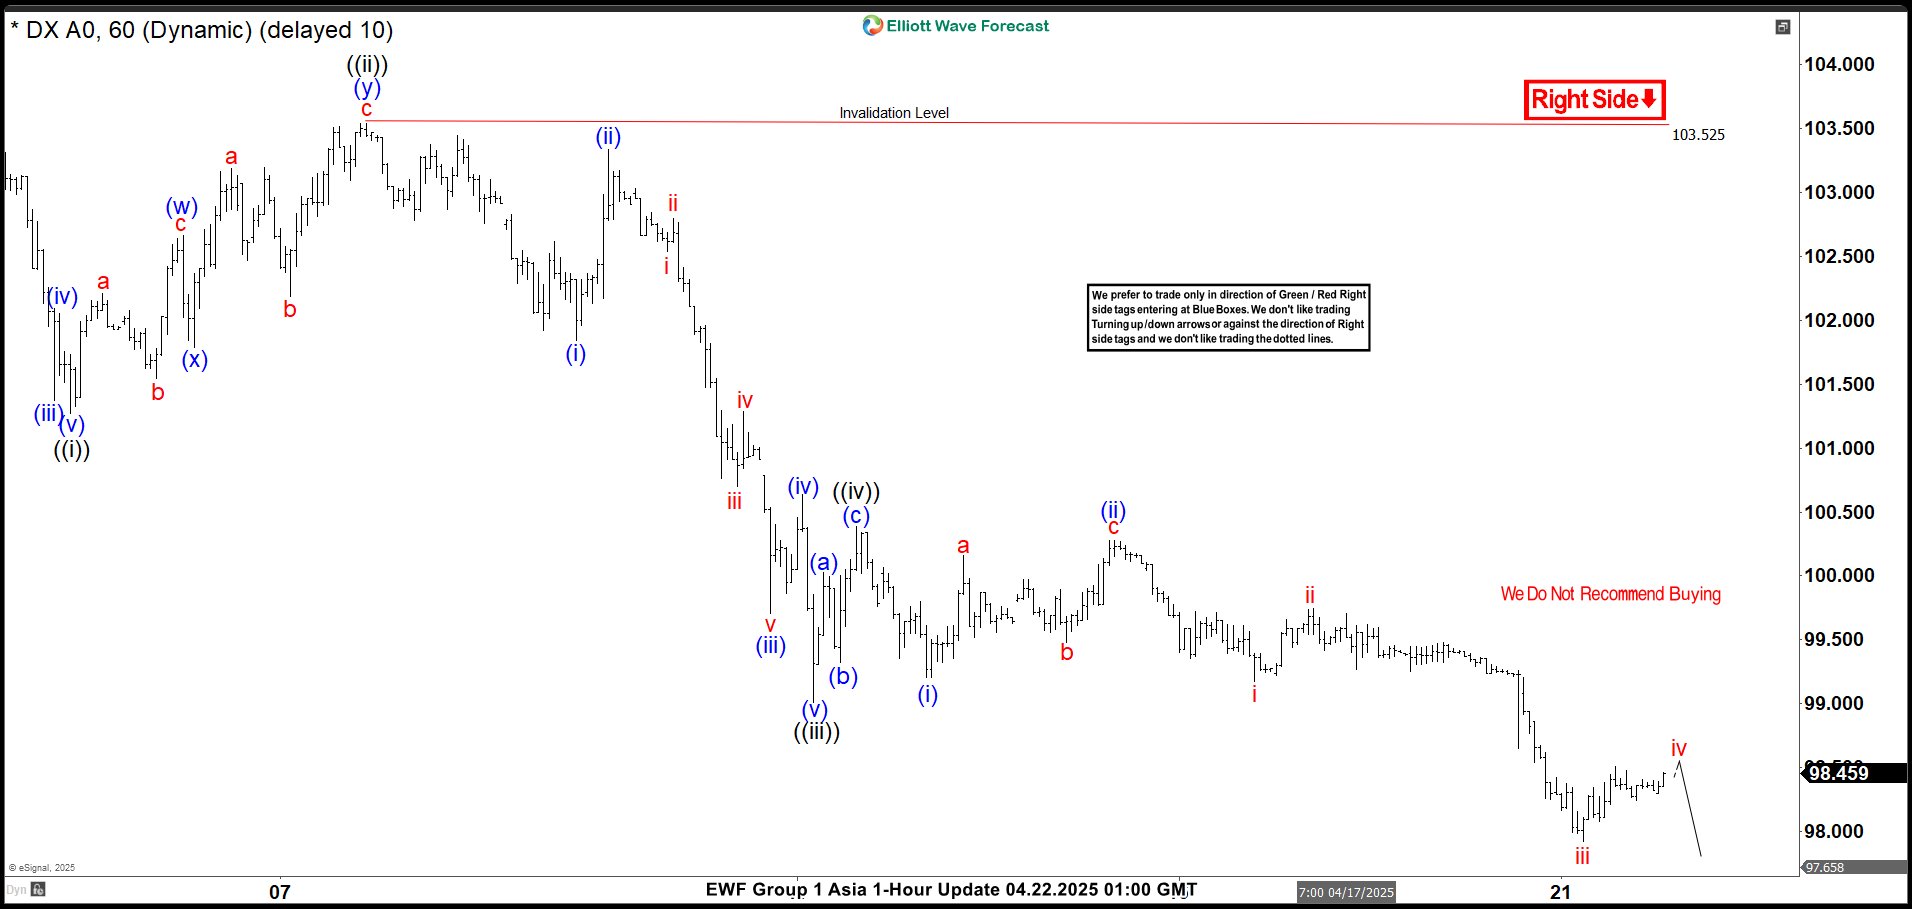
Dollar Index (DXY) Faces Continued Downtrend in Elliott Wave Bearish Pattern
The Dollar Index (DXY) has experienced a significant decline since President Trump’s tariff war intensified global trade tensions. From its peak on September 26, 2022, the Index has exhibited a clear bearish sequence. This decline aligns with an Elliott Wave structure, offering insights into potential future price action.
The current bearish sequence is unfolding as a corrective zigzag pattern, labeled ((A))-((B))-((C)). Waves ((A)) and ((B)) have completed, and the Index is now in the ((C)) leg. Wave ((C)) leg subdivides into a strong five-wave impulse to the downside. Based on Fibonacci extensions, the projected target for this decline lies between 85.5 and 94.9. This corresponds to the 100% – 161.8% Fibonacci extension levels from the prior structure. This zone represents a critical support area where buyers may attempt to step in.
In the shorter cycle, the DXY is expected to face resistance in a 3, 7, or 11-swing corrective rally. As long as the pivot at 103.5 holds, the bearish momentum should persist, driving the index toward the Fibonacci target zone. Traders should monitor these levels closely, as a break above 103.5 could invalidate the immediate bearish setup, while continued failures at resistance reinforce the downside bias.
This Elliott Wave outlook suggests the DXY remains vulnerable, with the tariff war’s ripple effects continuing to pressure the dollar. Stay vigilant for price action near the 85.5 – 94.9 range for potential reversal signals.
Dollar Index (DXY) 60 Minute Elliott Wave Chart
DXY Video
https://www.youtube.com/watch?v=z-ICC6hxQJk