Sample Category Title
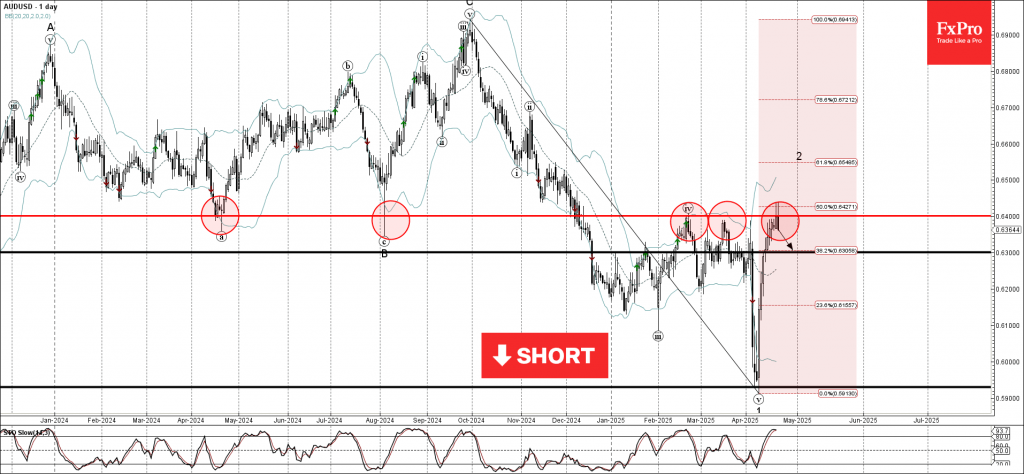
AUDUSD Wave Analysis
AUDUSD: ⬇️ Sell
- AUDUSD reversed from the key resistance level 0.6400
- Likely to fall to support level 0.6300
AUDUSD currency pair recently reversed from the resistance area between the key resistance level 0.6400 (former major support from 2024) and the 50% Fibonacci correction of the downward impulse from September.
The downward reversal from this resistance area is likely to form the daily Japanese candlesticks reversal pattern Bearish Engulfing.
Given the overbought daily Stochastic and the strength of the key resistance level 0.6400, AUDUSD currency pair can be expected to fall to the next support level 0.6300.
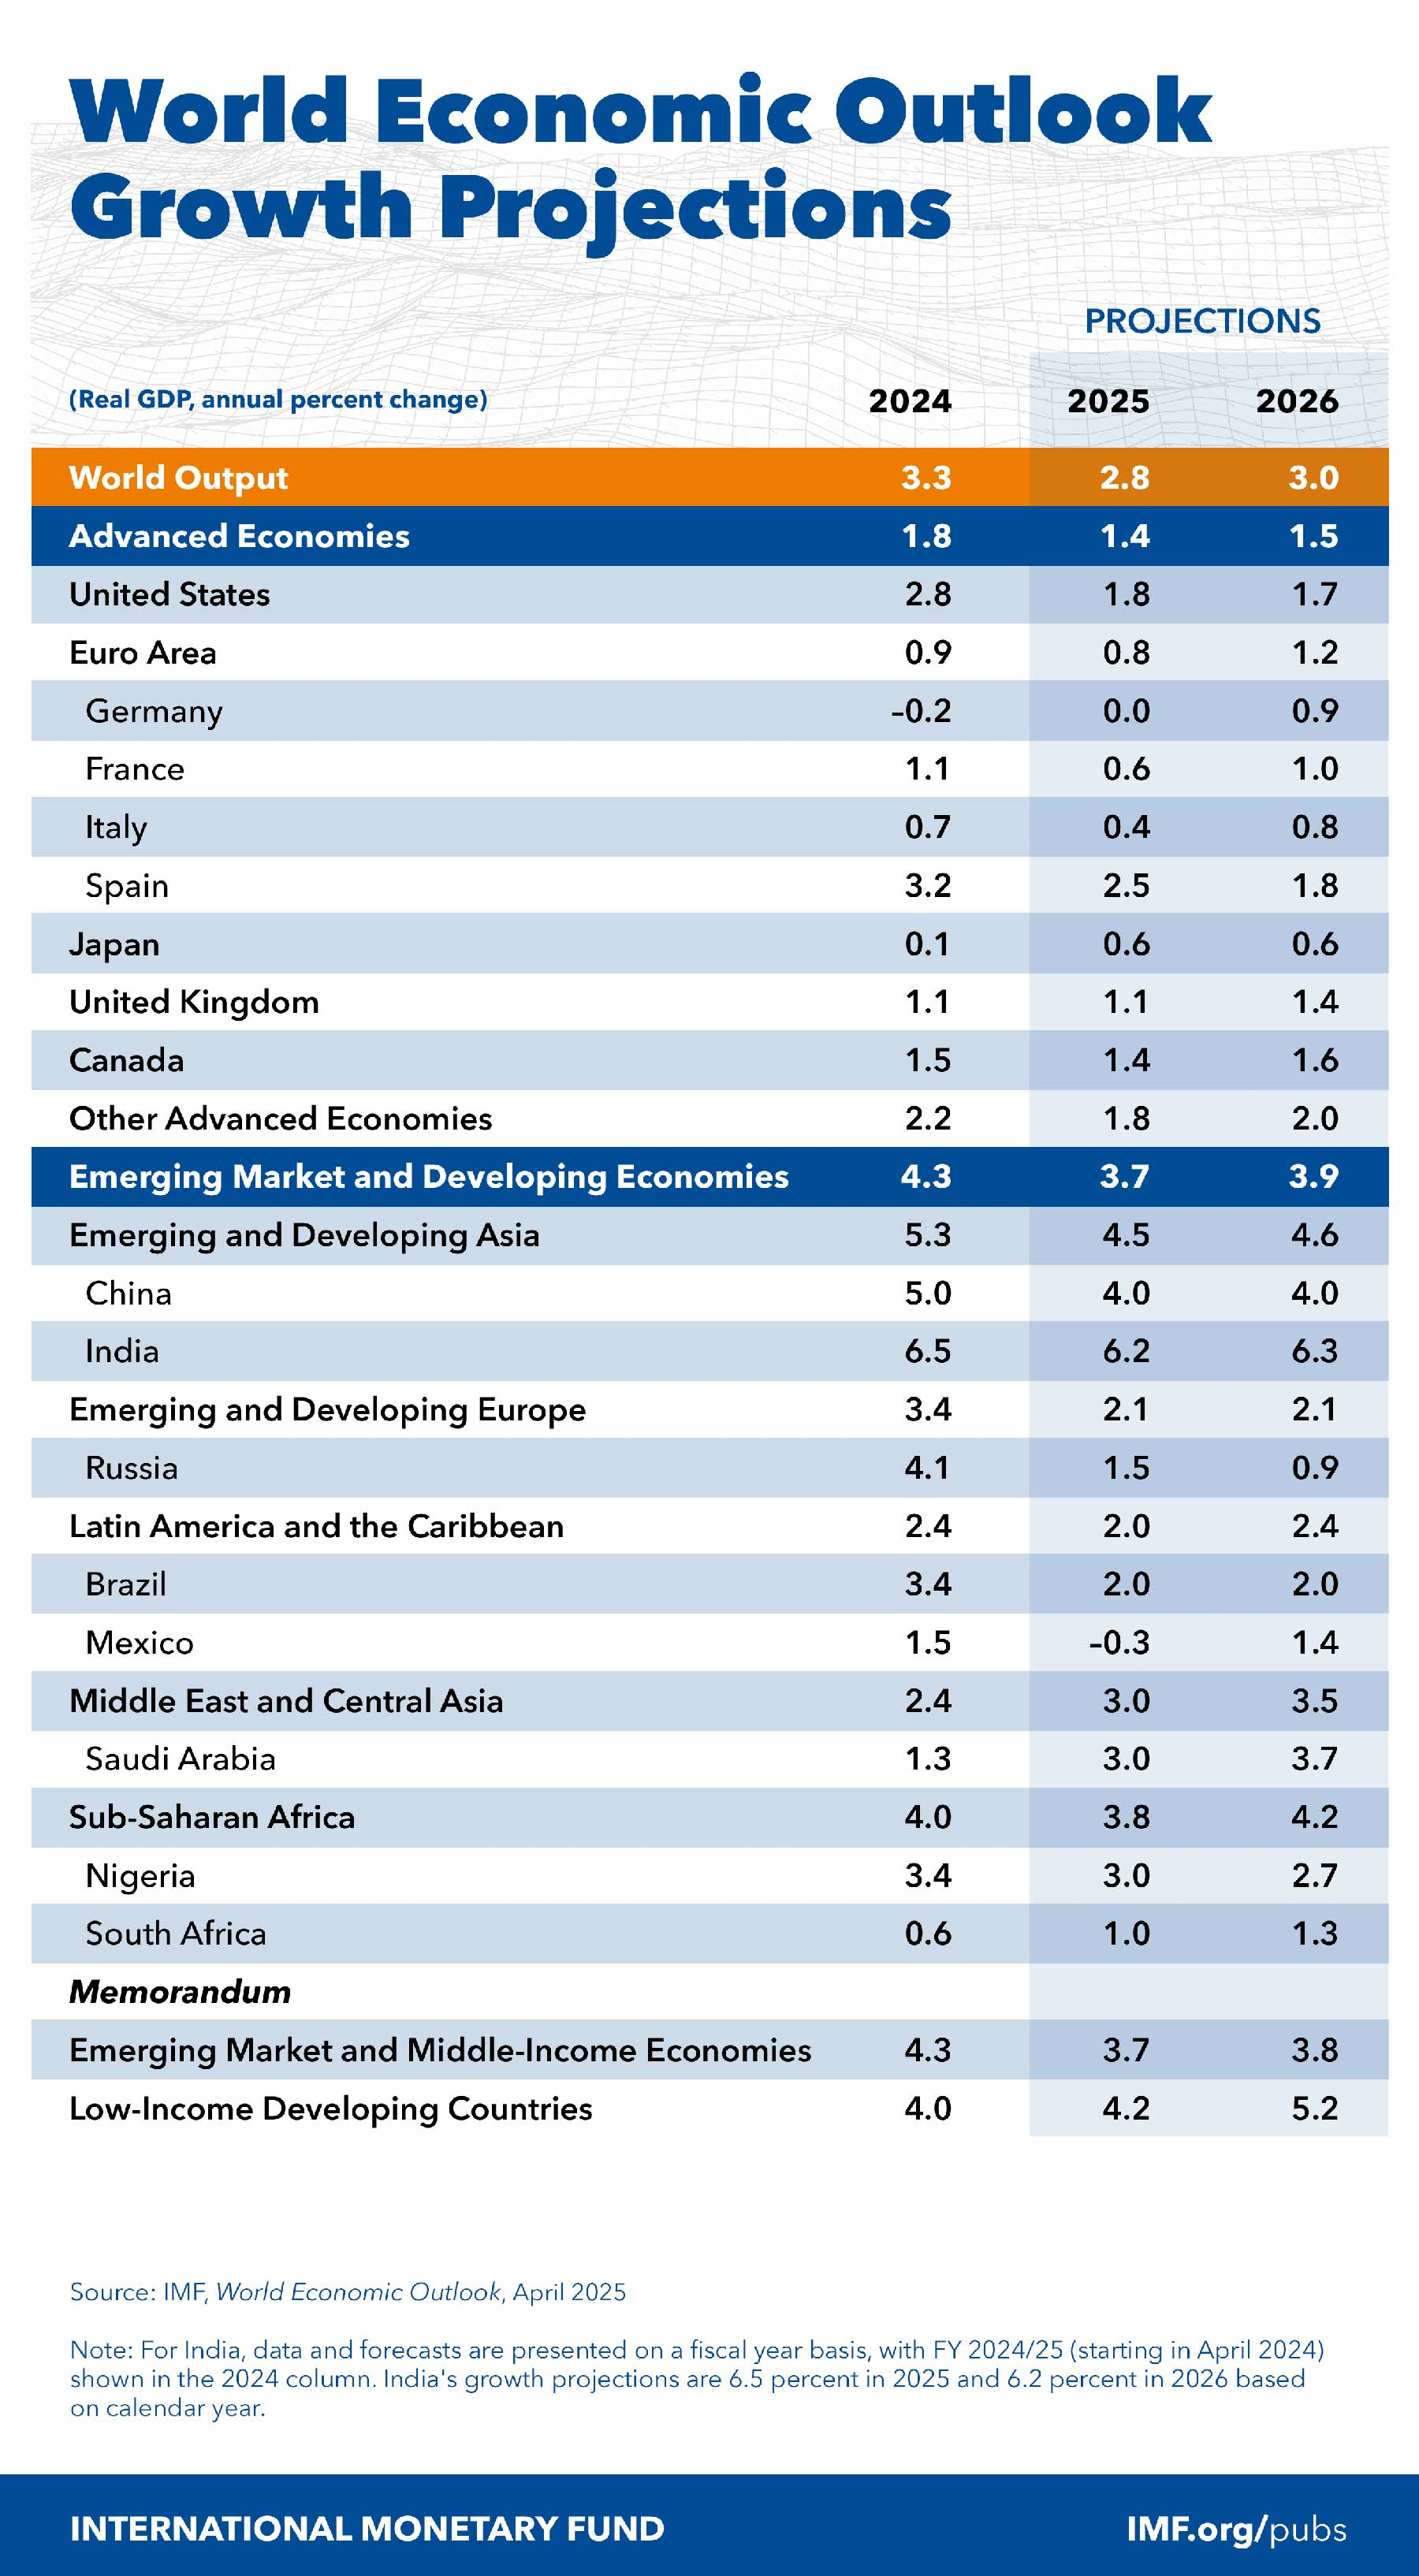
IMF slashes global growth forecast as tariffs trigger sharp downgrade
In its latest World Economic Outlook, the IMF has sharply revised down its global growth projections due to dramatic escalation in trade barriers and persistent policy uncertainty.
Global GDP is now expected to grow just 2.8% in 2025 and 3.0% in 2026, down from 3.3% for both years in the January update, marking a cumulative 0.8 percentage point downgrade. The new projections fall well below the 3.7% historical average (2000–2019), reflecting the disruptive impact of US-led tariff hikes, which have pushed effective global trade barriers to levels not seen in a century.
The IMF's “reference forecast” above incorporates all developments up to April 4, including the sweeping US tariff increase announced on April 2 and the initial retaliatory responses.
It also evaluates the scenario under more recent announcements, where the US paused most tariffs temporarily but maintained prohibitive duties on China. The report finds that this partial reprieve does not materially alter the global outlook, as overall trade restrictions between the US and China remain significantly elevated and policy-induced uncertainty continues to suppress investment and confidence.
For contrast, the IMF also presents an alternative forecast that excludes the April 2 tariff hikes. Under this more benign scenario, global growth for 2025 and 2026 would have seen only a modest 0.2 percentage point downgrade to 3.2%, highlighting the substantial damage inflicted by recent trade policy actions.
ECB’s Lagarde urges dialogue on tariffs, rejects US claims of EU trade bias
Speaking on the sidelines of the IMF-World Bank Spring Meetings, ECB President Christine Lagarde called for constructive negotiations to resolve rising US-EU trade tensions.
Addressing the recent escalation of tariff threats by US President Donald Trump, Lagarde expressed optimism that there remains room for dialogue.
“It’s in the nature of policymakers to want to sit down and argue their case,” she said, adding that identifying "red lines" and "vulnerabilities" on both sides would be essential to any successful outcome.
Lagarde pushed back against Trump’s claims that the EU treats the United States unfairly in trade, particularly due to the EU’s goods surplus. She emphasized that the transatlantic economic relationship is far more comprehensive, extending beyond goods to include services and substantial foreign direct investment flows. The broader context, she implied, should not be lost in the current tariff rhetoric.
While acknowledging that certain sectors may require tough discussions, Lagarde stressed the importance of shared economic interests. “There is so much joint interest,” she noted, emphasizing the need for “tedious, serious work” to find acceptable compromises.
Sunset Market Commentary
Markets
While European markets were closed for the Easter weekend on Friday and yesterday, US investors had to cope with an additional layer of uncertainty as the Trump administration is putting pressure on the Fed to cut rates more and sooner than they currently (communicate) are considering. Even Fed independence is again becoming a genuine source of debate. Yesterday this triggered an additional leg in the ‘sell US trade’, with US equities, the dollar and LT US Treasuries all facing strong headwinds. However, some calm returned today, or at least the pressure didn’t intensify. Probably awaiting other social media comments from the US president. In technical trading, US yields currently are changing between + 2 bps (2-y) and -4 bps (30-y). We don’t draw any firm conclusions from today’s price action yet. Even so, both at the short end of the curve (almost 3.5% Fed fund rate eoy) and at the long end of the curve (US 30-y 4.90%) quite some good/bad news should already be discounted by now, unless you take into account an extreme scenario. Whatever the consideration, markets didn’t feel the need to push further after yesterday’s US sell-off. US equities are rebounding about 1% at the open. The EuroStoxx 50 also shows some resilience (-0.25%) given yesterday’s WS sell-off. US equity investors for several reasons will take a close look at the Tesla results to be announced after the close of cash trading in the US later today. At the reopening of European markets post-Easter, a mild safe haven bid still supports German Bunds with yields declining between 1.5 bps (2-y) and 3.2 bps (30-y). Even if you assume some deflationary impact from the global context on Europe (negative demand shock, stronger euro, lower energy prices…), European money market have gone (very) far in anticipating the ECB ability/necessity to support growth later this year/early next year (low of the ECB cycle potentially near 1.5%). The pause in the ‘sell US trade’ for now also prevents further USD losses. DXY is gaining modestly to 98.55, but still holds below the key previous support area of 98.97 (62% retracement)/99.57. EUR/USD corrects off the 1.15+ area (currently 1.1463). At USD/JPY 140.6, the yen again outperforms (especially the against the euro). Comments from people familiar with the internal debate with the Bank of Japan this morning indicated that the BoJ currently isn’t at a point yet to profoundly change its stance of gradually raising rates further. A relative mild risk sentiment also gave some relief for sterling. EUR/GBP eased from the 0.86 area to currently trade near 0.8575. Headlines from (hawkish) BoE member Greene, did catch the eye as she assessed that US tariffs represent more of a disinflationary than an inflationary risk, suggesting more room for the BoE to take a more growth supportive stance.
News & View
The ECB published its Q2 Survey of Professional Forecasters. Respondents’ expectations for headline inflation were 2.2% for 2025 (from 2.1%) and 2% for 2026 (from 1.9%) and 2027 (from 2%).Core inflation expectations were also 0.1 ppt higher at 2.3%-2.1%-2.1% for the 2025-2027 period and for the longer term (2% from 1.9%). Respondents expected real GDP growth of 0.9% in 2025 (from 1% in the Q1 survey), 1.2% in 2026 (from 1.3%) and 1.4% in 2027 (from 1.3%). The expected trajectory of the unemployment rate was revised slightly downwards. The unemployment rate is expected to average 6.3% from 2025 to 2027, and then to fall to 6.2% in the longer term. The Q2 SPF was conducted between 1 and 4 April 2025, when US President Trump announced reciprocal tariffs.
The IMF updated its World Economic Outlook. Major policy shifts are resetting the global trade system and giving rise to uncertainty that is once again testing the resilience of the global economy. These developments come against an already-cooling economic momentum. The IMF warns for diminished policy space to support economies in case of new negative shocks or a pronounced downturn. Fiscal space is much tighter after stimulus in the wake of the pandemic and the energy crisis with rising debt services costs hindering the already historic fiscal adjustment necessary to stabilize debt ratios. There is also little leeway for central banks to look through new negative supply shocks with inflation expectations exceeding central bank targets in most advanced economies. To try to captures the huge amount of uncertainty, the WEO today released three different scenarios. The reference forecast is based on measures announced as of April 4 (peak tariffs) and projects growth to fall from 3.3% in 2024 to 2.8% (from 3.8% in January update) this year before recovering to 3% in 2026 (from 3.3%). For the US, the IMF plots 1.8% for this year and 1.7% for next. For EMU it’s 0.8% and 1.2%.
US Indices on the Front Foot as Earnings Come into Focus
Futures for the S&P 500 and Nasdaq rose on Tuesday ahead of the US open.
A welcome development after all three main stock indexes fell over 2% on Monday when Trump increased his criticism of Fed Chair Powell for not cutting interest rates, raising worries about the central bank's independence and future monetary policy.
Investors seem to be pouring out of US assets with safe havens like Gold benefiting. It appears market participants are now starting to price in political risk for US assets, and this appears to be on the rise.
Looking to the US session and attention will shift temporarily to US corporate earnings. A wave of earnings reports today will offer more clues on how companies are dealing with tariff-related uncertainty and potential impacts on future profits.
Earlier in the day, Verizon dropped 3.6% after losing more subscribers than expected last quarter. Northrop Grumman fell 8.7% following weak quarterly results as well. Tesla, which is set to start earnings for the "Magnificent Seven" megacap stocks after the market closes, gained 0.8% in premarket trading. Some other companies reporting today are shown on the calendar below.
For a technical view of the Dow Jones read: Dow Jones (DJIA) Technical Outlook: Value stocks do not provide a safe haven refuge
Gold prices remain some way off their Asian session highs and are hovering around the $3445/oz handle at the time of writing. I suspect the drop is largely down to profit taking as the overall narrative remains the same. For more read: Gold ETFs and retail investor activity: What's driving the XAU/USD surge?
According to people familiar with the matter, BoJ officials see little need to change their present stance of gradually lifting interest rates for now, despite uncertainties stemming from US tariffs.
Economic data releases
For now focus will shift to earnings with a host of Fed Policymakers scheduled to speak later. It will be interesting to see whether they weigh in on the Trump-Powell situation and how they see Fed policy developing in upcoming meetings
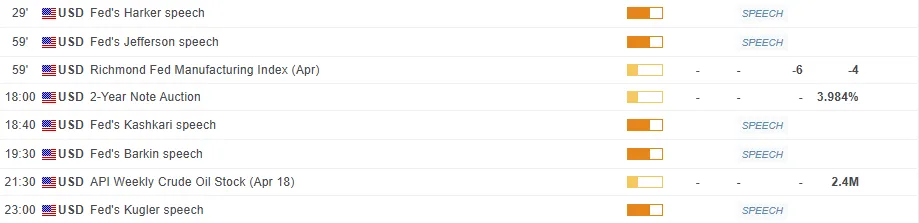
For all market-moving economic releases and events, see the MarketPulse Economic Calendar. (click to enlarge)
Chart of the day - US Dollar Index (DXY)
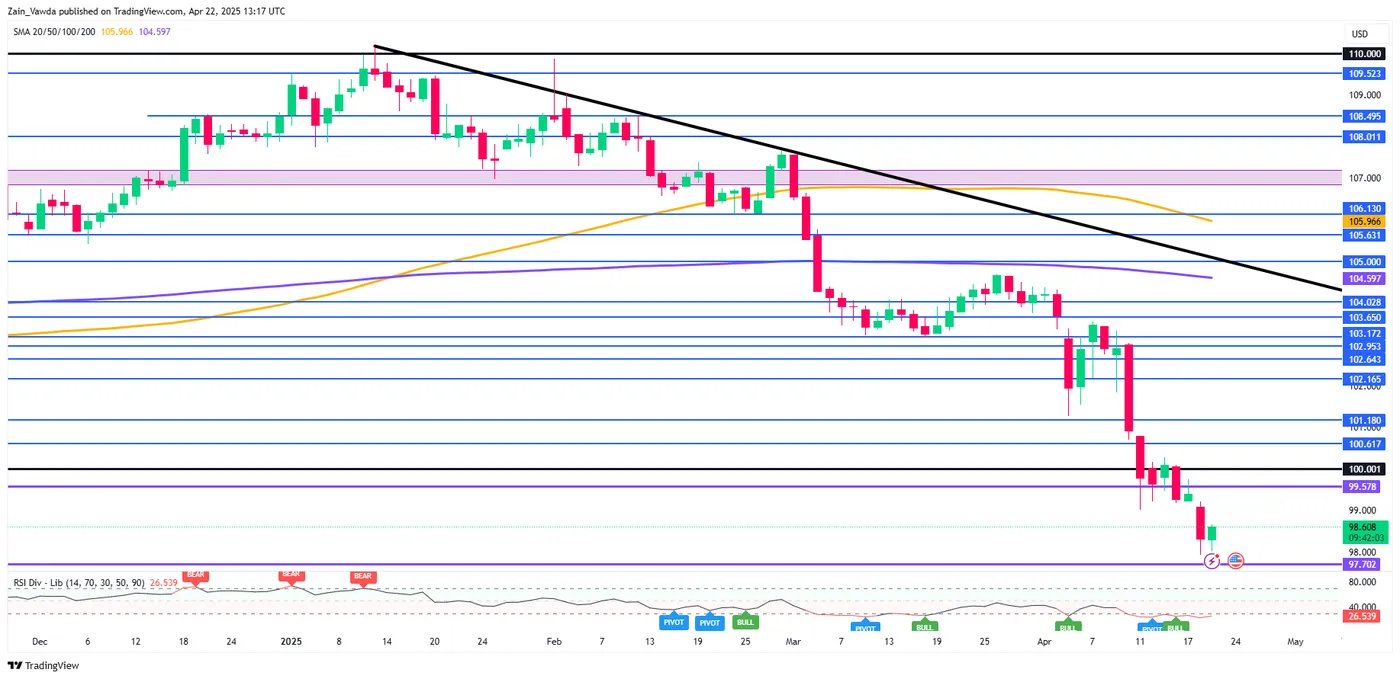
The US Dollar Index (DXY) has staged a mini recovery so far today, whether this will prove sustainable remains to be seen.
If the bounce continues, immediate resistance rests at 99.00 before the 99.20 and 99.57 may be areas to focus on.
Immediate support rests at 98.00 before the 97.70 handle comes into focus.
Given the RSI is about to break above the 30 handle this could be the confidence boost that bulls need for a sustained recovery, however this needs to materialize first. So keep a close watch.
US Dollar Index (DXY) Chart, April 22, 2025
Source: TradingView.com (click to enlarge)
USD/JPY Mid-Day Outlook
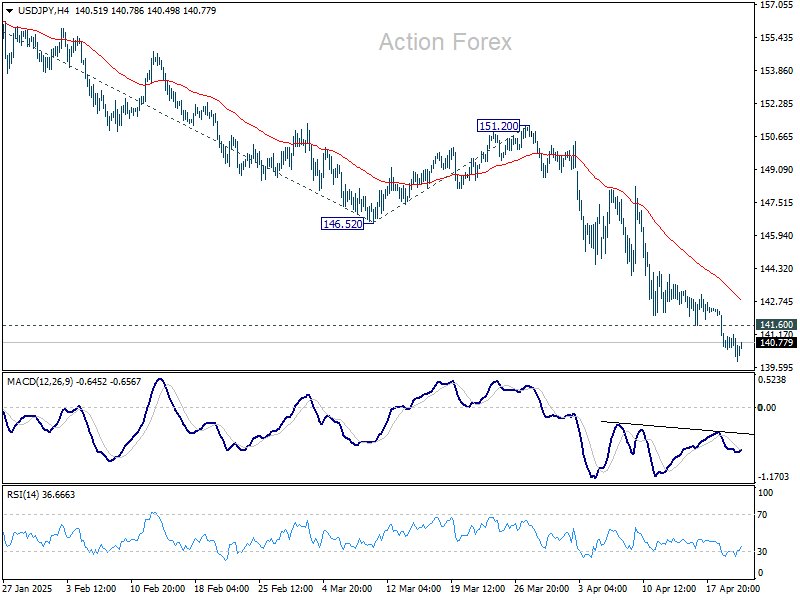
Daily Pivots: (S1) 140.18; (P) 141.16; (R1) 141.85; More...
Intraday bias in USD/JPY stays on the downside as fall from 158.86 is in progress for 139.57 support. Strong support could seen from 139.26 fibonacci level to bring rebound. On the upside, above 141.60 minor resistance will turn intraday bias neutral first. However, decisive break of 139.26 will carry larger bearish implications, and target 138.2% projection of 158.86 to 146.52 from 151.20 at 134.14.
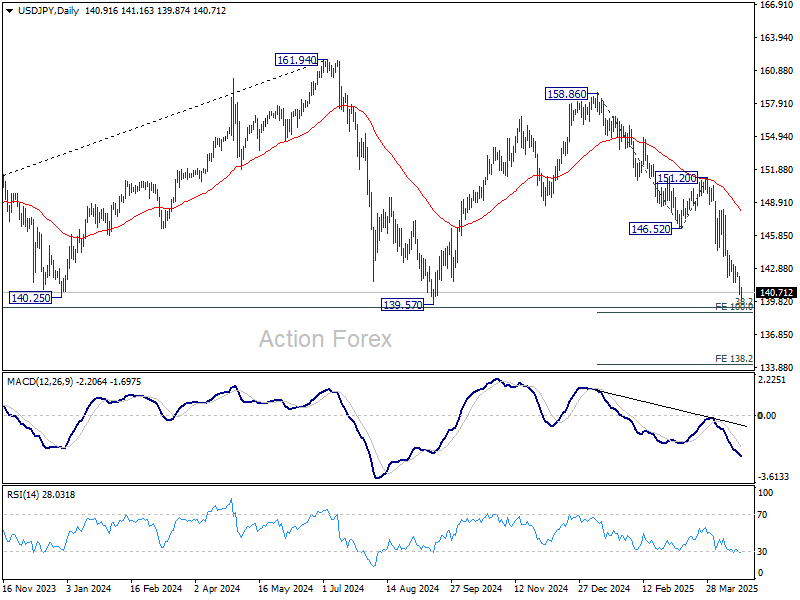
In the bigger picture, price actions from 161.94 are seen as a corrective pattern to rise from 102.58 (2021 low), with fall from 158.86 as the third leg. Strong support should be seen from 38.2% retracement of 102.58 to 161.94 at 139.26 to bring rebound. However, sustained break of 139.26 would open up deeper medium term decline to 61.8% retracement at 125.25.
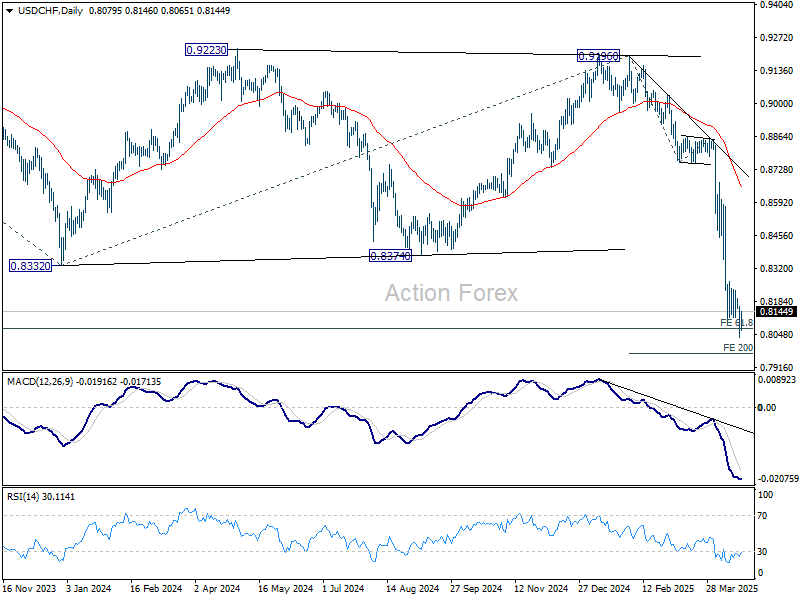
USD/CHF Mid-Day Outlook
Daily Pivots: (S1) 0.8026; (P) 0.8104; (R1) 0.8169; More…
Further decline is expected in USD/CHF with 0.8196 resistance intact. Current down trend should target 200% projection of 0.9196 to 0.8757 from 0.8854 at 0.7976 next. Nevertheless, considering bullish convergence condition in 4H MACD, break of 0.8196 will indicate short term bottoming, and turn bias back to the upside for stronger rebound.
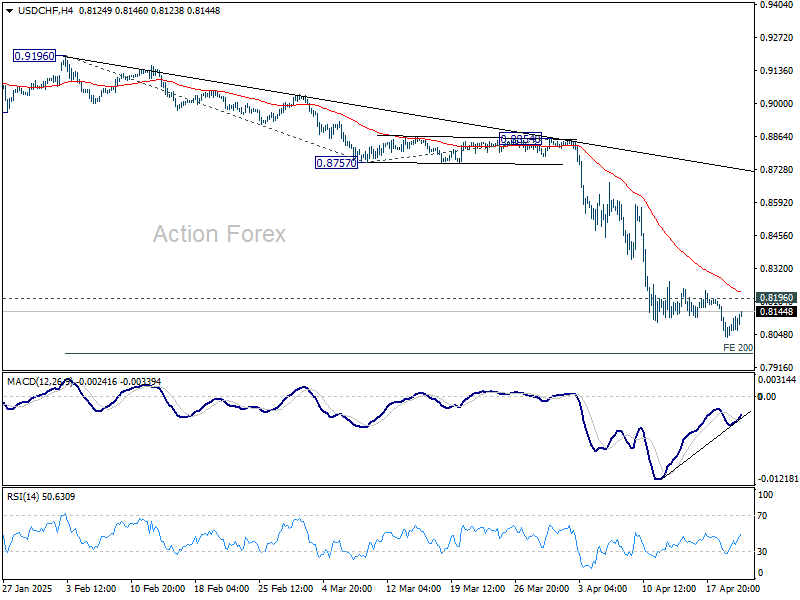
In the bigger picture, the break of 0.8332 (2023 low) confirms resumption of long term down trend from 1.0342 (2017 high). Next target is 61.8% projection of 1.0146 (2022 high) to 0.8332 from 0.9196 at 0.8075. Firm break there will target 100% projection at 0.7382. In any case, outlook will now stay bearish as long as 55 W EMA (now at 0.8794) holds.
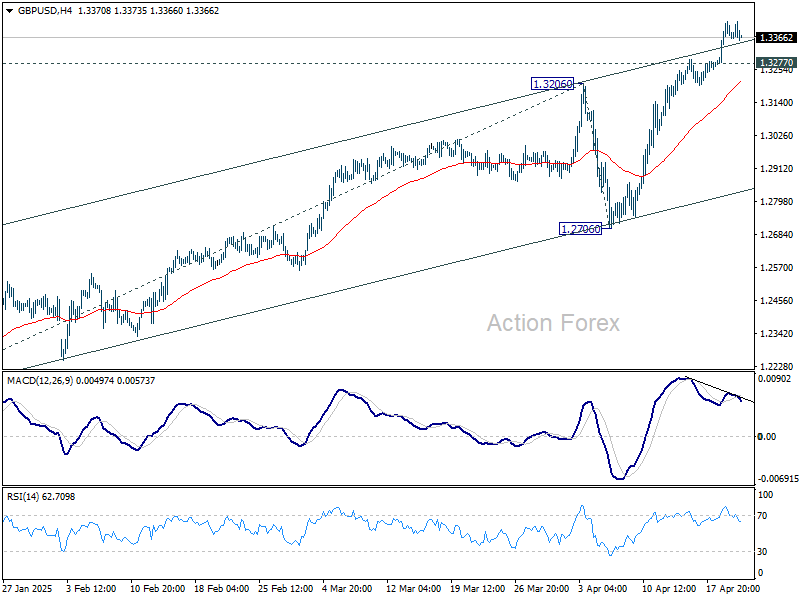
GBP/USD Mid-Day Outlook
Daily Pivots: (S1) 1.3297; (P) 1.3359; (R1) 1.3444; More...
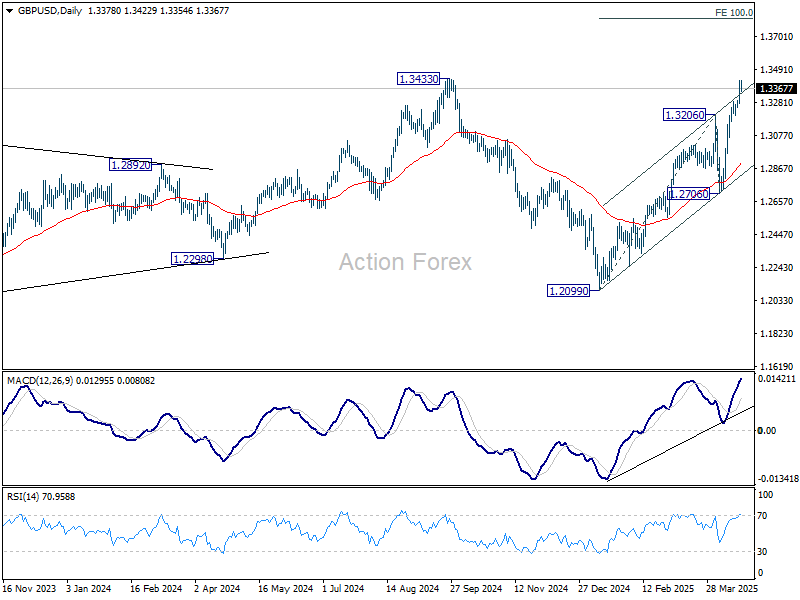
Further rally is expected in GBP/USD as long as 1.3277 support holds. Current rise should extend to retest 1.3433 high. Firm break there will confirm larger up trend resumption and target 100% projection of 1.2099 to 1.3206 from 1.2706 at 1.3813. Nevertheless, considering bearish divergence condition in 4H MACD, break of 1.3277 will indicate short term topping, and turn bias back to the downside for deeper pullback.
In the bigger picture, price actions from 1.3433 are seen as a corrective pattern to the up trend from 1.3051 (2022 low). Rise from 1.2099 could be the second leg. Overall, GBP/USD should target 1.4248 key resistance (2021 high) on break of 1.3433 at a later stage.
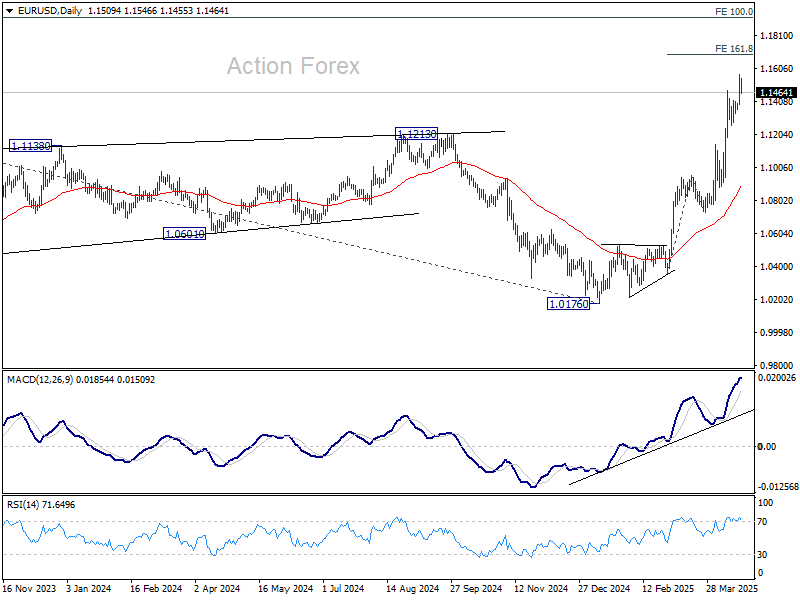
EUR/USD Mid-Day Outlook
Daily Pivots: (S1) 1.1414; (P) 1.1494; (R1) 1.1592; More...
Further rally is expected in EUR/USD as long as 1.1357 support holds. Current rise from 1.0176 should target 161.8% projection of 1.0358 to 1.0953 from 1.0731 at 1.1694 next. Nevertheless, considering bearish divergence condition in 4H MACD, break of 1.1357 should indicate short term topping. Intraday bias will be turned back to the downside for deeper pullback.
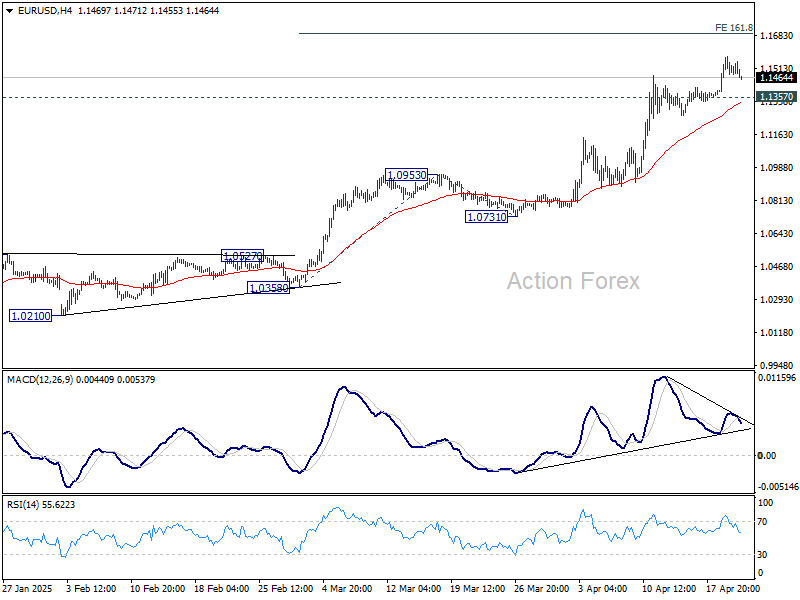
In the bigger picture, rise from 0.9534 long term bottom could be correcting the multi-decade downtrend or the start of a long term up trend. In either case, further rise should be seen to 100% projection of 0.9534 to 1.1274 from 1.0176 at 1.1916. This will now remain the favored case as long as 55 W EMA (now at 1.0776) holds.