
Sample Category Title
GBP/USD Weekly Outlook
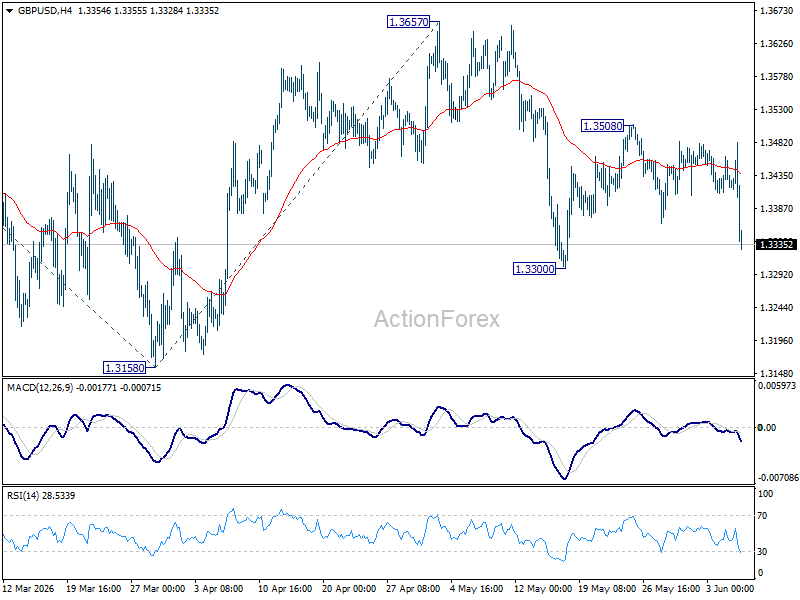
GBP/USD's late decline last week suggests rejection by 55 D EMA (now at 1.3453), which is a bearish signal. But downside is contained above 1.3300 support. Initial bias stays neutral this week first. Break of 1.3300 will target a retest on 1.3158. Firm break there will extend the whole fall from 1.3867 to 100% projection of 1.3867 to 1.3158 from 1.3657 at 1.2948. For now, risk is mildly on the downside as long as 1.3508 resistance holds, in case of recovery.
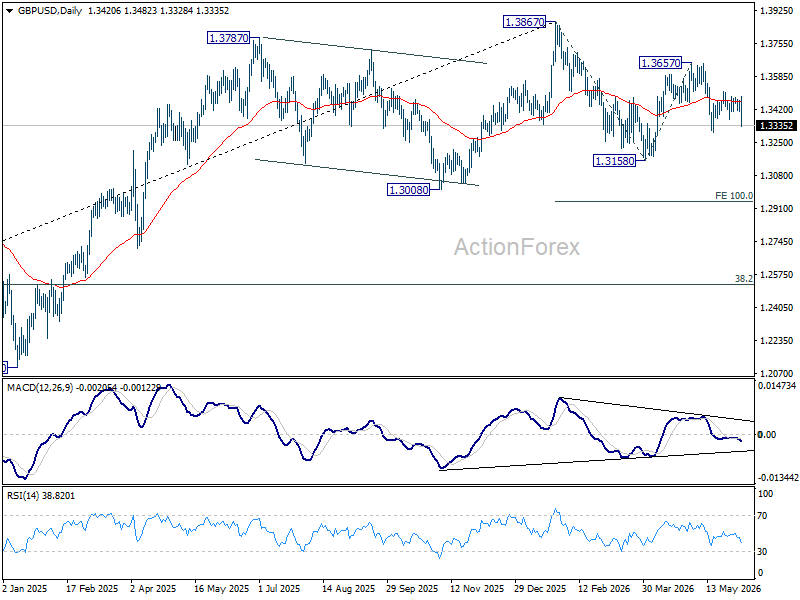
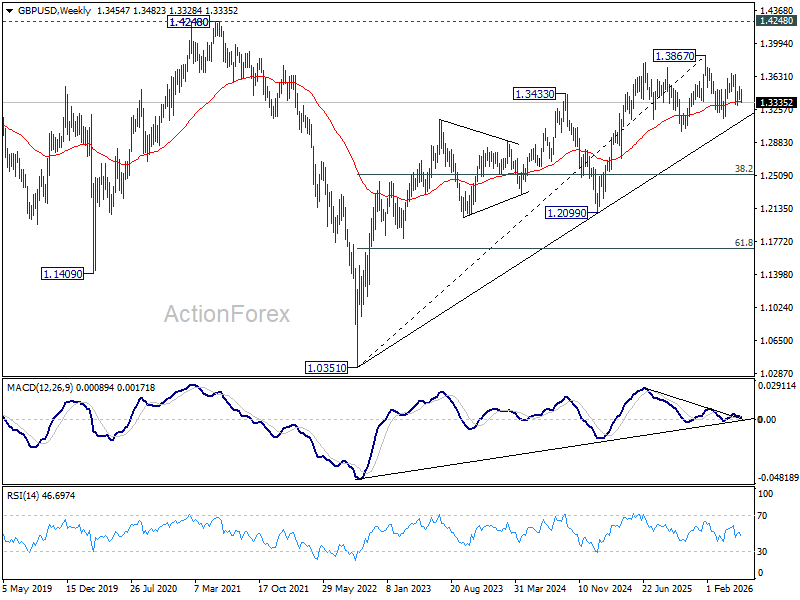
In the bigger picture, price actions from 1.3867 are a corrective pattern within the broader up trend from 1.0351 (2022 low). With 1.3008 support intact, medium term bullishness is maintained and break of 1.3867 is in favor for a later stage, towards 1.4248 key resistance (2021 high). However, firm break of 1.3008 will at least bring deeper fall to 38.2% retracement of 1.0351 to 1.3867 at 1.2524, with increased risk of bearish reversal.
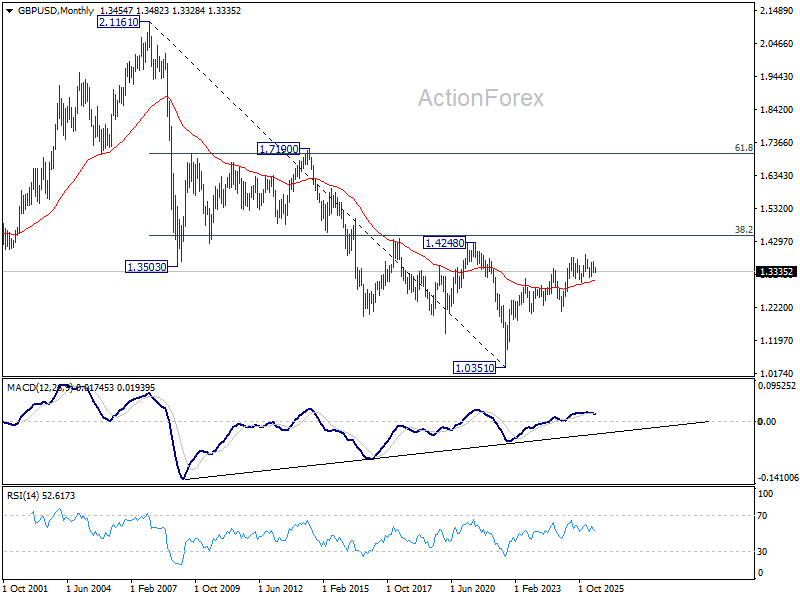
In the long term picture, as long as 1.4248/4480 resistance zone holds (38.2% retracement of 2.1161 to 1.0351 at 1.4480), the long term outlook will remain bearish. That is, price actions from 1.0351 are seen as a corrective pattern to down trend from 2.1161 (2007 high) only. Nevertheless, decisive break of 1.4248/4480 will be a strong sign of long term bullish reversal.
USD/CHF Weekly Outlook
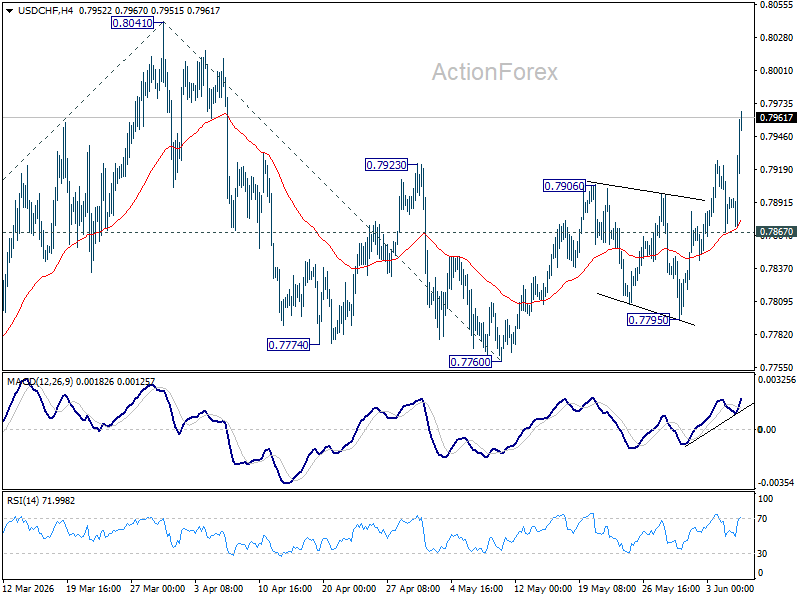
USD/CHF's rebound from 0.7760 resumed last week and accelerated through 0.7906 resistance. The development suggests that fall from 0.8041 has completed as a correction to 0.7760. Initial bias stays on the upside this week for retesting 0.8041 first. For now, risk will stay on the upside as long as 0.7867 minor support holds, in case of retreat.
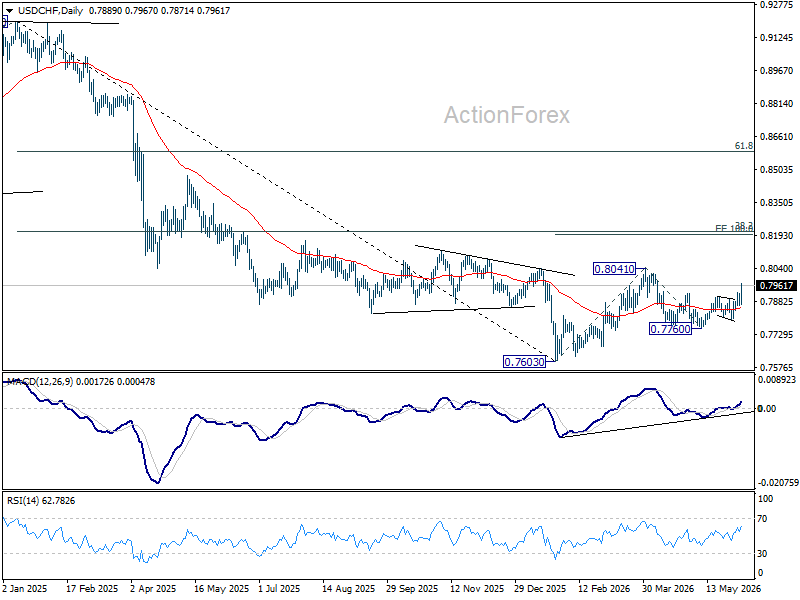
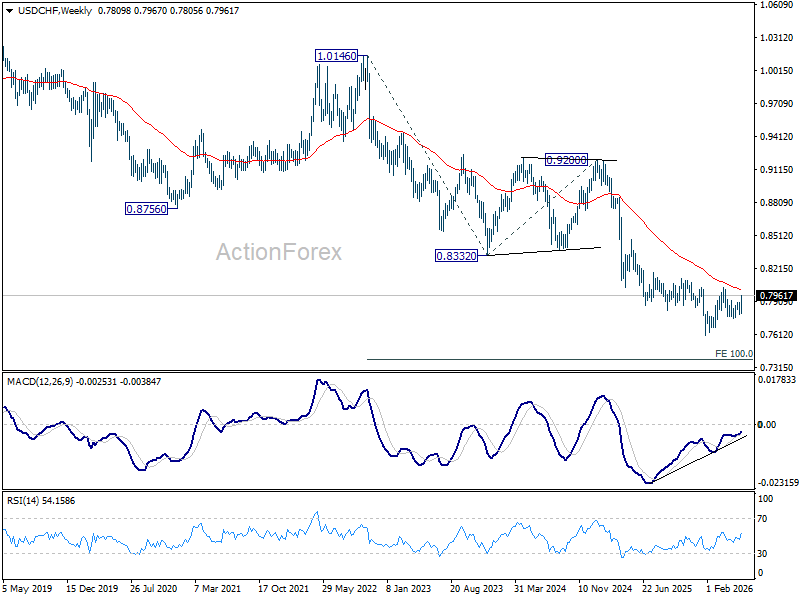
In the bigger picture, while a medium term bottom was formed at 0.7603, it's still early to call for bullish trend reversal. As long as 38.2% retracement of 0.9200 (2025 high) to 0.7603 at 0.8213 holds, the larger down trend could still continue through 0.7603 at a later stage. However, firm break of 0.7603 will argue that the trend has reversed and turn focus to 0.8332 support turned resistance (2023 low) for confirmation.
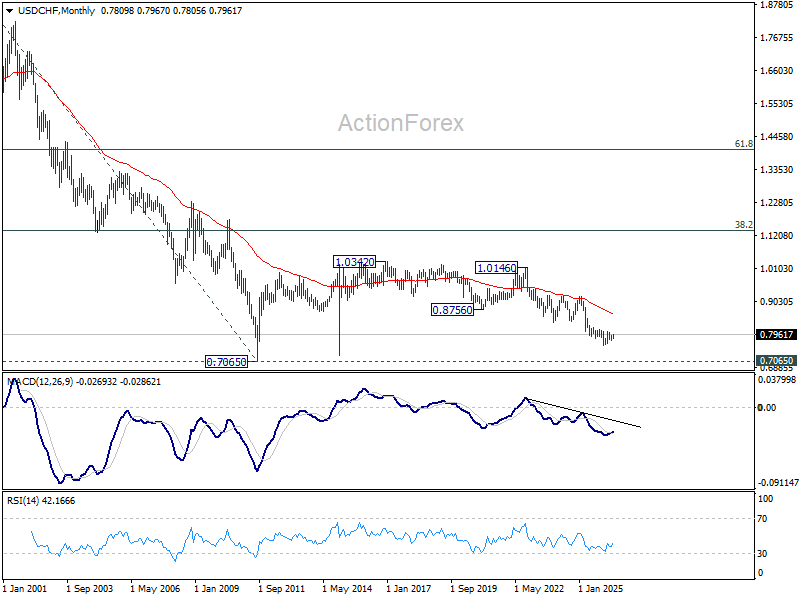
In the long term picture, price action from 0.7065 (2011 low) are seen as a corrective pattern to the multi-decade down trend from 1.8305 (2000 high). It's uncertain if the fall from 1.0342 is the second leg of the pattern, or resumption of the downtrend. But in either case, outlook will stay bearish as long as 0.8756 support turned resistance holds (2021 low). Retest of 0.7065 should be seen next.
AUD/USD Weekly Report
AUD/USD's fall from 0.7277 resumed by breaking through 0.7076 last week. Initial bias is now on the downside this week for 100% projection of 0.7277 to 0.7076 from 0.7200 at 0.6999. Firm break there will target 161.8% projection at 0.6875. Near term risk will stay on the downside as long as 0.7200 resistance holds, in case of recovery.
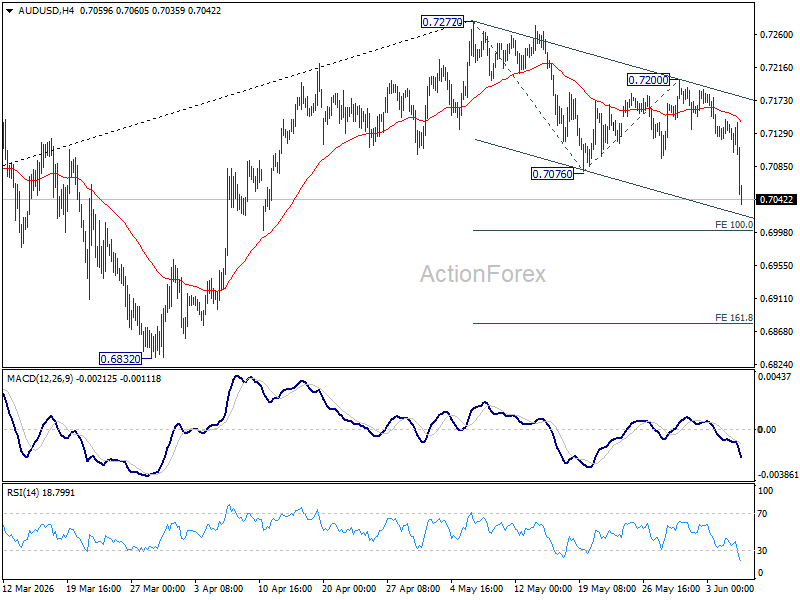
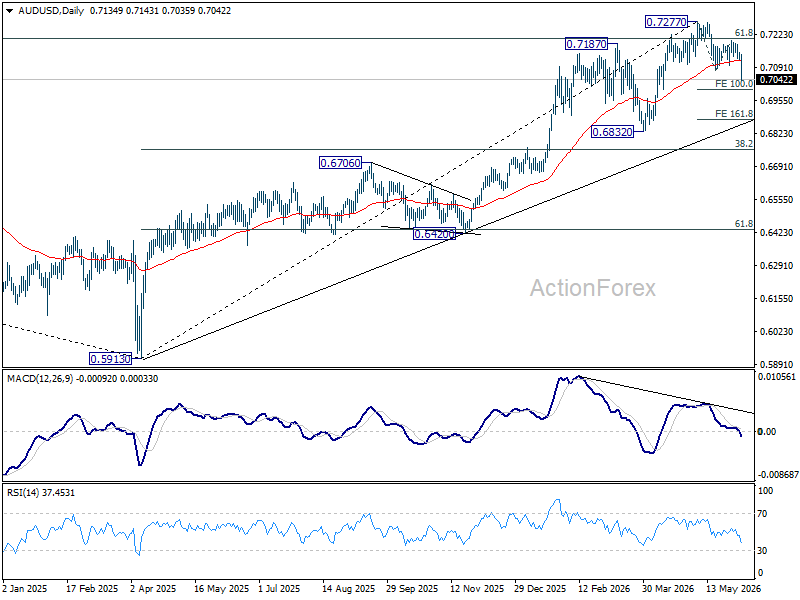
In the bigger picture, considering bearish divergence condition in D MACD, a medium term top could be formed at 0.7277 after failing to sustain above 61.8% retracement o f0.8006 (2021 high) to 0.5913 (2024 low) at 0.7206). Deeper fall could be seen to 38.2% retracement of 5913 to 0.7277 at 0.6756 as a correction. But strong support should be seen there to bring rebound. Consolidations would continue below 0.7277 for a while.
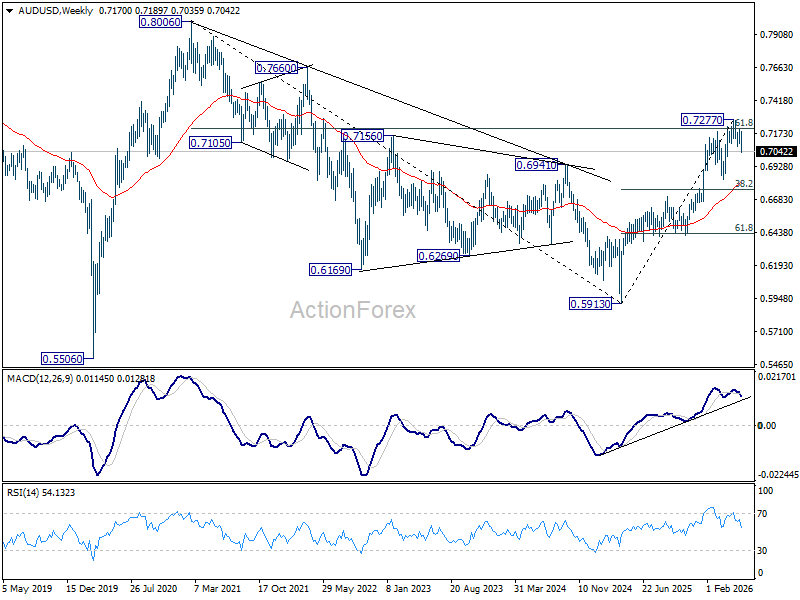
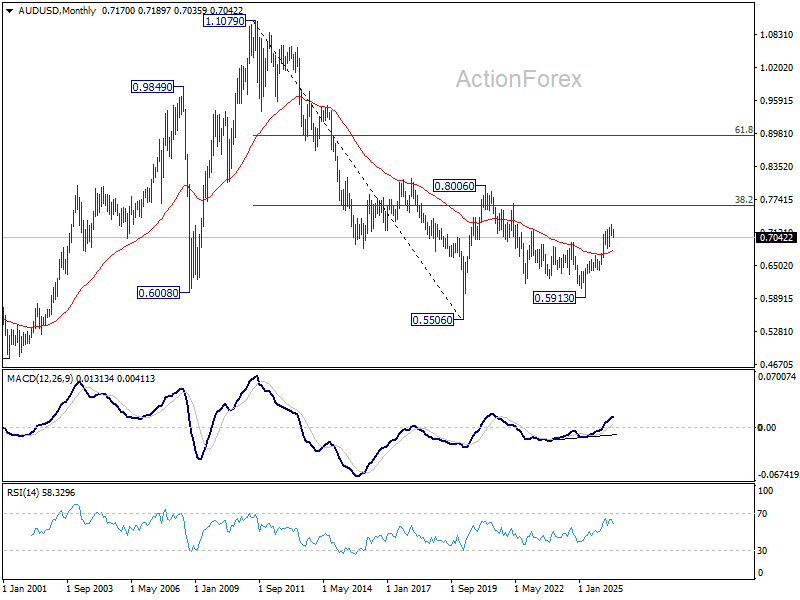
In the long term picture, rise from 0.5913 is seen as the third leg of the whole pattern from 0.5506 (2020 low). It's still early to judge if this is an impulsive or corrective pattern. But in either case, further rise should be seen back to 0.8006 and possibly above. This will remain the favored case as long as 55 W EMA (now at 0.6804) holds.
USD/CAD Weekly Outlook
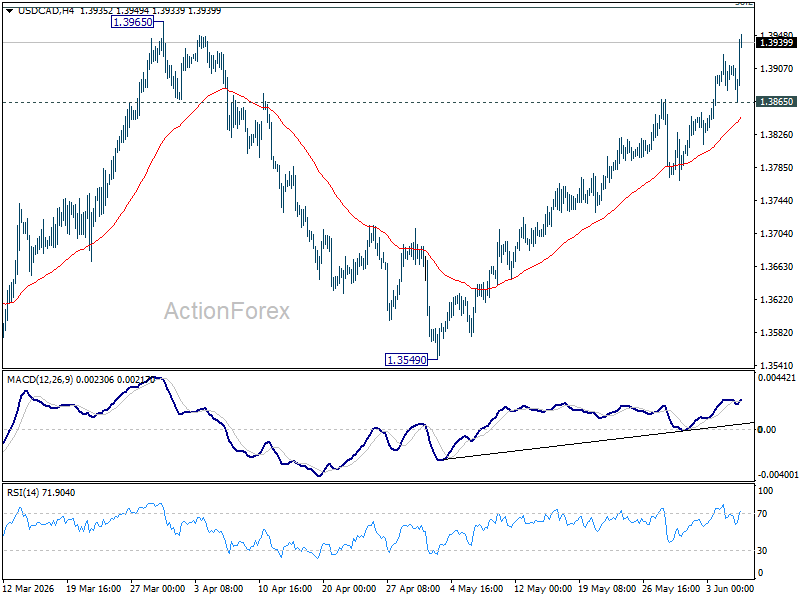
USD/CAD's rally from 1.3549 accelerated higher last week and there is no sign of topping yet. Initial bias stays on the upside this week for 38.2% retracement of 1.4791 to 1.3480 at 1.3981. Decisive break there will carry larger bullish implications and target 61.8% retracement at 1.4290 next. On the downside, below 1.3865 minor support will turn intraday bias neutral first.
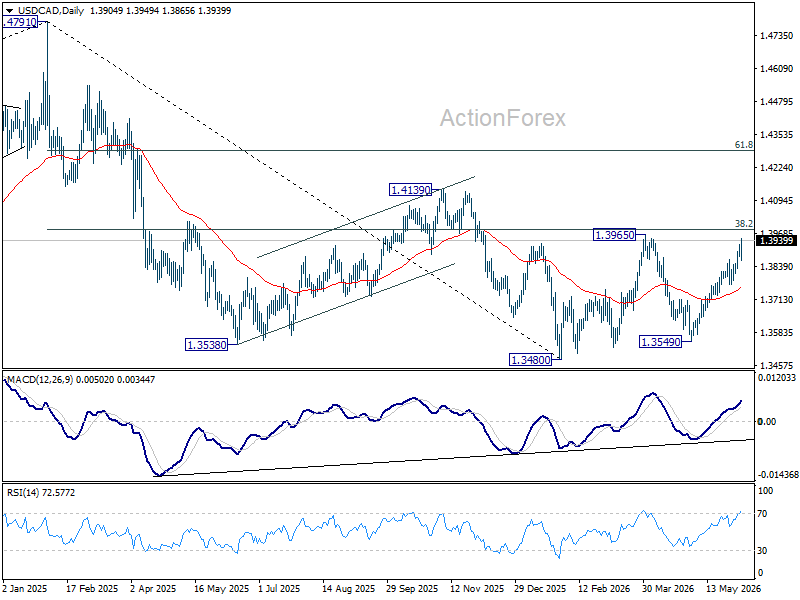
In the bigger picture, price actions from 1.4791 are seen as a corrective pattern to the whole up trend from 1.2005 (2021 low). Rejection by 38.2% retracement of 1.4791 to 1.3480 at 1.3981 will keep the decline intact, and bring another fall through 1.3480 at a later stage. However, firm break of 1.3981 will argue that the decline has completed, and set up further rise back to retest 1.4791 instead.
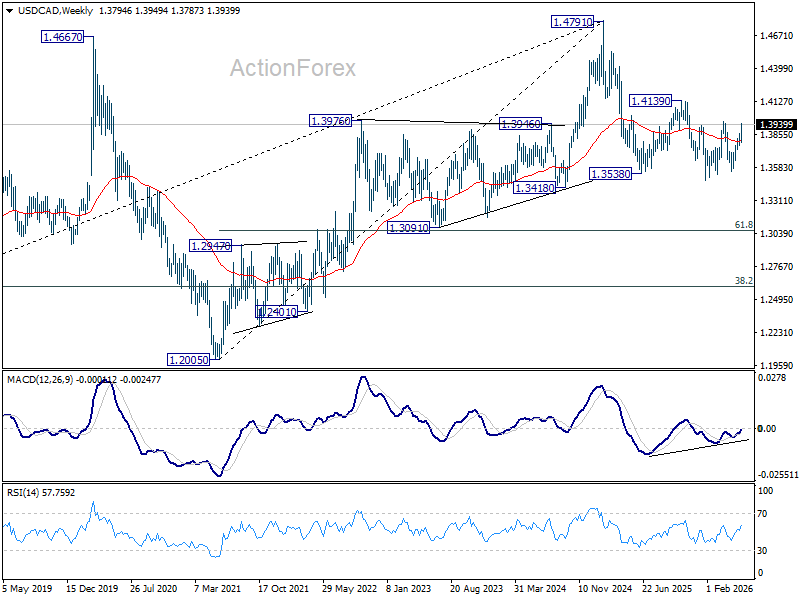
In the long term picture, rising 55 M EMA (now at 1.3588) remains intact. Thus, up trend from 0.9056 (2007 low) could still be in progress. However, considering bearish divergence condition M MACD, sustained trading below 55 M EMA will argue that the up trend has completed with five waves up to 1.4791, and turn medium term outlook bearish for correction to 38.2% retracement of 0.9056 to 1.4791 at 1.2600.
GBP/JPY Weekly Outlook
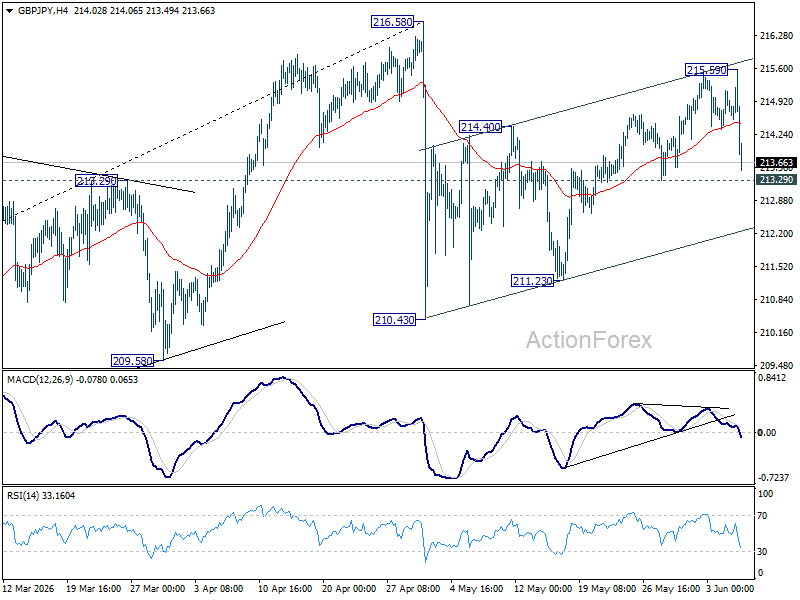
GBP/JPY edged higher to 215.59 last week but retreated sharply since then. Initial bias remains neutral this week first. Rebound from 210.43 is seen as the second leg of the corrective pattern from 216.58, and could have completed at 215.59 already. Break of 213.29 will suggest that the third leg has started and target 210.43 support. For now, risk will be mildly on the downside as long as 215.59 holds, in case of recovery.
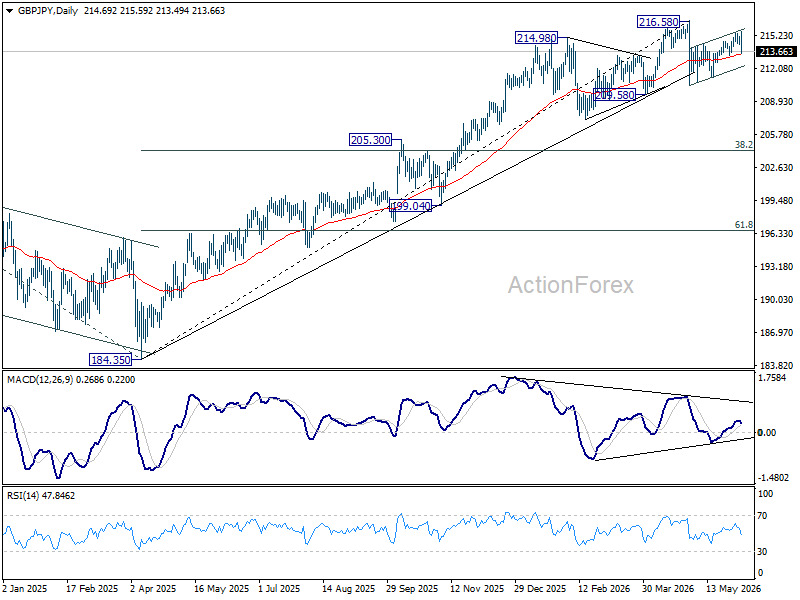
In the bigger picture, there is no clear sign of trend reversal yet. The long term up trend could still extend to 61.8% projection of 148.93 (2022 low) to 208.09 (2024 high) from 184.35 at 220.90 on resumption. However, sustained break of 55 W EMA (now at 206.53) will argue that it's already in medium term down trend for 184.35 support.
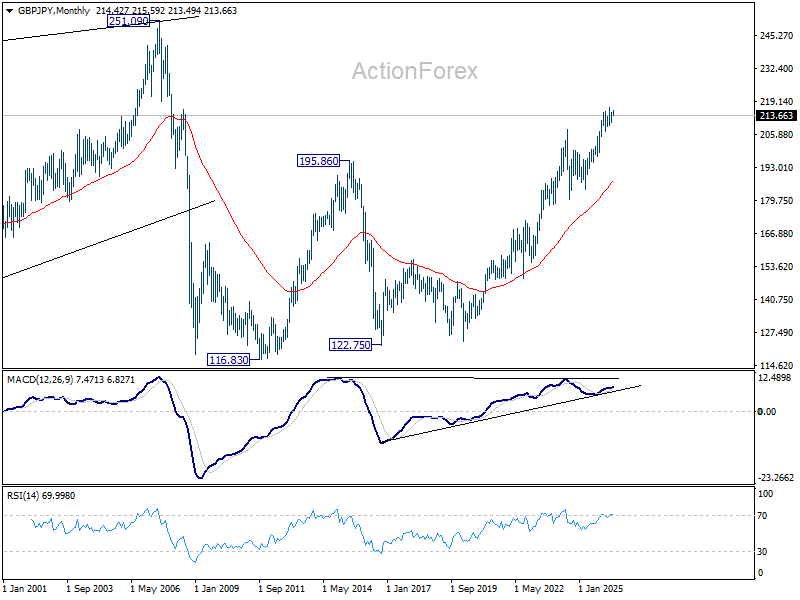
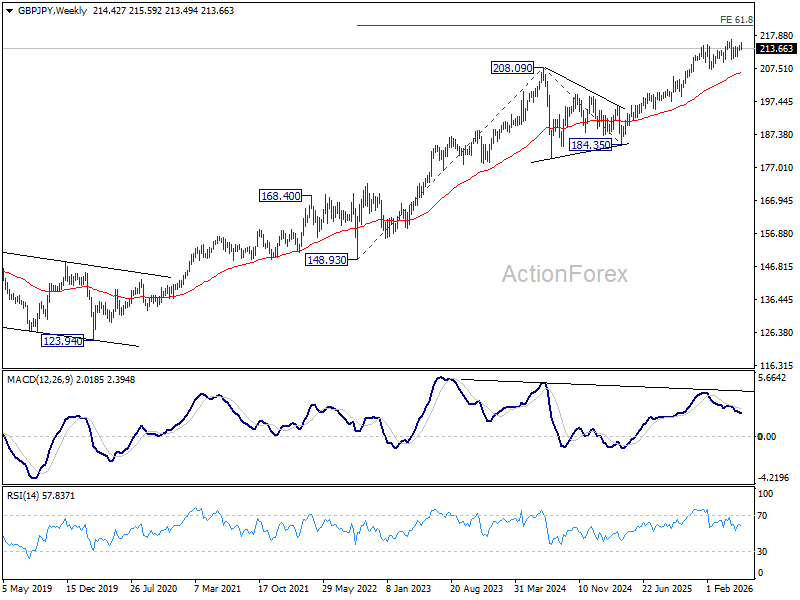
In the long term picture, up trend from 116.83 (2011 low) is in progress. Next target is 251.09 (2007 high). This will remain the favored case as long as 55 M EMA (now at 186.82) holds.
EUR/JPY Weekly Outlook
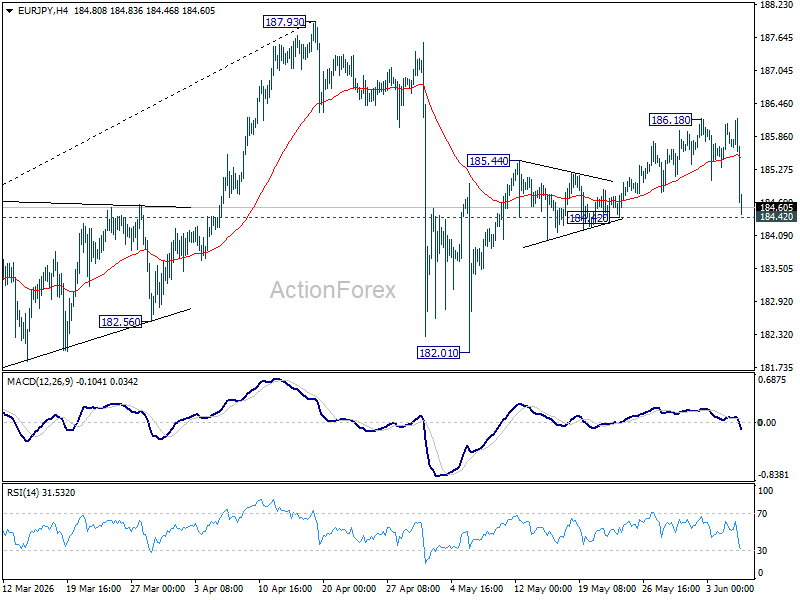
EUR/JPY edged higher to 186.18 but retreated sharply since then. Downside is still supported above 184.42 and initial bias remains neutral this week first. Rebound from 182.01 is seen as the second leg of the corrective pattern from 187.93, and could have completed at 186.18 already. Firm break of 184.42 will argue that the third leg has already started. Intraday bias will be back on the downside for 182.01 support and below. Risk will now stay mildly on the downside as long as 186.18 holds, in case of recovery.
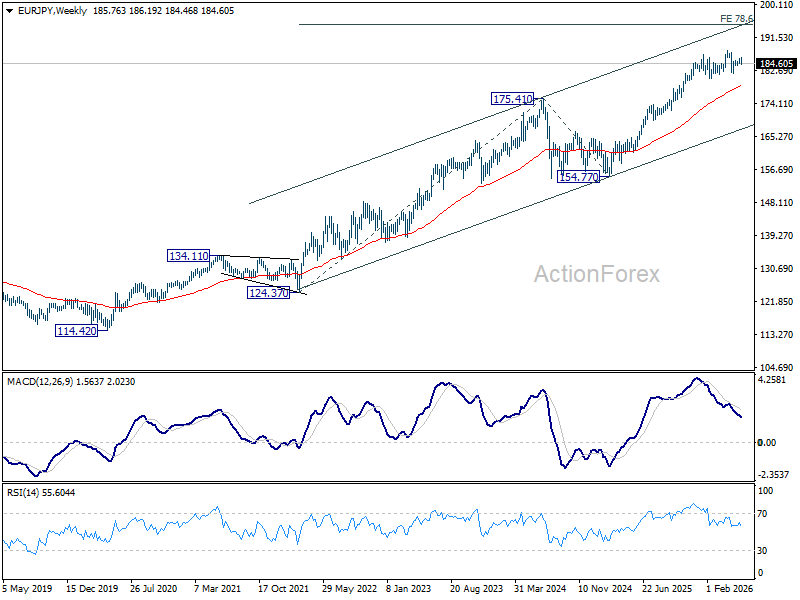
In the bigger picture, there is no sign of reversal yet. Uptrend from 114.42 (2020 low) is still expected to resume at a later stage to 78.6% projection of 124.37 (2022 low) to 175.41 (2025 high) from 154.77 at 194.88. However, sustained break of 55 W EMA (now at 178.53) will argue that it's already in a medium term down trend to 175.41 resistance turned support and below.
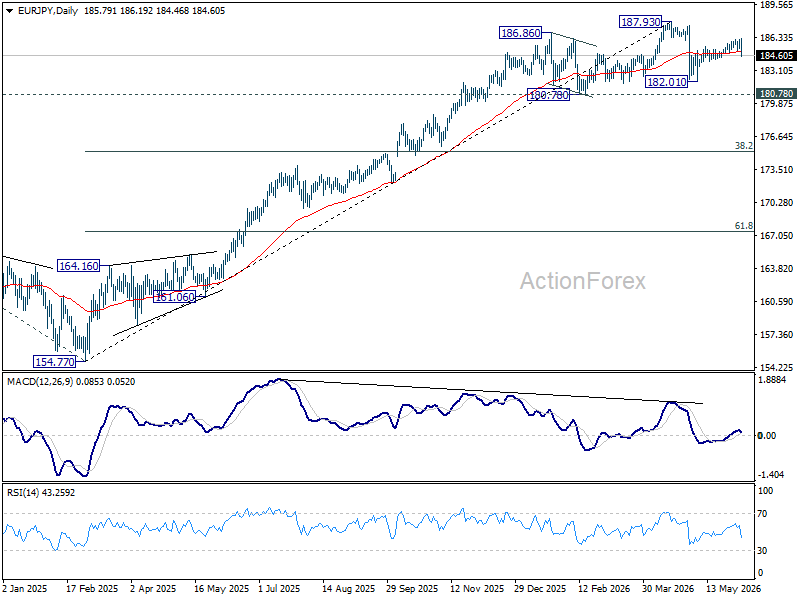
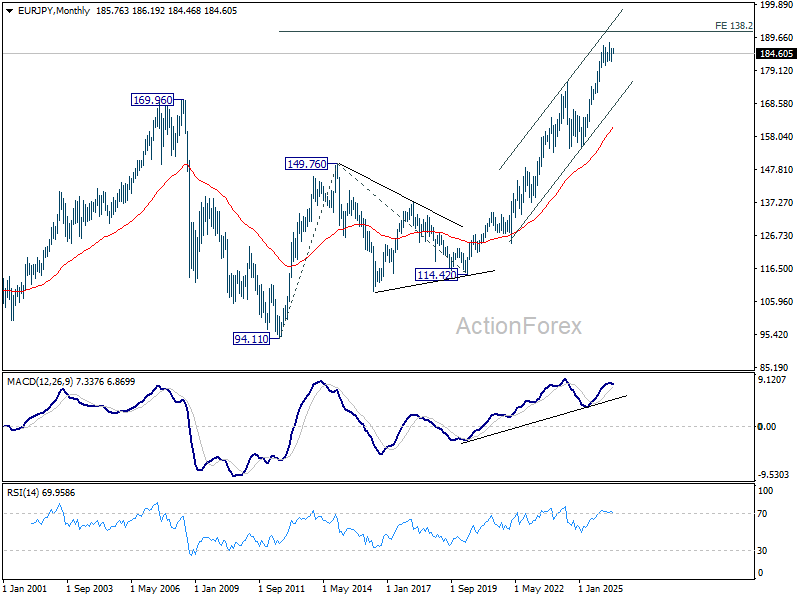
In the long term picture, up trend from 94.11 (2021 low) is in progress. Next target is 138.2% projection of 94.11 to 149.76 (2014 high) from 114.42 (2020 low) at 191.32. This will remain the favored case as long 55 W EMA (now at 178.53) holds.
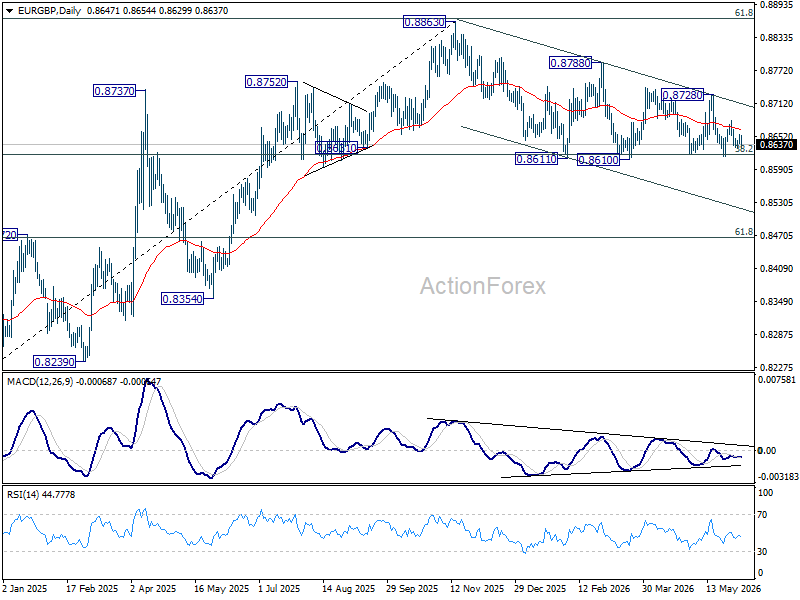
EUR/GBP Daily Outlook
Sideway trading continues in EUR/GBP and outlook is unchanged. Initial bias stays neutral this week. On the downside, decisive break of 0.8610 support will revive the case of bearish trend reversal. On the upside, break of 0.8728 resistance will bring stronger rally back towards 0.8740 resistance.
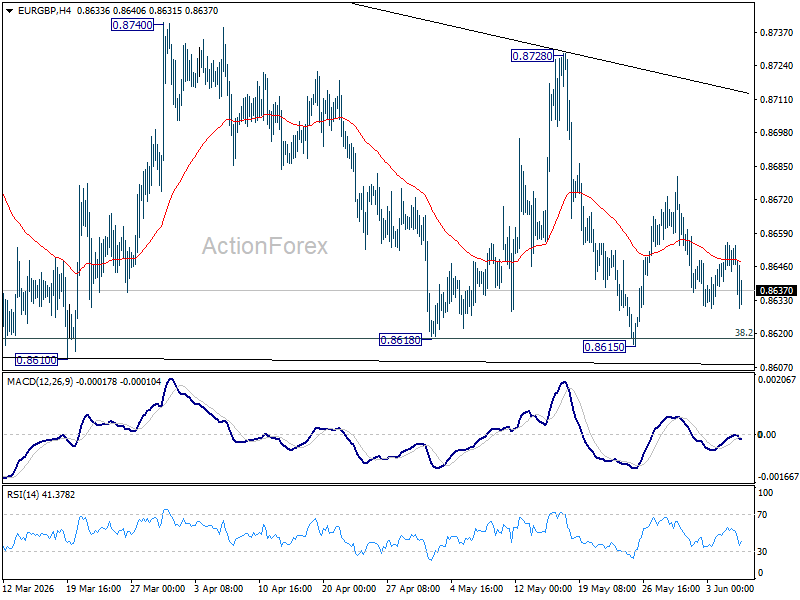
In the bigger picture, focus is staying on 38.2% retracement of 0.8821 to 0.8863 at 0.8618. Strong rebound from there will retain medium term bullishness. Rise from 0.8221 should resume through 0.8863 at a later stage. Nevertheless, sustained break of 0.8618 will confirm that whole rise from 0.8221 has completed at 0.8863. Deeper decline should then be seen to 61.8% retracement at 0.8466 at least.
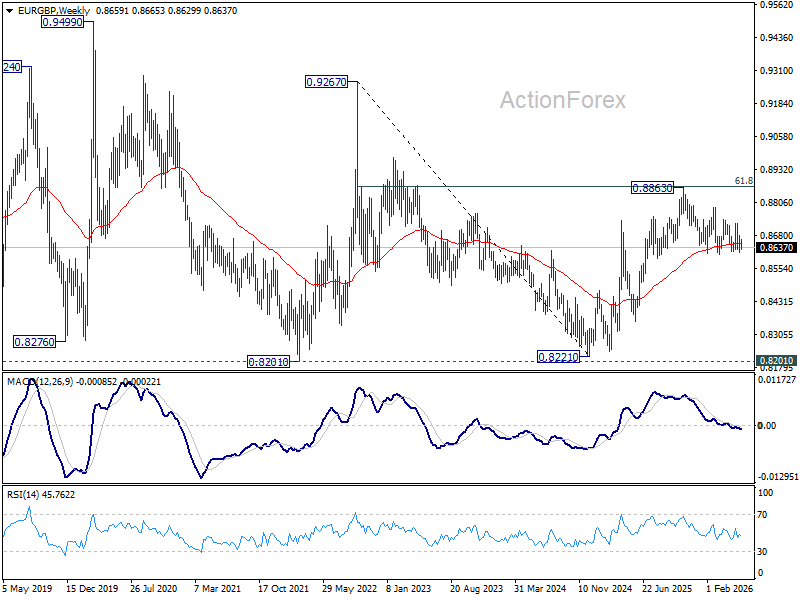
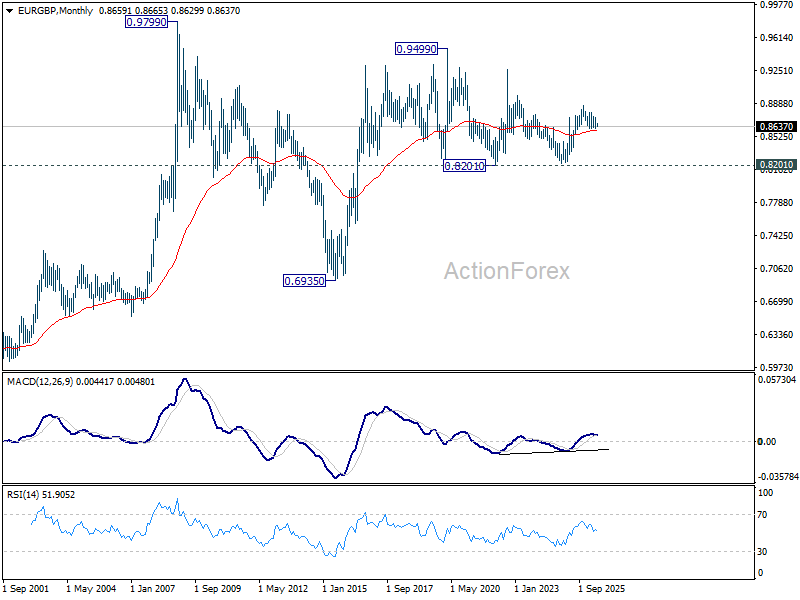
In the long term picture, price action from 0.9499 (2020 high) is seen as part of the long term range pattern from 0.9799 (2008 high). Range trading should continue between 0.8201 and 0.9499, until there is clear signal of imminent breakout.
EUR/AUD Weekly Outlook
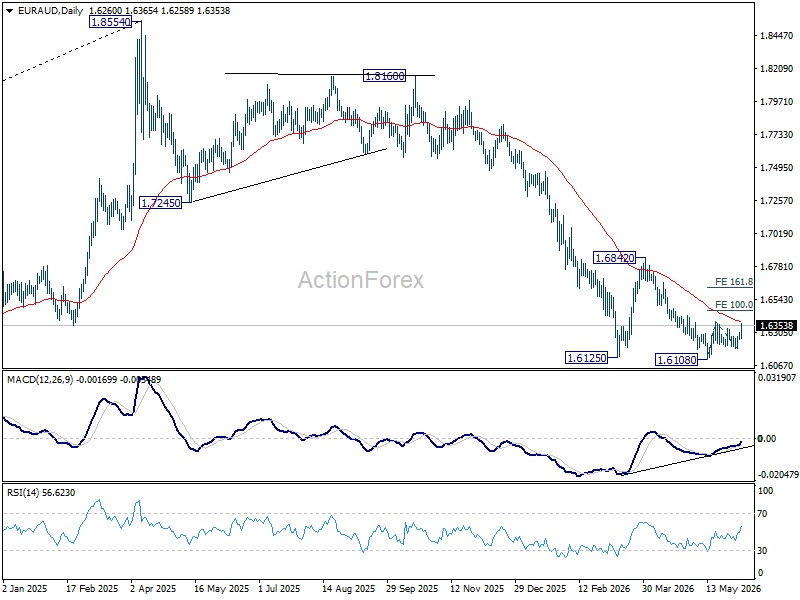
EUR/AUD stayed in range below 1.6381 last week. Initial bias remains neutral this week first. On the upside, break of 1.6381 will resume the rebound from 1.6108 short term bottom to 100% projection of 1.6108 to 1.6381 from 1.6186 at 1.6459. Firm break there will pave the way to 161.8% projection at 1.6628. Risk will stay on the upside as long as 1.6186 support holds, in case of retreat.
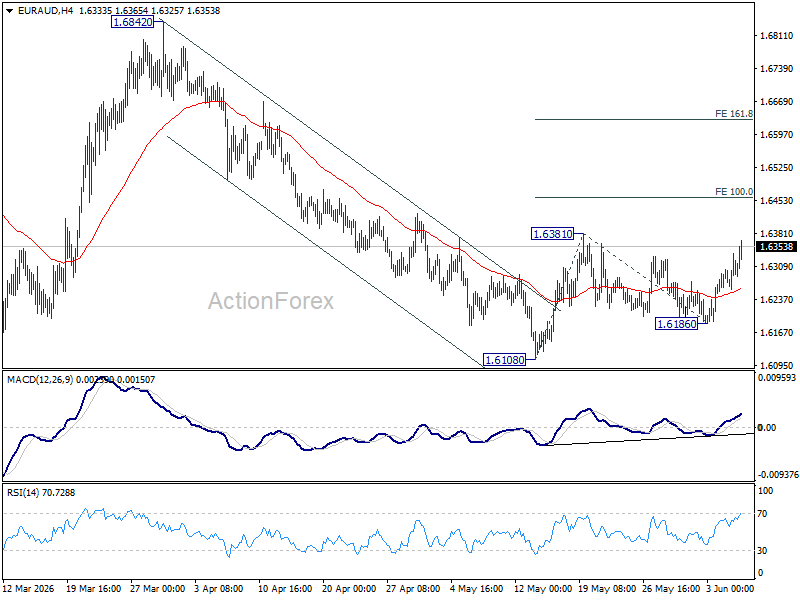
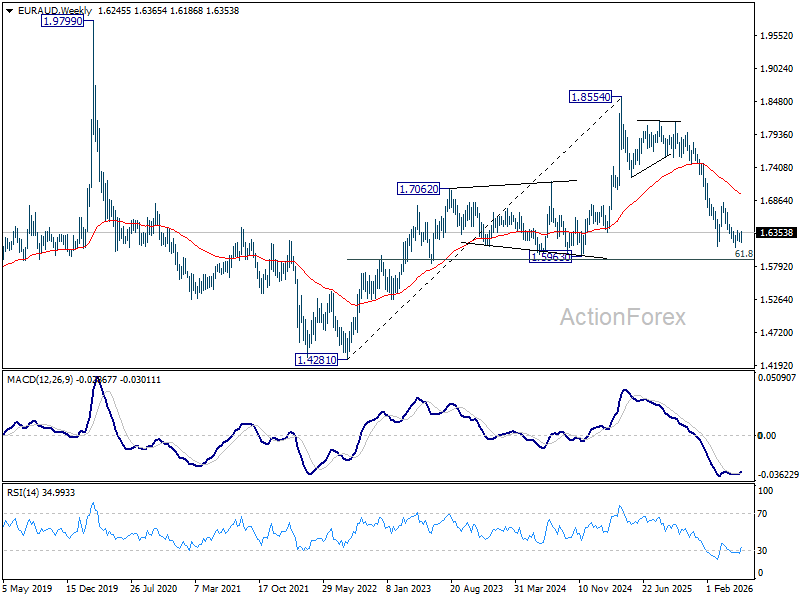
In the bigger picture, outlook will stay bearish as long as 1.6842 resistance holds. Fall from 1.8554 (2025 high) is expected to continue to 61.8% retracement of 1.4281 to 1.8554 at 1.5913. Decisive break there will pave the way back to 1.4281 (2022 low). However, firm break of 1.6842 should confirm medium term bottoming, and bring stronger rally.
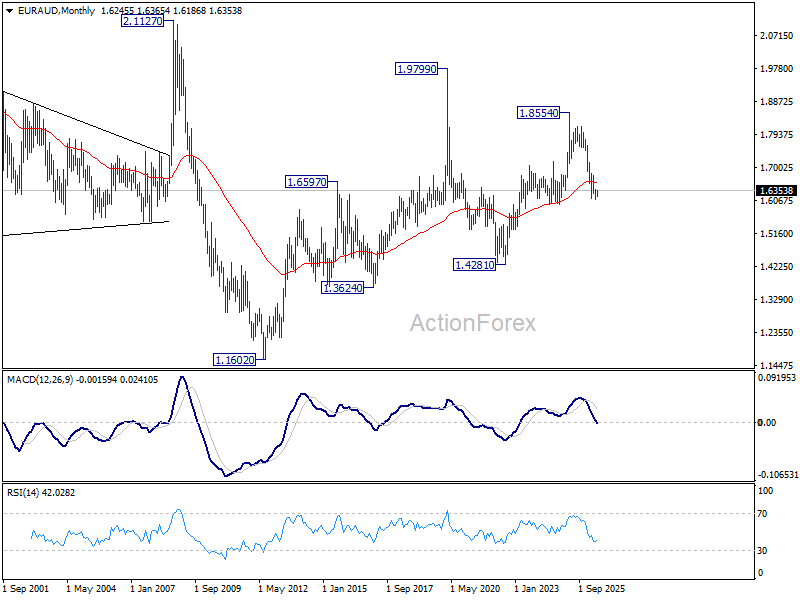
In the longer term picture, fall from 1.8554 is seen as the third leg of the pattern from 1.9799 (2020 high), which is part of the pattern from 2.1127 (2008 high). Sustained trading below 55 M EMA (now at 1.6569) will confirm this bearish case, and pave the way back towards 1.4281.
EUR/CHF Weekly Outlook
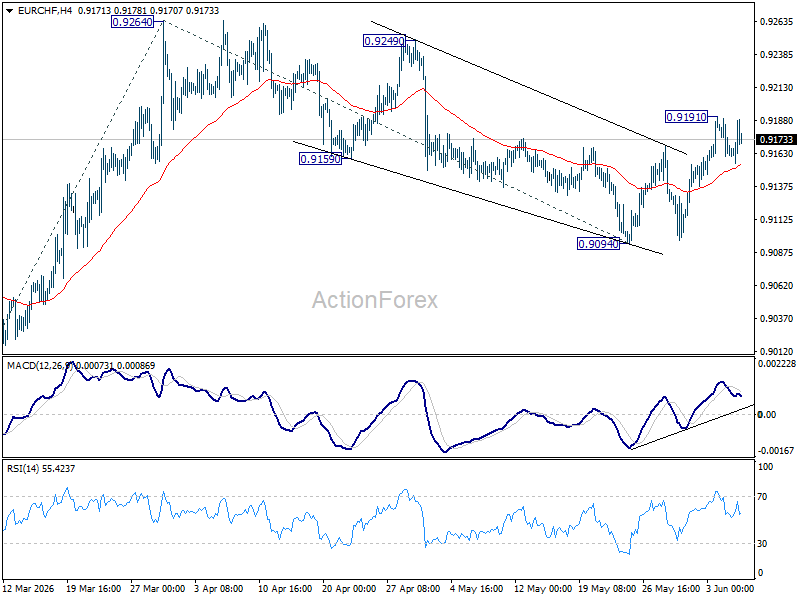
EUR/CHF's extended rebound last week suggests that corrective fall from 0.9264 has completed at 0.9094. But as a temporary top was formed at 0.9191 and initial bias is turned neutral first. Risk will stay on the upside as long as 0.9094 holds. Above 0.9191 will target a test on 0.9264 resistance. Firm break there will resume the rally from 0.8979 to 100% projection of 0.8979 to 0.9264 from 0.9094 at 0.9379.
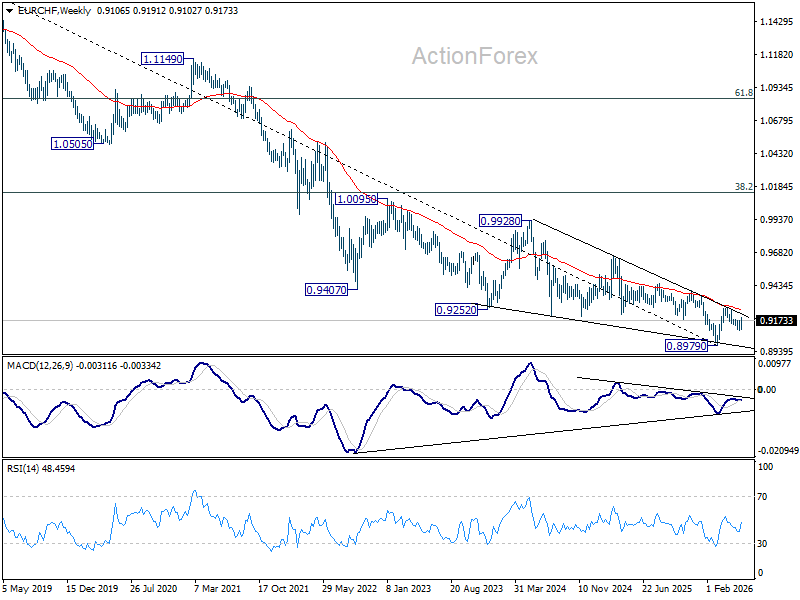
In the bigger picture, as long as 0.9394 resistance holds, down trend from 0.9928 (2024 high) should still be in progress. Firm break of 0.8979 will confirm down trend resumption. However, decisive break of 0.9394 will be an important sign of medium term bullish reversal.
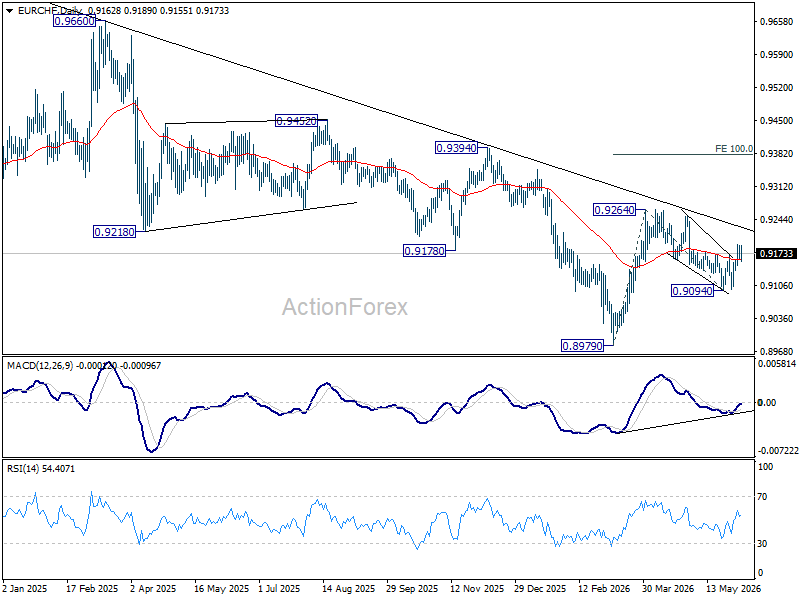
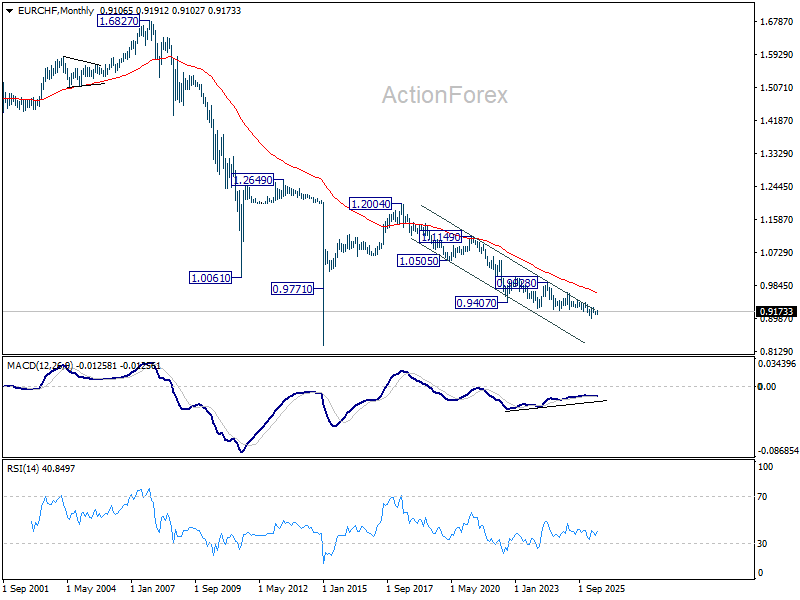
In the long term picture, outlook will stay bearish as long as 0.9407 support turned resistance (2022 low) holds. However, firm break of 0.9407 will argue that the down trend from 1.2004 (2018 high) has completed with five waves down to 0.8979. Stronger rebound should then be seen to 38.2% retracement of 1.2004 to 0.8979 at 1.0135 in the medium term.
The Weekly Bottom Line: Canada’s Economy Stalls Ahead of Trade Negotiations
Canadian Highlights
- Markets swung on hopes of a Middle East truce, but the outlook remains fragile.
- Canada’s economy has stalled out over the past two quarters, with weak domestic demand and patchy investment pointing to subdued momentum.
- The upcoming CUSMA review is now central, as Canada looks to pair greater trade clarity with an energy led investment strategy.
U.S. Highlights
- Renewed hopes of a U.S.-Iran ceasefire extension pushed WTI prices 9% lower this week to $88 per barrel.
- Consumer spending remained resilient in April, amid rising inflationary pressures and dwindling household savings.
- More Fed officials are joining the chorus of sounding increasingly hawkish, with Fed futures 60% priced for a rate hike by year-end.
Canada – Canada’s Economy Stalls Ahead of Trade Negotiations
Hope for a peace deal to end the conflict between Iran and the U.S. and open the Strait of Hormuz dominated markets this week. While optimism around a possible 60-day truce has pushed oil prices sharply lower (down roughly nine percent relative to late last week), volatility remains elevated. Markets continue to respond quickly to shifting headlines, underscoring the fragility of the outlook. For Canada, this volatility comes at a time when market access to the U.S. remains an open question and continues to weigh on domestic activity.
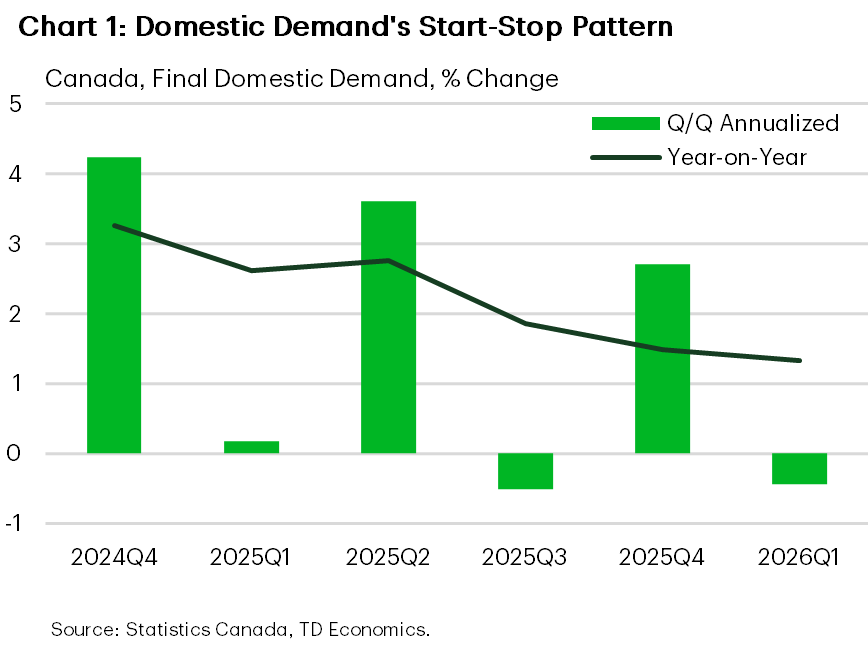
The first quarter GDP report showed the economy effectively stalled (-0.1% quarter-on-quarter annualized, q/q), undershooting expectations. The weakness was broad-based. Strong import growth dragged down the top line figure, but final domestic demand declined again (-0.4% q/q), and continues to proceed in fits and starts (Chart 1). Looking through the volatility final domestic demand is up 1.3% year-on-year (y/y), but this is still a below-trend figure, and consistent with an economy operating below capacity.
Household spending grew 1.5% q/q, supported by services, but momentum eased from Q4. On the investment side, good growth in machinery, equipment and intellectual property products were offset by another large contraction in residential investment (-7.9% q/q) and weaker outlays on engineering structures. Government investment also reversed after gains in late 2025.
Overall, the economy continues to muddle along with limited forward momentum. While early Q2 indicators suggest some rebound (with April GDP tracking higher), the broader trend still points to slack in the economy and subdued growth.
Canada’s lackluster growth performance puts the focus squarely on the upcoming CUSMA review. The economy has operated under the cloud of uncertain U.S. market access ever since the first tranche of tariffs were announced last year. On Monday the three countries are due to notify each other of what changes they want in the agreement, with discussions to follow. The United States and Mexico have already scheduled formal negotiating rounds. Minister for U.S.-Canada Trade Dominic Leblanc is expected to travel to Washington next week, but the timelines for negotiations remain unclear.
To find some insights on the negotiations, Prime Minister Mark Carney’s speech in New York this week highlighted Canada’s strategy. He called for a “new partnership” with the United States, while simultaneously positioning Canada’s goal to establish itself as “an energy superpower”.
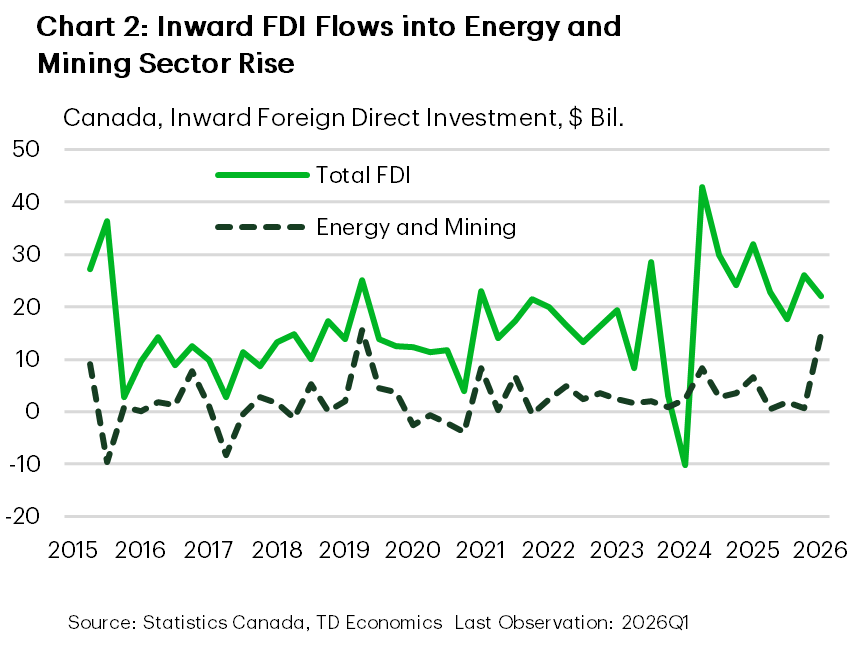
Recent foreign direct investment data suggest there might be something to the strategy. First quarter inflows were reported at $22 billion ($4 billion less than in Q4), and investments in the energy and mining sector were $14.7 billion in the quarter (Chart 2). While these data are volatile, they align with Canada’s strategy to leverage its resource base and attract long-term capital.
The Canadian economy continues to muddle along under a cloud of trade uncertainty. The hope is that in the coming months, clarity and stability on the trade relationship with the U.S. emerges. Increased economic certainty, together with the push to attract global capital to invest in Canada, can lay the foundation for productivity-powered economic growth.
U.S. – Makings of a Deal
It’s been three months since the U.S. and Israel launched the initial attack on Iran. Hopes for a longer-term peace resolution rose this week following President Trump’s comments that a peace deal had been “largely negotiated”. Oil prices fell sharply on the news, though renewed attacks from both sides by mid-week briefly faded the optimism. But by Thursday evening, news outlines were reporting that the two sides had reached an agreement on a 60-day memorandum of understanding to extend the ceasefire, pending President Trump’s approval. Oil prices traded 9% lower on the week and the WTI benchmark currently sits at $88 per barrel. Meanwhile, economic data out this week reinforced a more cautious but still resilient consumer amid renewed inflationary pressures. The S&P 500 edged 1.3% higher on the week, while the 10-Year Treasury yield drifted lower by 12 basis points and currently sits at 4.44%.
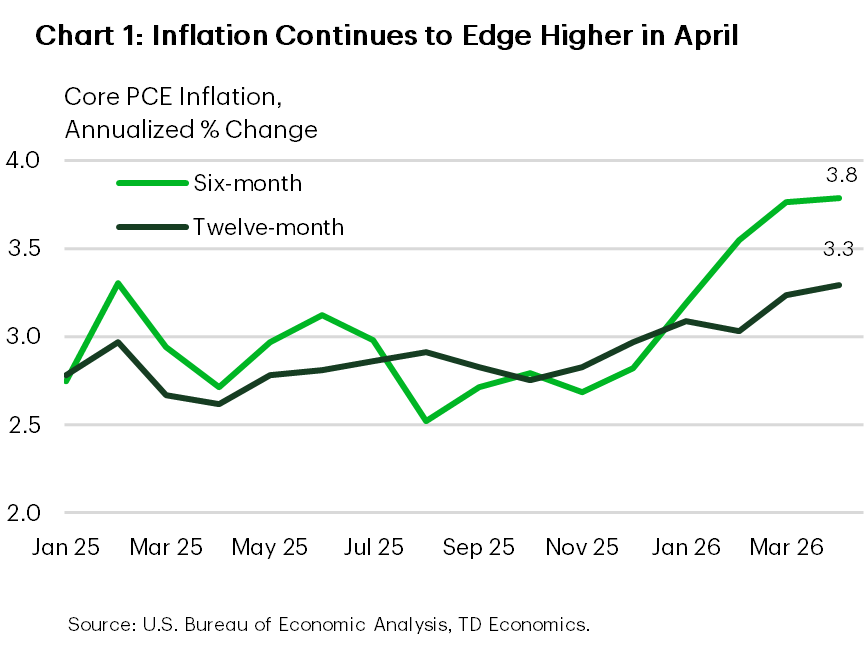
This week’s release of the April personal income & spending data offered a fresh dose of reality on the pain being inflicted on American households because of the energy shock. PCE inflation rose to a three-year high of 3.8% year-on-year and is likely to push north of 4% in May alongside a continued rise in gasoline prices. The picture didn’t look much better once the effects of food & energy were removed, with core PCE inflation edging up to 3.3%. Three-and-six-month measures are even hotter, each up 3.8% (Chart 1).
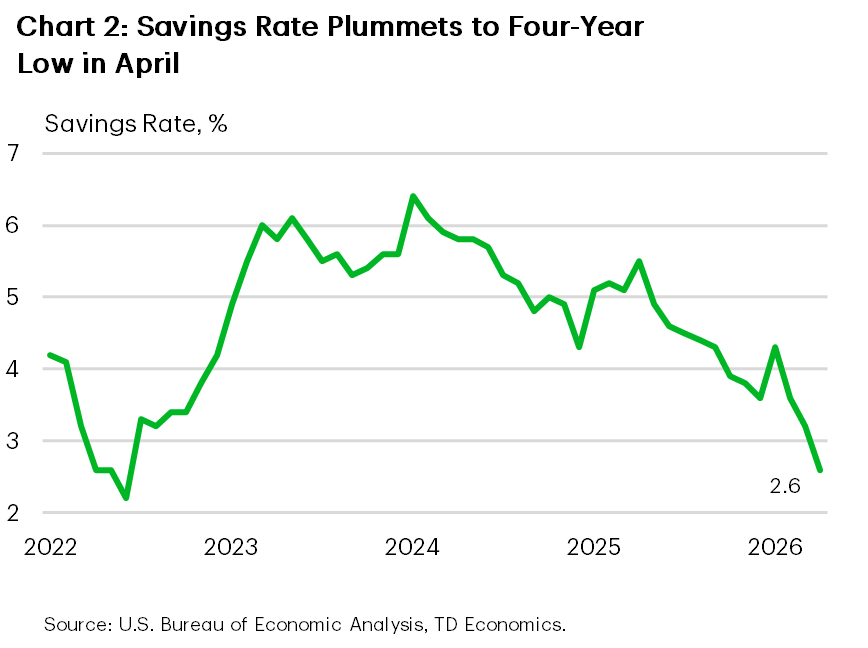
Despite the rise in inflation, the consumer has remained reasonably resilient. Nominal spending rose 0.5% m/m in April, following a stronger gain of 1% in March. After accounting for inflation, April’s gain looked less stellar, but still edged higher by 0.1% m/m. Hotter inflation is also working to erode consumer purchasing power, with real disposable income declining for a third consecutive month. This has left households increasingly reliant on savings to fuel spending. But with the savings rate having slipped to a four-year low, the buffer is looking increasingly thin.
According to a recent survey conducted by the Conference Board, households are reporting softer spending intentions in the months ahead. Fewer households are planning to purchase big-ticket items while two-thirds of consumers plan to reduce overall spending due to higher prices. While the survey metrics have been a less reliable predictor of actual spending post-pandemic, we can’t completely disregard the signal. The energy shock has further strained affordability for lower-and-middle income households, who have not benefited to the same degree from past year’s gains in home and equity prices.
And there’s an increasing risk that affordability pressures could worsen if the energy shock is sustained much longer. A growing chorus of Fed officials are sounding increasingly hawkish amid rising inflationary pressures. Board member Lisa Cook said this week that if disinflation doesn’t soon resume, she would be “prepared to raise rates”. Meanwhile, Fed President Kashkari reiterated that the inflation fight takes priority as the labor market now appears to be in decent shape. This suggests next week’s employment report will play second fiddle to the May CPI numbers due on June 10th. Fed futures are now 60% priced for a rate hike by year-end, but a hotter inflation report could pull forward expectations for a rate hike.